
Technology, Media and Telecom
5th MayPricing Strategy for Semiconductor Components
3 Min Read
The Nordic Data Center Market Report is Segmented by Data Center Size (Small, Medium, Large, Mega, Massive), Tier Standard (Tier 1 and 2, Tier 3, Tier 4), Absorption (Utilized by Colocation Type and End-User Industry, Non-Utilized), Country (Sweden, Norway, Finland, Rest of Nordic). The Market Forecasts are Provided in Terms of Value (Megawatt).
Market Overview
| Study Period | 2019 - 2031 |
|---|---|
| Base Year For Estimation | 2024 |
| Forecast Data Period | 2025 - 2031 |
| Market Volume (2025) | 1.32 Thousand megawatt |
| Market Volume (2031) | 1.82 Thousand megawatt |
| CAGR | 6.61 % |
| Market Concentration | Medium |
Major Players *Disclaimer: Major Players sorted in no particular order. Image © Mordor Intelligence. Reuse requires attribution under CC BY 4.0. |
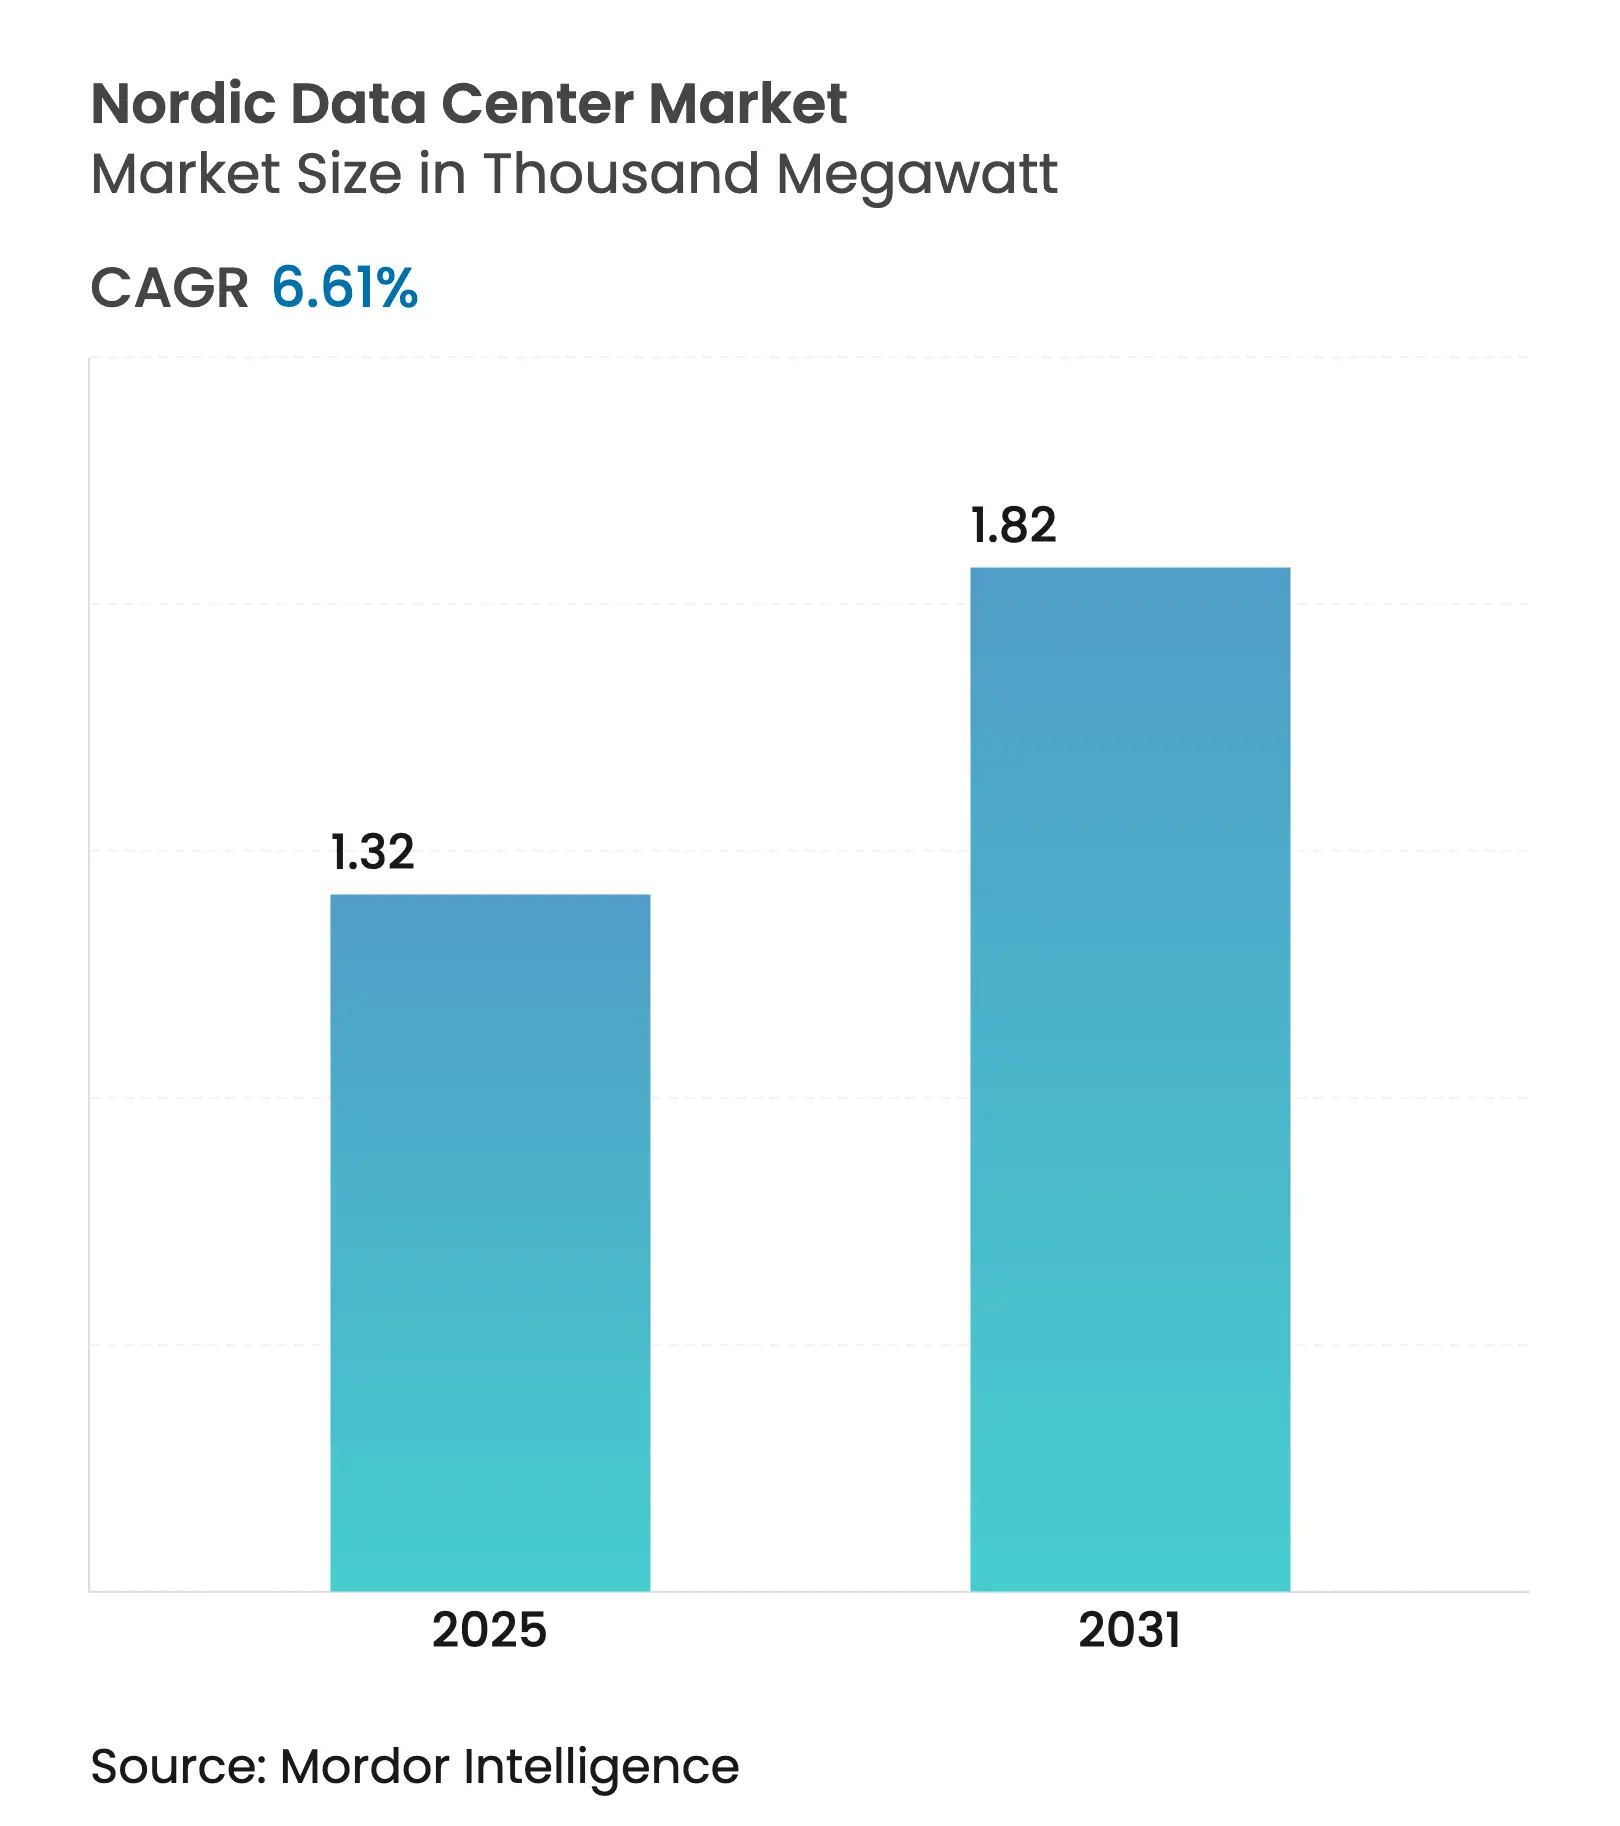
The Nordic data center market volume reached USD 1.32 MW in 2025 and is forecast to advance to USD 1.98 MW by 2031, translating into a 6.61% CAGR over the period. This momentum stems from a blend of low-cost renewable electricity, cool ambient temperatures that lower power-usage effectiveness (PUE), and heightened demand for AI-ready infrastructure. Hyperscale providers are accelerating site selection in Sweden, Norway, and Finland to secure long-term green-energy contracts, while regional specialists refine heat-recovery models that generate incremental revenue and bolster local sustainability goals. Connectivity remains competitive with new submarine cables and diverse terrestrial routes linking the Nordics to Frankfurt, Amsterdam, and London. Government tax abatements and streamlined permitting programs further narrow total-cost-of-ownership gaps versus traditional FLAP-D clusters. Collectively, these forces reinforce the Nordic data center market as Europe’s most attractive expansion corridor for power-dense AI and HPC workloads.
Key Report Takeaways
Drivers Impact Analysis
| DRIVER | (~) % IMPACT ON CAGR FORECAST | GEOGRAPHIC RELEVANCE | IMPACT TIMELINE | |||
|---|---|---|---|---|---|---|
Abundant low-cost renewable energy (hydro, wind) Abundant low-cost renewable energy (hydro, wind) | +2.1% | Sweden, Norway, Finland | Long term (≥ 4 years) | (~) % IMPACT ON CAGR FORECAST:+2.1% | GEOGRAPHIC RELEVANCE:Sweden, Norway, Finland | IMPACT TIMELINE:Long term (≥ 4 years) |
Cool climate enabling free-air cooling and lower PUE Cool climate enabling free-air cooling and lower PUE | +1.8% | All Nordic countries | Medium term (2-4 years) | |||
Robust fiber and submarine-cable connectivity Robust fiber and submarine-cable connectivity | +1.3% | Sweden, Finland, Denmark | Medium term (2-4 years) | |||
Government tax incentives and fast-track permits Government tax incentives and fast-track permits | +1.1% | Norway, Denmark, Sweden | Short term (≤ 2 years) | |||
AI/HPC power-dense workloads migrating from FLAP-D AI/HPC power-dense workloads migrating from FLAP-D | +1.7% | Sweden, Finland, Norway | Short term (≤ 2 years) | |||
Heat-re-use revenue streams via district-heating deals Heat-re-use revenue streams via district-heating deals | +0.9% | Sweden, Finland, Denmark | Long term (≥ 4 years) | |||
| Source: Mordor Intelligence | ||||||
Abundant Low-Cost Renewable Energy Drives Infrastructure Migration
Nordic electricity generation exceeds 90% from renewable sources, anchored by hydro in Norway and Sweden and rising onshore wind volumes in all markets. Levelized wind-power costs in Sweden fell to 32 öre/kWh in 2024, yielding a 40-60% price advantage over continental Europe. Brookfield committed SEK 95 billion (USD 10 billion) to build a 750 MW AI-focused campus in Strängnäs, citing long-term access to carbon-free energy as the decisive factor.[1]Brookfield Asset Management, “Brookfield To Advance AI Infrastructure in Sweden Through SEK 95 Billion Investment,” bam.brookfield.com Microsoft’s USD 3.2 billion Swedish expansion follows the same strategy, locking in 100% renewable supply under multi-decade power-purchase agreements. These investments confirm that cheap green power is the cornerstone of hyperscale site selection in the region.
Cool Climate Optimization Transforms Cooling Economics
Average annual temperatures below 10 °C enable 8,000 hours of free-air cooling per year, supporting facility-level PUEs as low as 1.09. Interxion’s Stockholm campus saves USD 1 million annually by using seawater heat exchange systems and drives a sub-12-month payback on additional civil works. GlobalConnect piloted submerged cooling that reduces cooling energy by 90% and raises rack densities to 100 kW.[2]GlobalConnect Group, “First Colocation Provider to Offer Submerged Cooling in Europe,” globalconnectgroup.com As generative-AI clusters generate 3-5× more heat than legacy applications, these thermal advantages elevate the Nordic value proposition.
AI Workload Migration Accelerates Nordic Adoption
Power-dense AI and HPC tenants require 20-50 MW per hall and multi-gigawatt grid roadmaps. OpenAI’s Stargate Norway will deploy 100,000 GPUs on renewable hydroelectric power, confirming the region’s capacity to host extreme-density workloads.[3]Fortum, “Data Centers and District Heating—A Perfect Match,” fortum.com CoreWeave’s USD 2.2 billion Nordic program targets rapid 2025 go-live dates unattainable in congested FLAP-D hubs. Availability of 400 kV transmission corridors and expedited land-use permits compress deployment timelines by up to 24 months compared with Frankfurt and London.
Government Incentives Enhance Investment Attractiveness
Norway offers real-estate tax relief and depreciates ICT equipment over two years to stimulate data-center capital flows. Sweden granted SEK 756 million in power-cost compensation to energy-intensive facilities during 2024, supporting operational competitiveness. Finland will lower corporate tax to 18% by 2026 and has earmarked EUR 3.2 billion for R&D, reinforcing its position as the region’s fastest-growing locale.
Restraints Impact Analysis
| RESTRAINTS | (~) % IMPACT ON CAGR FORECAST | GEOGRAPHIC RELEVANCE | IMPACT TIMELINE | |||
|---|---|---|---|---|---|---|
Grid-connection bottlenecks near major Nordic hubs Grid-connection bottlenecks near major Nordic hubs | -1.4% | Sweden (Stockholm), Finland (Helsinki) | Medium term (2-4 years) | (~) % IMPACT ON CAGR FORECAST:-1.4% | GEOGRAPHIC RELEVANCE:Sweden (Stockholm), Finland (Helsinki) | IMPACT TIMELINE:Medium term (2-4 years) |
Lengthy municipal and environmental permitting cycles Lengthy municipal and environmental permitting cycles | -0.9% | All Nordic countries | Short term (≤ 2 years) | |||
Shortage of certified DC engineers and technicians Shortage of certified DC engineers and technicians | -0.7% | Norway, Sweden, Finland, Denmark | Long term (≥ 4 years) | |||
Heightened scrutiny of water use for liquid cooling Heightened scrutiny of water use for liquid cooling | -0.5% | Denmark, Sweden coastal areas | Medium term (2-4 years) | |||
| Source: Mordor Intelligence | ||||||
Grid-Connection Bottlenecks Constrain Expansion Near Urban Centers
Transmission operators anticipate 3-7-year queuing for greater than 50 MW interconnections in Stockholm and Helsinki as demand from data centers collides with electrification of transport and heavy industry. Developers increasingly pivot to secondary cities with spare capacity, but those locations often lack comparable fiber diversity, forcing trade-offs on latency-sensitive workloads.
Skills Shortage Threatens Operational Scalability
IEEE reports that 58% of global data-center operators struggle to hire enough certified technicians, and Nordic vacancy rates for mechanical and electrical engineers exceed 15%. Operators respond by automating routine maintenance, deploying digital-twin platforms, and partnering with vocational institutions to accelerate talent pipelines.
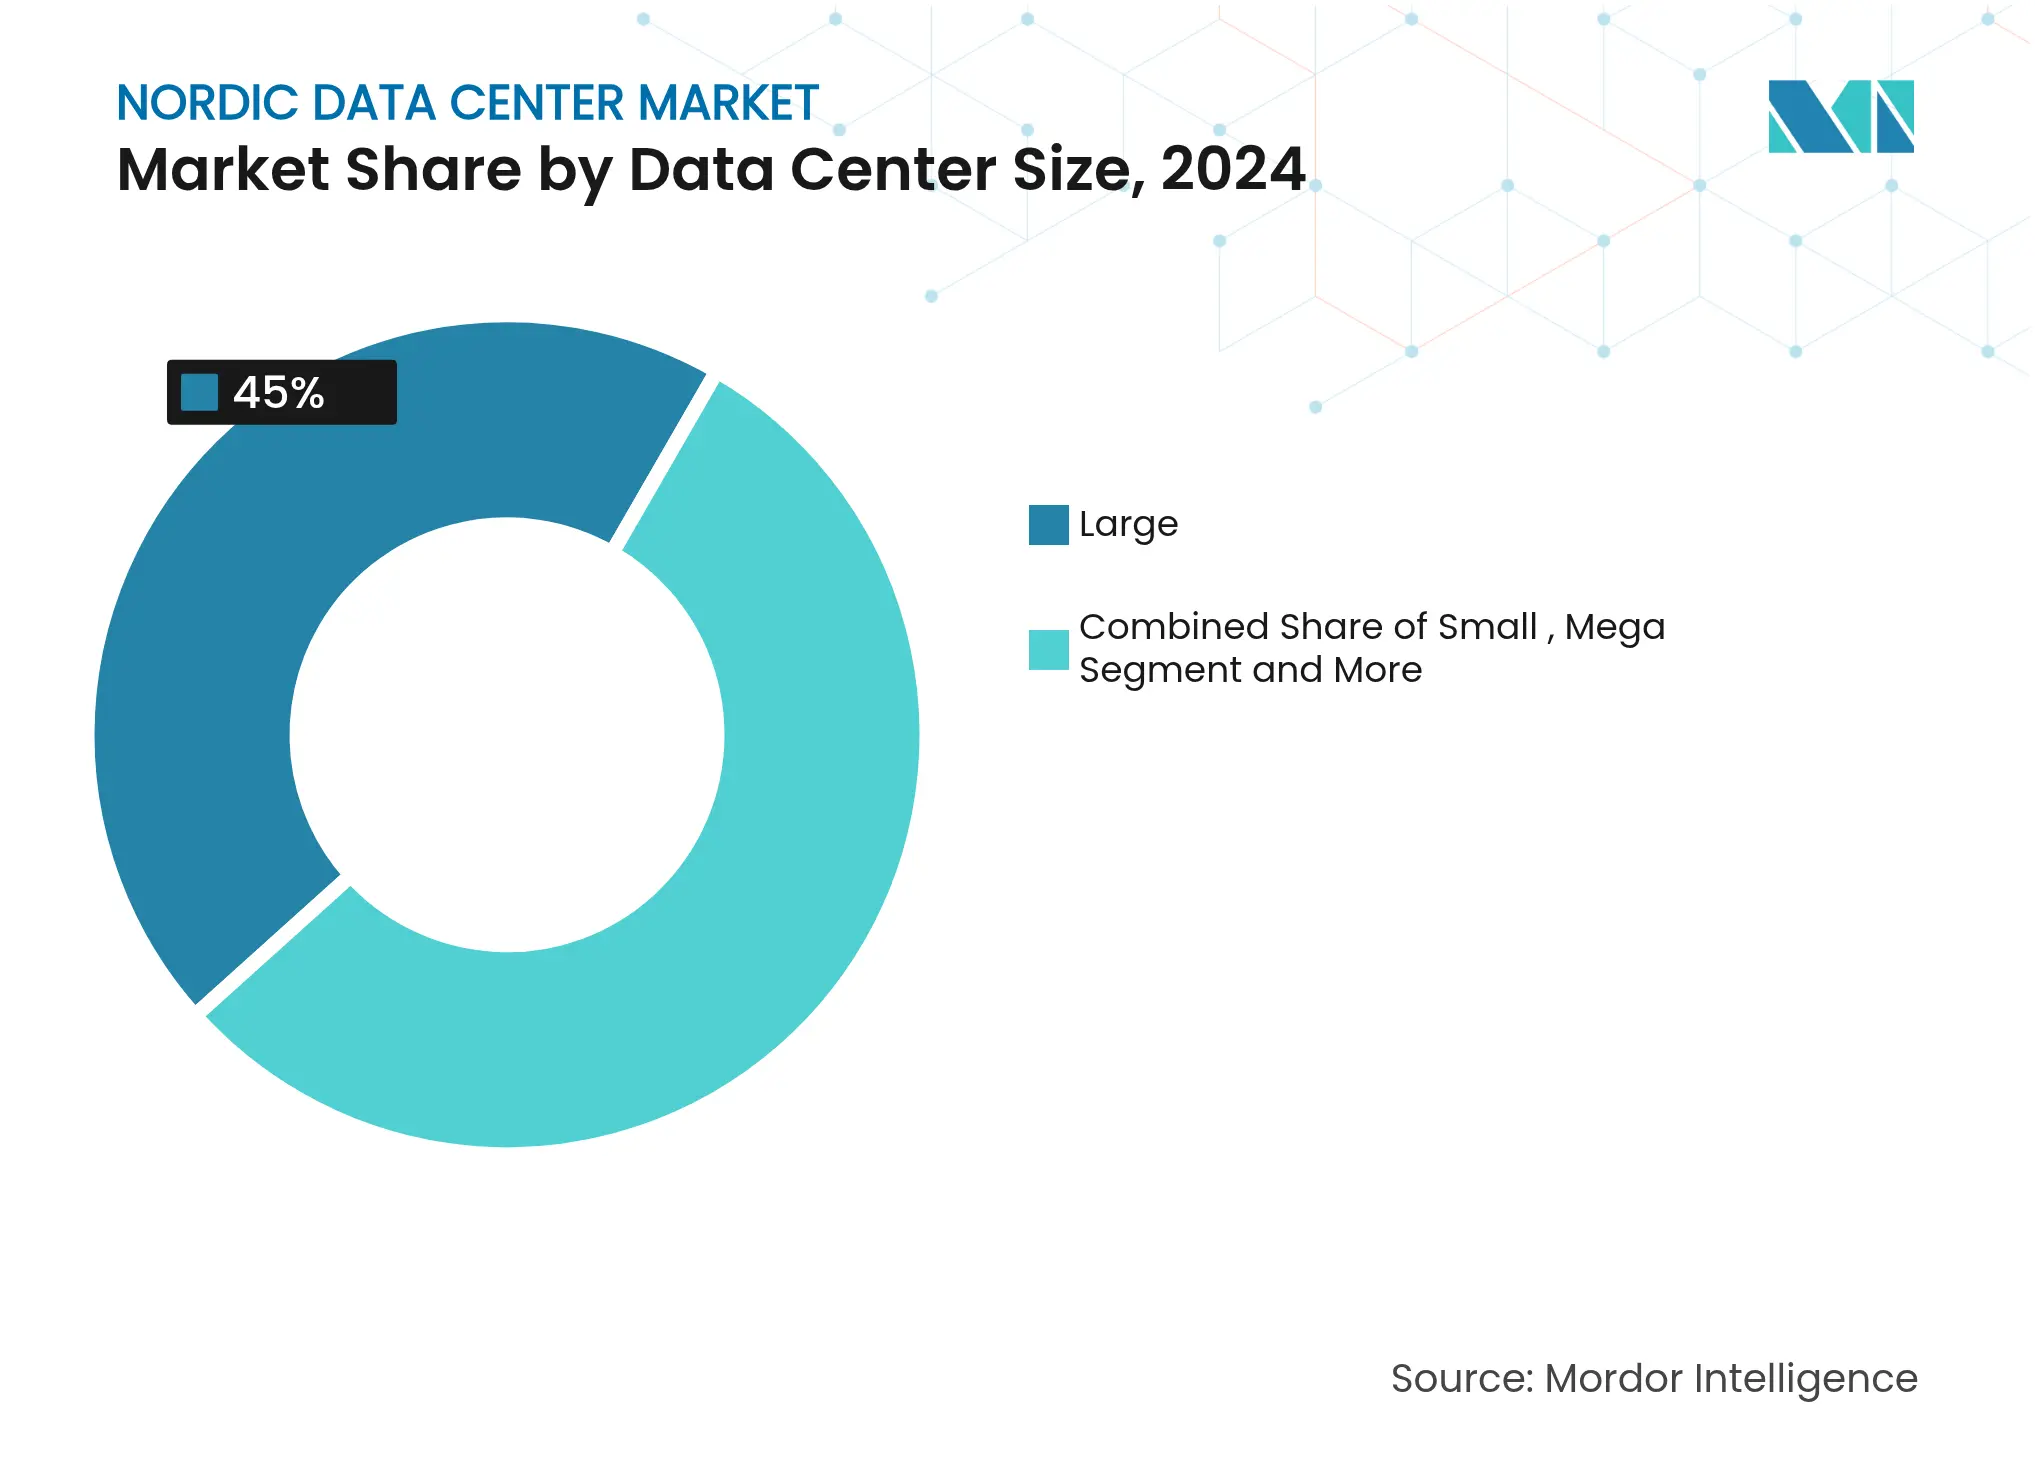
By Data Center Size: Mega Facilities Drive Growth
Large facilities hold 45% revenue today, reflecting enterprise and wholesale colocation demand. Yet mega campuses (50–100 MW) post the highest 8.90% CAGR, underpinned by AI-training clusters requiring contiguous power blocks. The Nordic data center market size for mega facilities is forecast to exceed USD 900 million by 2031. EcoDataCenter’s planned 240–360 MW Borlänge build and Brookfield’s 750 MW Strängnäs campus exemplify this supersizing trend. Small and medium footprints persist for edge latency and state-or-local-mandated data-sovereignty use cases.
Mega-site economics benefit from scale efficiencies in power procurement, automated operations, and advanced cooling infrastructure such as direct-to-chip liquid systems delivering densities above 120 kW per rack. Operators incorporate modular battery energy-storage systems and on-site hydrogen-ready generators to future-proof capacity delivery. The shift to mega footprints unlocks new district-heating partnerships, monetizing waste heat at volumes unattainable for sub-10 MW buildings.
Note: Segment shares of all individual segments available upon report purchase
By Tier Standard: Tier 4 Expansion Reflects Uptime Demands
Tier 3 remains dominant at 56% of deployed white space, offering 99.982% availability at economically viable capex. Tier 4, however, rises fastest at 9.00% CAGR as national-critical-infrastructure clients and financial firms demand 99.995% fault tolerance. Digital Realty’s liquid-to-chip solution, certified Tier 4-ready, doubles per-rack densities without compromising redundancy. Tier 1-2 space caters to edge aggregation and test-dev environments where cost outweighs extreme resilience.
Liquid and immersion cooling blur historical tier cost deltas by combining mechanical system simplification with electronic trip-catch functionality. This convergence allows Tier 4 features, such as concurrent maintainability and fault tolerance, to be achieved inside footprints traditionally budgeted for Tier 3, enhancing the Nordic data center market size competitiveness for mission-critical outsourcing.
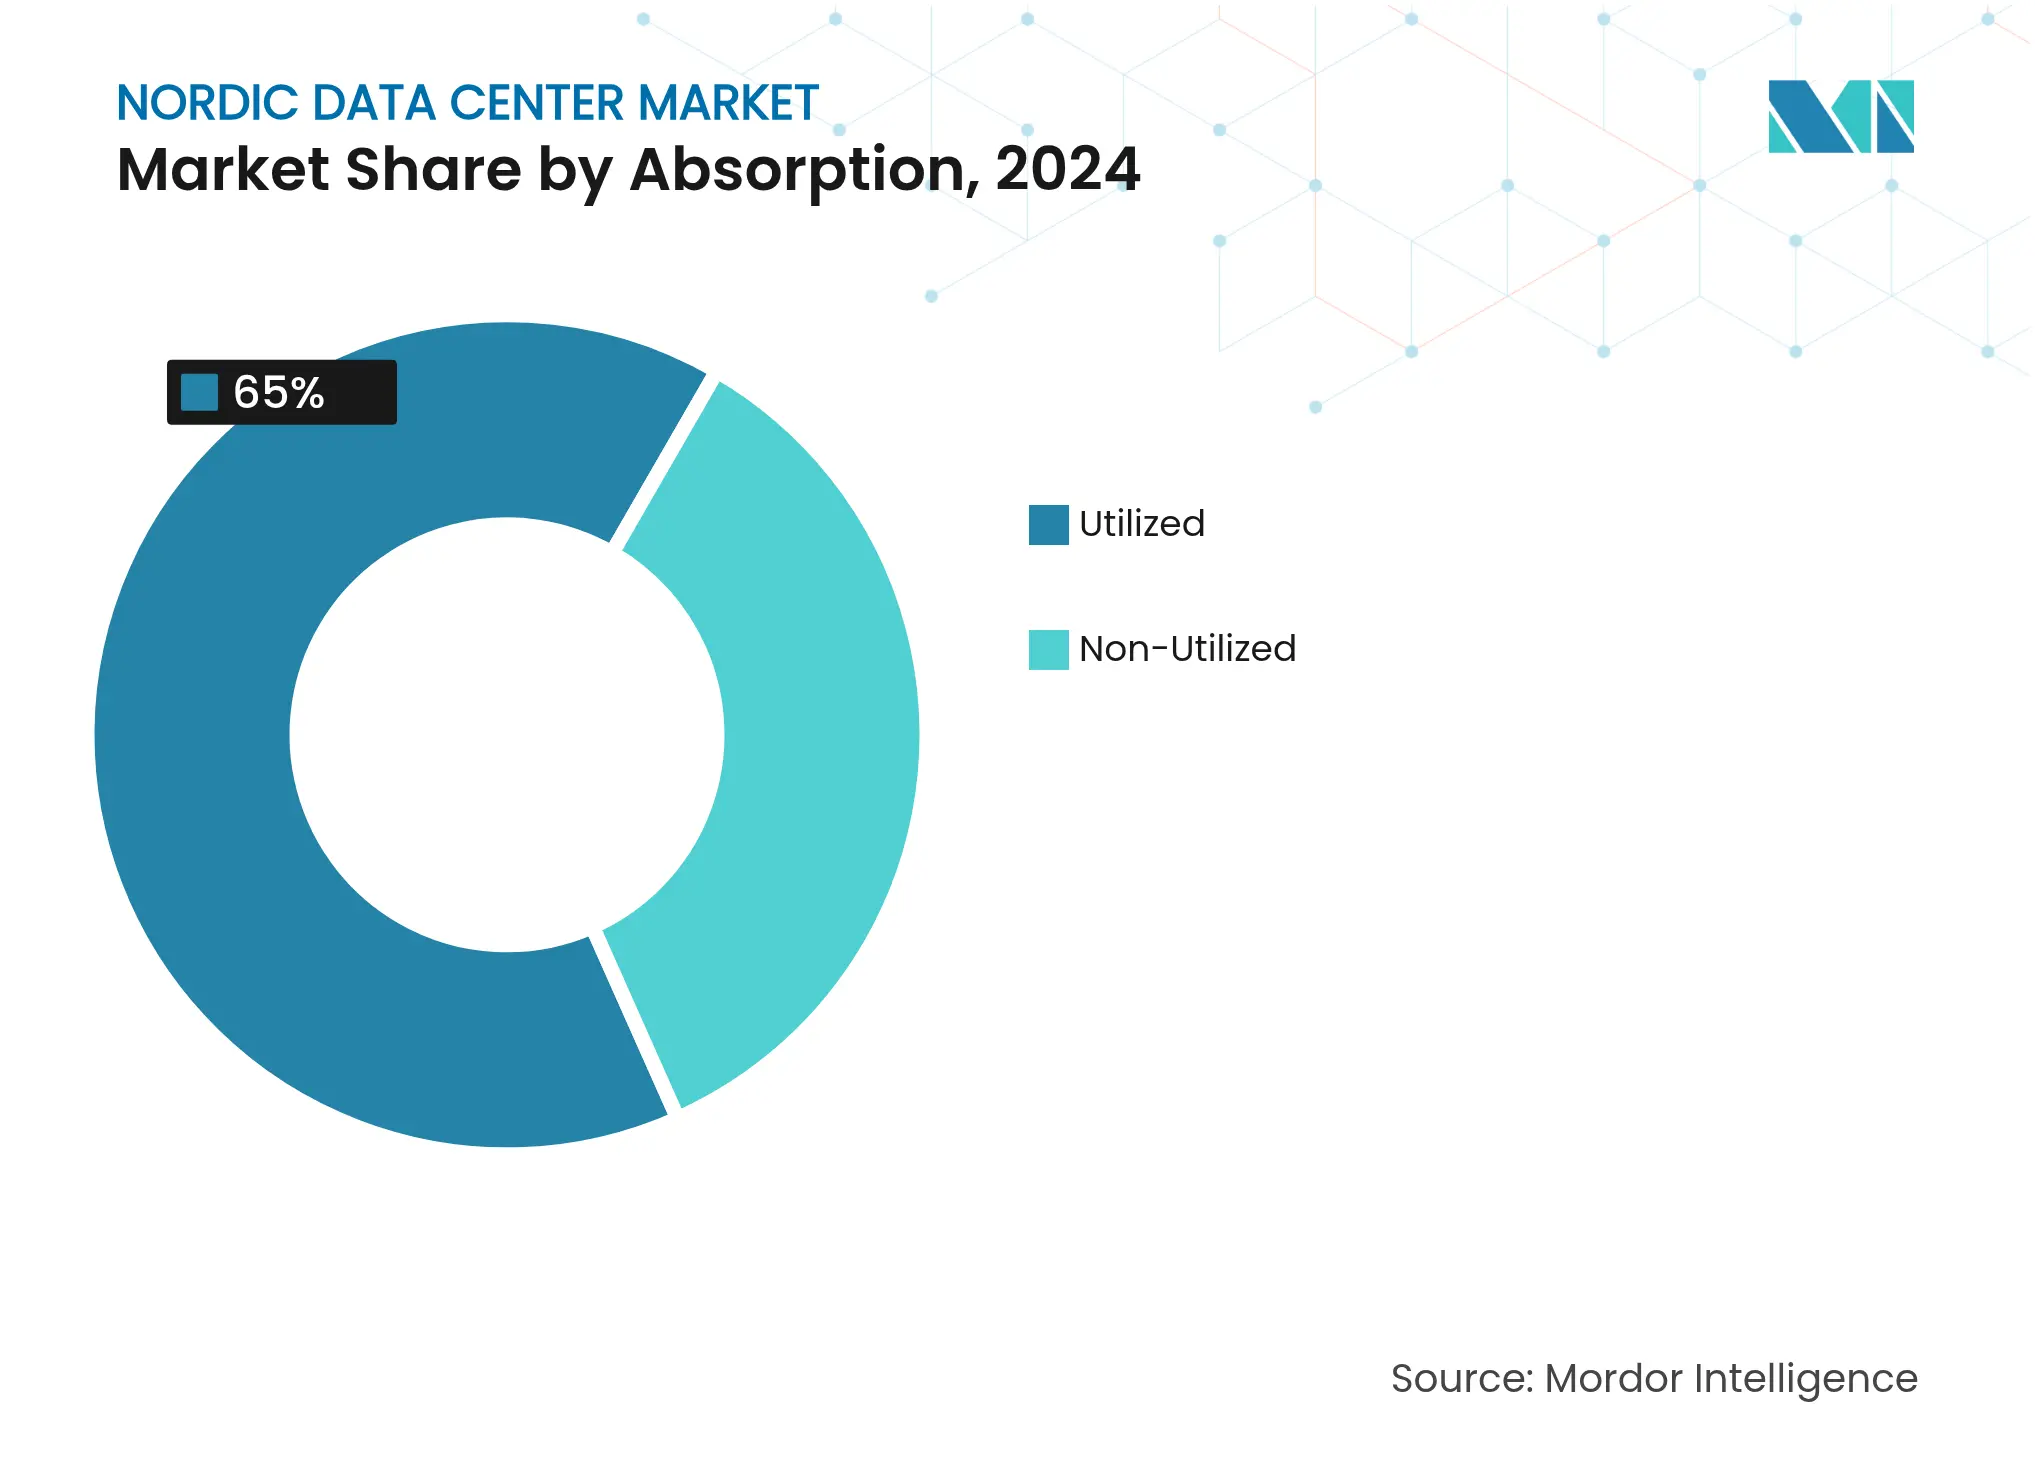
By Absorption: Hyperscale Colocation Leads Growth
Utilized capacity stands at 65% across the region, evidencing disciplined supply alignment. Hyperscale colocation achieves 10.10% CAGR as cloud, consumer internet, and AI-as-a-service firms lock in multi-megawatt halls on 10- to 15-year terms. Retail colocation growth flatlines in relative terms but remains vital for network-dense ecosystems. Non-utilized space (35%) provides rapid ramp options and enables phased fit-out, balancing developer cash flow.
Sector diversification is broad: cloud accounts for 38% of live MW, BFSI 14%, digital media 11%, and manufacturing 9%. Government initiatives around digital sovereignty further stimulate regional demand, particularly in Norway’s defense and public-safety verticals. This balanced mix insulates the Nordic data center industry from cyclical swings in any single customer cohort.
By Country: Sweden Leads While Finland Accelerates
Sweden controls 36% of current revenue, anchored by a robust carrier-neutral ecosystem around Stockholm and hydro-wind generation that cut electricity costs by up to 45% versus Frankfurt. The Nordic data center market size for Sweden is projected to reach USD 720 million by 2031 at a 7.6% CAGR. Secondary metros such as Borlänge and Luleå are capturing hyperscale spillover as Stockholm’s grid hits short-term saturation. Finland’s market advances at 9.10% CAGR, propelled by Google’s EUR 1 billion Hamina expansion and TikTok’s pending EUR 1 billion campus. Affordable wind tariffs and forthcoming 18% corporate tax reinforce its cost leadership. Norway and the rest of the Nordics supply niche propositions—hydroelectric abundance, geothermal baseload, or fiscal incentives—that collectively diversify regional deployment options.
Finland’s proactive semiconductor roadmap, targeting EUR 5–6 billion output by 2035, aligns chip fabrication and AI data-center growth, strengthening national digital-economy ambitions. Cross-border dark-fiber builds, such as GlobalConnect’s SEK 75 million Sweden-Finland terrestrial link, improve route diversity and latency performance. Consequently, Nordic data center market share gains will tilt incrementally from Sweden toward Finland and Norway through 2030 as hyperscale buyers prioritize available megawatt roadmaps and streamlined permitting in emerging sites.
Sweden anchors the Nordic data center market with 36% revenue share and houses the largest carrier hub in Stockholm, where more than 125 networks interconnect. Wind-power prices below USD 0.03/kWh keep total electricity cost at the lowest end of European benchmarks, though grid-connection lead times in Mälardalen stretch beyond five years without capacity upgrades. As a result, hyperscalers pivot to central-Sweden municipalities offering new 400 kV substations co-funded by Svenska kraftnät.
Finland emerges as the fastest-growing node, charting 9.10% CAGR through 2030 on the back of repeat hyperscale commitments in Hamina and Hanko. Government corporate-tax cuts and EUR 3.2 billion R&D incentives buttress competitiveness, while district-heating schemes convert server exhaust into community heating that covers two-thirds of Mäntsälä’s winter demand. Cross-border fiber extensions strengthen Helsinki’s position as a strategic landing point for Asia-to-Europe telecom traffic via the upcoming Far North Fiber route.
Norway capitalizes on 100% hydroelectric generation to attract AI-training clusters such as OpenAI’s 230 MW Stargate phase one. Fjord-water cooling allows PUEs near 1.07, offsetting high construction costs associated with complex topography. Denmark and Iceland round out the region with specialized propositions—tax-free heat reuse in Copenhagen and geothermal baseload in Keflavík—providing niche options for latency-tolerant or sustainability-maximized deployments. Together, these geographies form an inter-linked mesh that offers investors route diversity, renewable abundance, and scalable land parcels unavailable in Europe’s legacy hubs.
Market Concentration
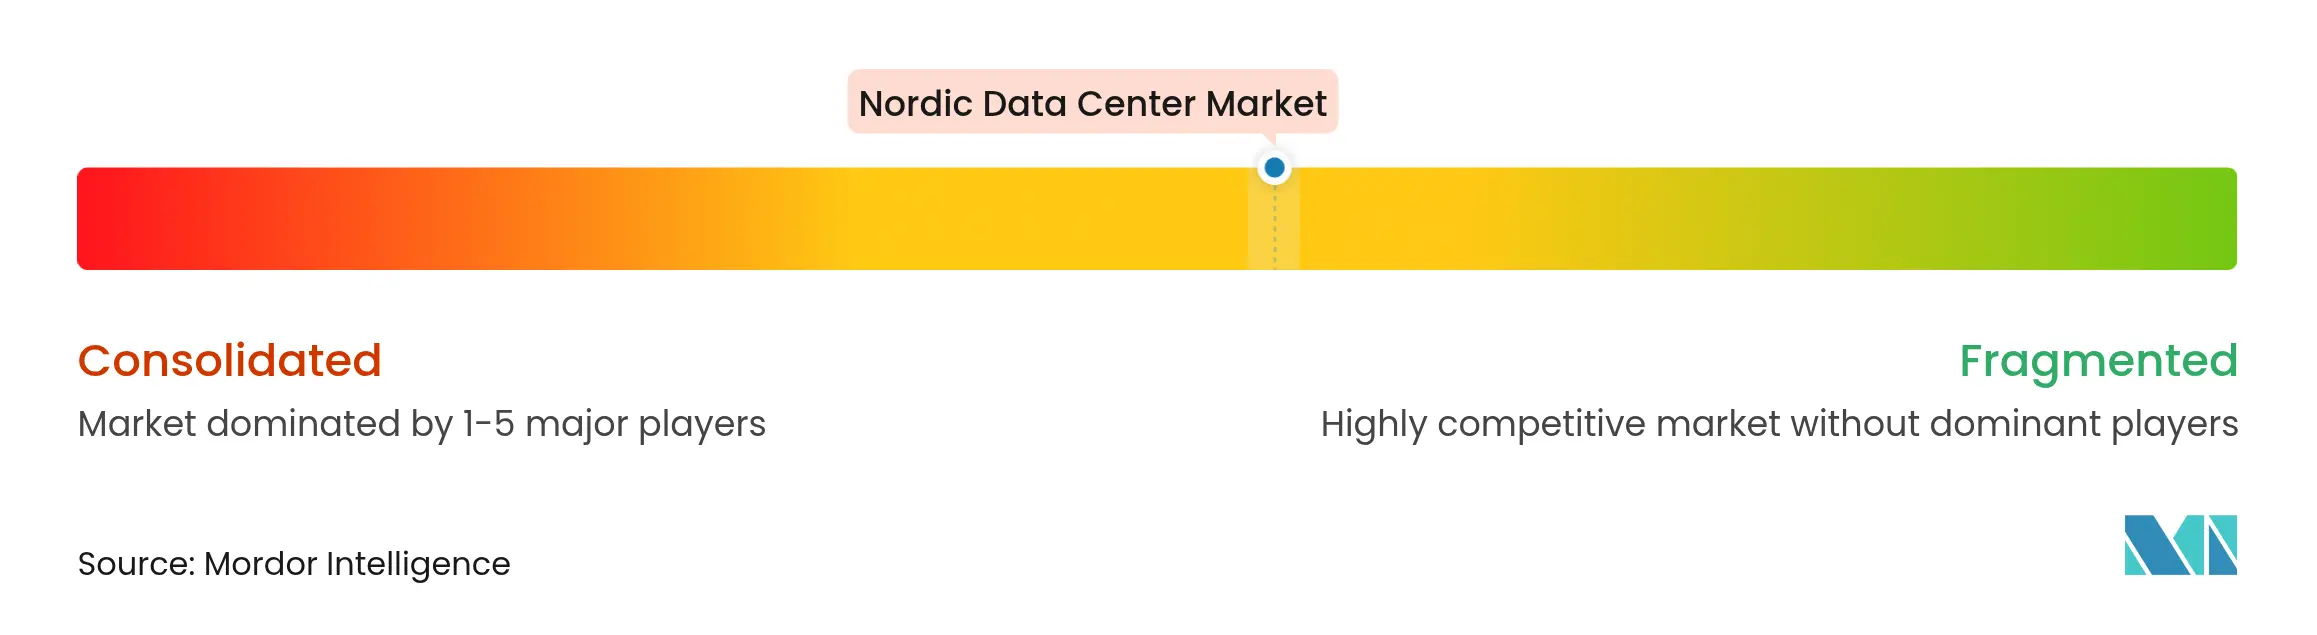
The Nordic data center market shows moderate concentration: the top five operators—Equinix, Digital Realty, Bulk Infrastructure, atNorth, and Green Mountain—collectively control roughly 42% of installed MW. Global platforms leverage balance-sheet strength and cross-regional customer relationships, while local champions win projects by integrating renewable PPAs, district-heating offtakes, and novel cooling. Recent platform investments include Digital Realty rolling out liquid-to-chip solutions across its Nordic footprint and Bulk Infrastructure advancing a 300 MW expansion corridor along Norway’s Sørlandet coast.
Technology differentiation intensifies as operators race toward sub-1.10 PUE and rack densities edging past 150 kW. Providers deploy AI-enabled facilities-management suites that optimize airflow, predict transformer loading, and schedule maintenance without human intervention. Regulatory headwinds such as the EU Energy Efficiency Directive favor incumbents possessing ISO 50001 and ISO 14001 certifications; newer entrants face sizable compliance capex before they can secure blue-chip tenants. M&A remains active: Areim’s USD 481 million sustainability-focused fund aims to assemble a 200 MW portfolio across Sweden by 2027, underscoring investor appetite for green-aligned assets.
Despite robust capital inflows, secondary and tertiary markets still host numerous single-site operators, ensuring dynamic competition on price, service, and ESG performance. Market equilibrium thus hinges on sustained renewable capacity additions and continued permitting efficiencies to avoid supply gluts that could erode price per kilowatt returns.

*Disclaimer: Major Players sorted in no particular order
1. INTRODUCTION
2. RESEARCH METHODOLOGY
3. EXECUTIVE SUMMARY
4. MARKET LANDSCAPE
5. KEY INDUSTRY TRENDS
6. MARKET OUTLOOK
7. MARKET SIZE AND GROWTH FORECASTS (VALUE AND MW)
8. COMPETITIVE LANDSCAPE
9. MARKET OPPORTUNITIES AND FUTURE OUTLOOK
A data center is a physical space, such as a room, building, or facility, that serves as a hub for deploying, operating, and delivering applications and services that rely on IT infrastructure.
The Nordic data center market is segmented by data center size (large, massive, medium, mega, and small), tier type (tier 1 and 2, tier 3, and tier 4), absorption (non-utilized and utilized), and country (Denmark, Norway, Sweden, Finland, and Iceland). The market sizes and forecasts are provided in terms of volume in megawatts (MW) for all the above segments.
Pricing Strategy for Semiconductor Components
3 Min Read
Accelerating Additive Manufacturing Adoption in India
3 Min Read
Unlocking Opportunities in Singapore's Chemical Logistics Market
5 Min Read
When decisions matter, industry leaders turn to our analysts. Let’s talk.