Norway Data Center Market Size and Share
Market Overview
| Study Period | 2020 - 2031 |
|---|---|
| Forecast Data Period | 2026 - 2031 |
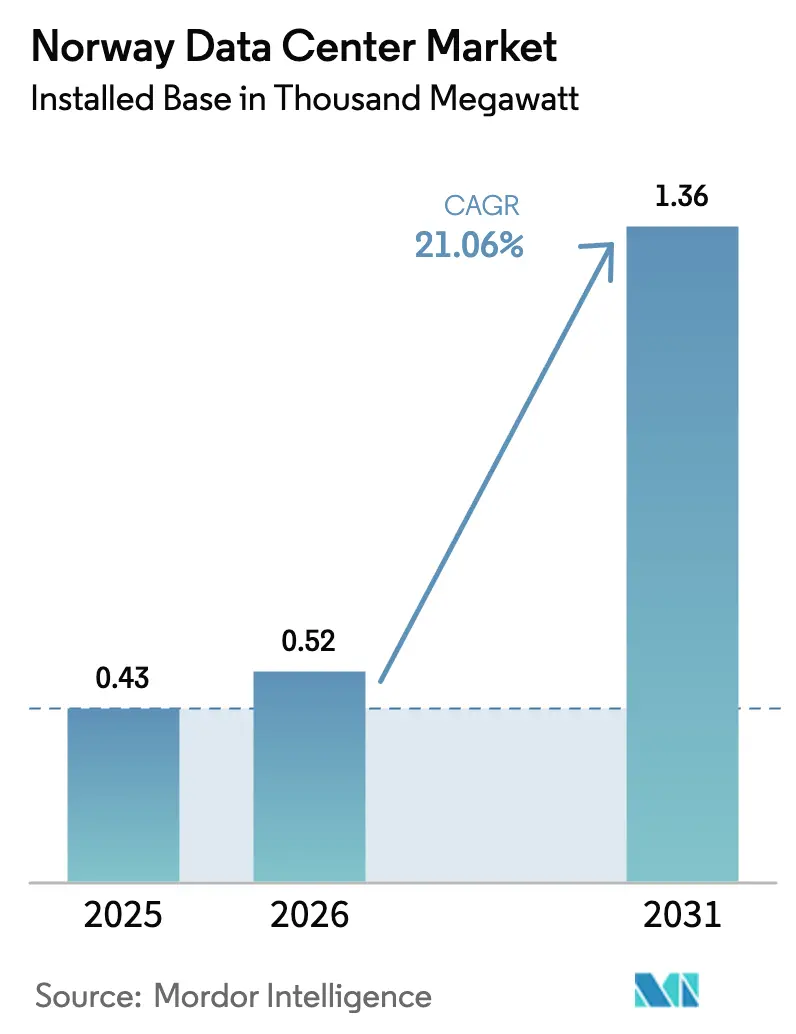
| Base Year Market Size (2025) | 0.43 Thousand megawatt |
| Market Volume (2026) | 0.52 Thousand megawatt |
| Market Volume (2031) | 1.36 Thousand megawatt |
| Growth Rate (2026 - 2031) | 21.06% CAGR |
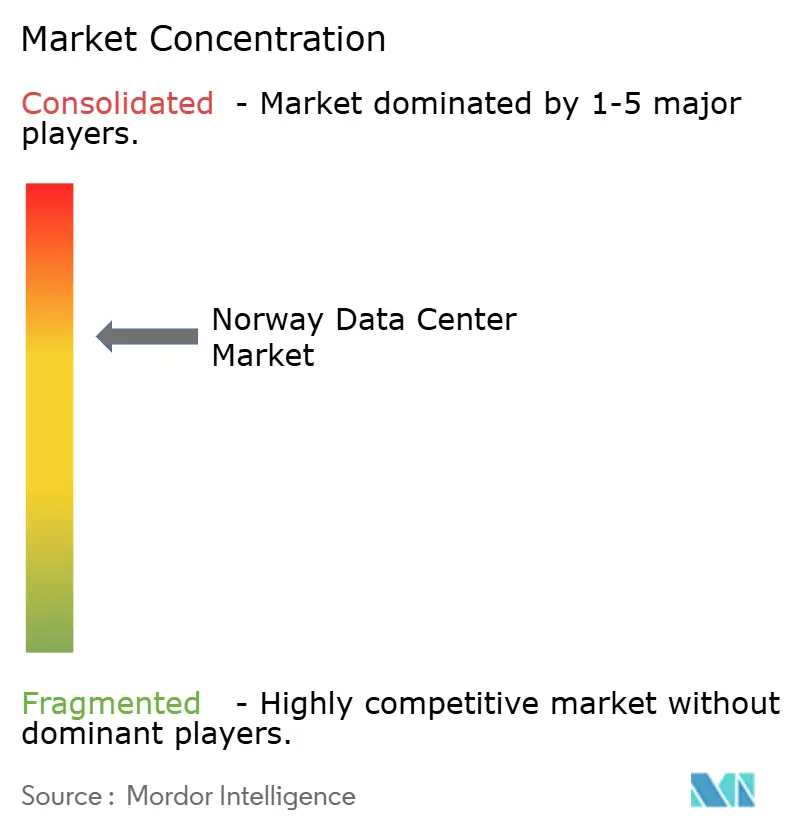
| Market Concentration | Medium |
Major Players *Disclaimer: Major Players sorted in no particular order Image © Mordor Intelligence. Reuse requires attribution under CC BY 4.0. | |
Norway Data Center Market Analysis by Mordor Intelligence
The Norway data center market size in terms of installed base is projected to be 0.43 thousand megawatt in 2025, 0.52 thousand megawatt in 2026, and reach 1.36 thousand megawatt by 2031, growing at a CAGR of 21.06% from 2026 to 2031. Norway’s nearly zero-carbon electricity mix, sub-Arctic climate, and maturing fiber backbone are aligning to draw hyperscalers and enterprise workloads away from congested continental hubs. Operators are translating the 98% renewable energy share into power-usage-effectiveness ratios below 1.25, a metric that directly lowers operating cost for compute-intensive artificial-intelligence clusters. National transmission-tariff discounts for multi-gigawatt-hour consumers, mandatory heat-reuse rules for facilities above 5 MW, and an accelerating pipeline of district-heating projects further strengthen the local cost curve. At the same time, grid-connection queues, rising construction costs, and a prospective carbon tax on embodied emissions are placing a premium on vertically integrated developers with long-term power contracts and engineering depth.
Key Report Takeaways
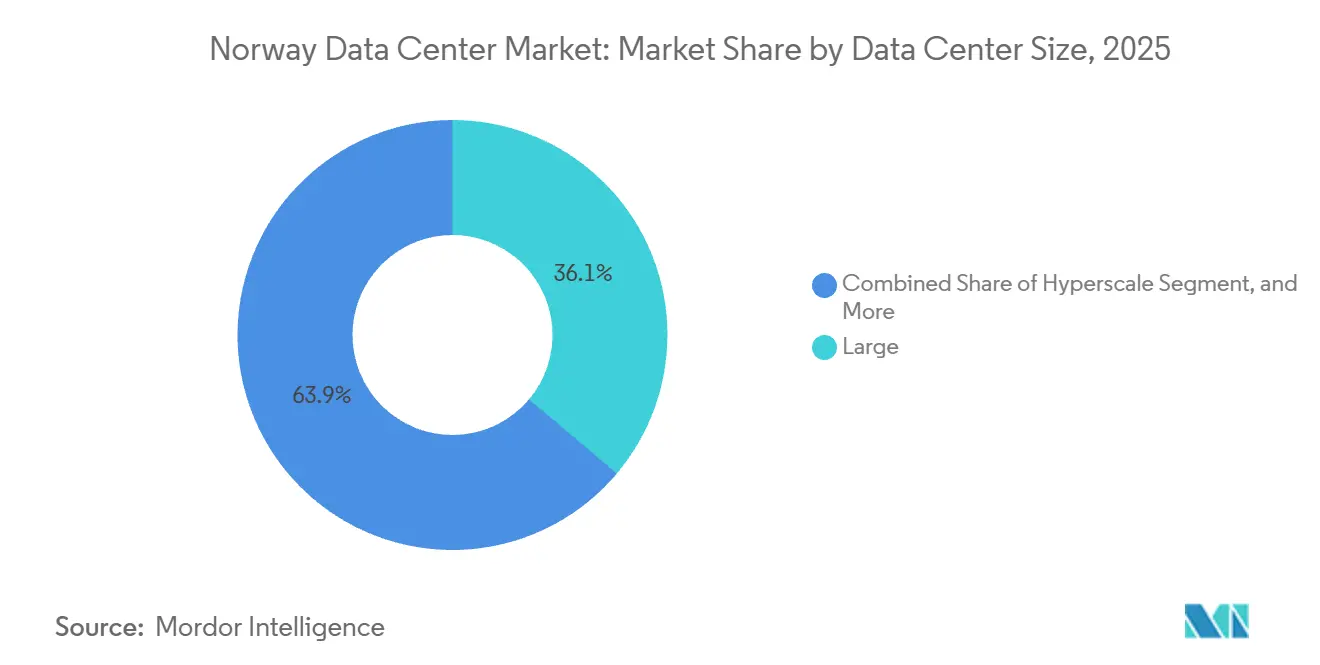
- By data center size, large facilities held 36.14% of installed capacity in 2025, while hyperscale sites above 10 MW are forecast to grow at a 22.12% CAGR through 2031.
- By tier type, tier 3 installations accounted for 74.15% of the Norway data center market share in 2025, and tier 4 capacity is advancing at a 22.32% CAGR through 2031.
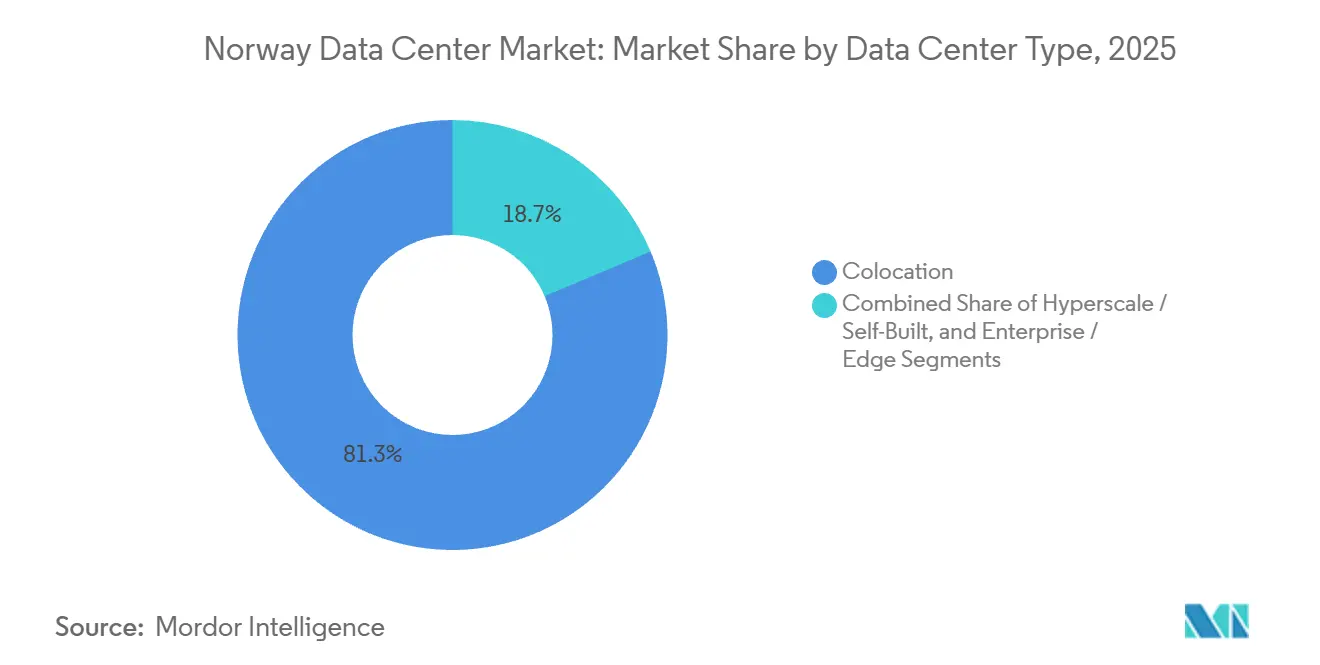
- By data center type, colocation captured 81.35% of capacity in 2025, yet hyperscale and self-built facilities are projected to expand at a 22.56% CAGR over the same period.
- By end user, the IT and ITES segment accounted for 45.74% of the Norway data center market in 2025, while banking, financial services, and insurance (BFSI) workloads are projected to grow at a 23.16% CAGR through 2031.
- By hotspot, Oslo held 38.92% of installed capacity in 2025, whereas Vestland is expected to register a 22.78% CAGR and take the lead in growth during the forecast window.
Note: Market size and forecast figures in this report are generated using Mordor Intelligence’s proprietary estimation framework, updated with the latest available data and insights as of 2026.
Norway Data Center Market Trends and Insights
Drivers Impact Analysis*
| Driver | (~) % Impact on CAGR Forecast | Geographic Relevance | Impact Timeline |
|---|---|---|---|
| Abundant Renewable Hydro-Power Availability Lowers PUE | +4.5% | Vestland and Trøndelag hydro corridors | Long term (≥ 4 years) |
| Cool Nordic Climate Cuts Annual Cooling OPEX | +3.8% | Northern counties above 65°N latitude | Long term (≥ 4 years) |
| Government Incentives and Pro-Digital Policies | +3.2% | Oslo and Vestland fast-track zones | Medium term (2-4 years) |
| Dense International Submarine and Terrestrial Fiber Routes | +2.5% | Oslo, Stavanger, Bergen, Kristiansand | Medium term (2-4 years) |
| Surge in AI and HPC Clusters Leveraging Norway’s Green Energy | +4.0% | Vestland and Telemark | Short term (≤ 2 years) |
| Data-Localization Demand for Oil-and-Gas Digital-Twin Workloads | +2.8% | Stavanger, Bergen, Trondheim | Medium term (2-4 years) |
| Source: Mordor Intelligence | |||
Abundant Renewable Hydro-Power Availability Lowers PUE
Norway’s 98% renewable electricity mix centers on more than 136 TWh of annual hydro output, enabling operators to post PUE levels roughly 10%-15% beneath continental averages.[1]Green Mountain, “About Green Mountain,” greenmountain.noLefdal Mine records a 1.15 PUE for 5 kW racks, trimming energy bills by nearly USD 0.02 per kWh relative to gas-backed grids.[2]Lefdal Mine, “Lefdal Mine Data Center – Tier III Certification and Sustainability,” lefdalmine.comThe cost delta compounds over a 20-year asset life, making the Norway data center market structurally attractive for hyperscalers. Norsk Hydro’s 48 MW pumped-storage project scheduled for 2030 will buffer frequency swings during peak AI training runs.[3]Norsk Hydro, “Saurdal Pumped Storage Project,” hydro.comWith the European Climate Neutral Data Centre Pact obligating 100% renewable sourcing by 2030, Norway offers an immediate compliance pathway.
Cool Nordic Climate Cuts Annual Cooling OPEX
Average ambient temperatures between 5°C and 8°C permit free-air cooling for 95% of yearly operating hours. Lefdal Mine’s seawater loop achieves zero water usage effectiveness, sidestepping scarcity issues seen in warmer EU markets. Stack Infrastructure reduces chiller runtime to under 200 hours yearly at its Oslo sites, lowering cooling capex by around 25%. Statutory heat-reuse requirements for facilities above 5 MW, effective from October 2025, convert waste heat into a revenue stream and strengthen total-cost-of-ownership economics.
Government Incentives and Pro-Digital Policies
The 2025 national data center strategy introduced mandatory facility registration above 1 MW, accelerated permitting for projects integrating district heating, and priority grid slots for heat-reuse commitments. Statnett’s discount on transmission tariffs for consumers exceeding 15 MW plus 100 GWh annually encourages developers to deploy capacity at scale. Restrictions on cryptocurrency mining free scarce headroom for AI workloads, while ISO 27001 and ISO 50001 compliance have become a prerequisite for public-sector cloud bids, favoring certified operators.
Surge in AI and HPC Clusters Leveraging Norway’s Green Energy
Google’s 240 MW campus in Skien, operating since 2026 after a EUR 600 million (USD 678 million) outlay, demonstrates how hyperscalers direct training workloads to zero-carbon jurisdictions. Equinor’s power-business launch in 2025 couples hydro baseload with dispatchable gas to guarantee 99.995% uptime for latency-sensitive inference tasks. The firm’s Fibra edge cluster already processes 5 GB per second from offshore sensors, illustrating the commercial upside of colocated compute.
Restraints Impact Analysis*
| Restraint | (~) % Impact on CAGR Forecast | Geographic Relevance | Impact Timeline |
|---|---|---|---|
| Escalating Construction Costs and Wage Inflation | -2.5% | Oslo and Stavanger metro areas | Short term (≤ 2 years) |
| Grid-Connection Delays and Capacity Constraints | -2.0% | Southern transmission corridors | Medium term (2-4 years) |
| Scarcity of Suitably Zoned Land Near Metro Areas | -1.5% | Urban fringes of Oslo, Bergen, Stavanger | Medium term (2-4 years) |
| Prospective EFTA Carbon Tax on Embodied Emissions | -1.2% | National | Long term (≥ 4 years) |
| Source: Mordor Intelligence | |||
Escalating Construction Costs and Wage Inflation
Statistics Norway’s Construction Cost Index rose 4.3% year-on-year to 155.1 in December 2025, as labor climbed 3.9% and materials rose 4.6%.[4]Statistics Norway, “Construction Cost Index December 2025,” ssb.noHVAC work, which mirrors data-center mechanical systems, posted a similar 4% increase. Norges Bank’s 4.5% policy rate keeps financing costs elevated, eroding returns for developers unable to lock long-term supply contracts. The inflation squeeze tilts the Norway data center market toward vertically integrated incumbents with procurement clout.
Grid-Connection Delays and Capacity Constraints
Statnett lists 7,700 MW of reserved load and 11,000 MW of pending requests, stretching interconnection queues beyond 2028 for non-priority projects. New high-voltage-line approvals average eight to ten years as environmental reviews and municipal consultations prolong timelines. Interconnector deratings during hot summers underscore vulnerability even within an otherwise resilient grid. The pricing model, which halves tariffs for loads over 15 MW, nudges operators toward single-campus hyperscale developments, intensifying regional bottlenecks.
*Our forecasts treat driver/restraint impacts as directional, not additive. The impact forecasts reflect baseline growth, mix effects, and variable interactions.
Segment Analysis
By Data Center Size: Hyperscale Momentum Reshapes Capacity Mix
Hyperscale facilities are forecast to grow at a 22.12% CAGR, outstripping the overall Norway data center market. Large sites between 5 MW and 10 MW held 36.14% of capacity in 2025, led by Green Mountain’s DC1-Stavanger, yet wholesale power agreements let hyperscalers bypass retail tariffs, reshaping competitive economics. Google’s 240 MW Skien build and Green Mountain’s NOK 50 billion (USD 4.8 billion) Kalberg project typify the pivot toward single-tenant campuses engineered for 30+ kW rack densities. Medium-sized enterprise facilities and compact edge nodes remain relevant for latency-sensitive workloads, although their combined share is likely to slip under 25% by 2031. The Norway data center market size for hyperscale campuses is therefore projected to dominate incremental capacity additions. Statnett’s tariff discount at the 15 MW threshold further tilts economics toward hyperscale parties, compressing margins for smaller colocation halls.
Growth in hyperscale build-outs will reinforce demand for on-site power-purchase agreements, joint-venture financing and integrated heat-reuse systems, capabilities more commonly found among large utilities and infrastructure funds. As a result, the Norway data center market share held by facilities above 20 MW is on track to exceed one-third before the end of the decade. Operators of sub-scale halls may pivot to specialized edge services such as real-time streaming, industrial IoT telemetry and regulated financial trading where low-latency urban footprints confer an advantage.


By Tier Type: Fault Tolerance Commands Premium Growth
Tier 3 facilities made up 74.15% of capacity in 2025, benefiting from concurrent-maintainability standards prized by enterprise and government buyers. Tier 4 sites, though fewer, are projected to expand at a 22.32% CAGR as oil-and-gas digital-twin simulations and algorithmic trading require zero-downtime assurance. Equinor’s Fibra cluster illustrates how mission-critical sensing workloads justify higher redundancy. The Norway data center market size attributed to Tier 4 builds is therefore scaling faster than the overall average.
Uptime Institute certification has emerged as a de-facto procurement filter, prompting owners of legacy Tier 2 halls to invest in dual utility feeds, N+1 cooling designs and rotary UPS systems. New entrants face steep capex barriers, especially as grid-interconnection delays can strand capital for several years. Over the forecast horizon, Tier 4’s growing footprint is expected to lift the average availability standard across the Norway data center market, nudging even mid-tier operators toward higher resiliency tiers.
By Data Center Type: Colocation Dominance Faces Hyperscale Disruption
Colocation accounted for 81.35% of capacity in 2025, but hyperscale and self-built estates are set to climb at a 22.56% CAGR. Retail colocation caters to sub-1 MW enterprise needs, while wholesale blocks of 5-20 MW attract cloud and content networks. The Norway data center industry, however, is witnessing direct land acquisition by hyperscalers, enabling them to design bespoke cooling and power architectures and bypass colocation mark-ups.
Green Mountain and Stack Infrastructure still offer hybrid models where hyperscalers lease white space yet assume control of mechanical and electrical systems, a trend likely to blur strict categorizations. As more cloud providers internalize capacity, the Norway data center market share of pure-play colocation operators may slide, even as absolute contracted megawatts continue to rise. Operators are responding by deepening services such as managed compliance, cross-connect ecosystems and heat-reuse partnerships to retain enterprise relevance.
By End User: Financial Services Outpace IT Incumbents
IT and ITES workloads dominated at 45.74% of capacity in 2025, driven by software-as-a-service vendors and managed-hosting firms. From 2026-2031, banking, financial services and insurance (BFSI) demand is projected to accelerate at 23.16% annually as Nordic banks adopt real-time payments and fraud-detection models. The Norway data center market size linked to BFSI is therefore expanding faster than any other vertical.
DNB’s hybrid-cloud migration showcases how regulated entities leverage colocation halls in Oslo for data residency while shifting less-sensitive workloads to public cloud. Compliance with the EU Digital Operational Resilience Act is nudging more financial firms toward certified Tier 3 or Tier 4 halls. Manufacturing, telecom and media workloads continue to contribute, but slower growth reflects the offloading of static content to distributed caches and the maturation of 5G edge architectures outside the data-center core.
Geography Analysis
Oslo retained 38.92% of capacity in 2025 owing to dense fiber interconnects and proximity to government and finance. Yet land scarcity and grid queues threaten future expansion. Vestland, backed by ready-zoned industrial plots and abundant hydro resources, is projected to log a 22.78% CAGR, outstripping the capital. The Norway data center market size in Vestland stands to benefit from Green Mountain’s Kalberg campus and Google’s Skien facility.
Northern counties such as Trøndelag and Nordland remain niche, hosting energy-intensive blockchain mining and specialized HPC, but transmission prioritization toward the south limits near-term scaling. Over the forecast period, diversification toward western hydro corridors will rebalance national capacity, though Oslo will stay indispensable for latency-critical workloads requiring sub-5 ms round-trip times to Scandinavian exchanges.
Rapid submarine-cable investments are tightening Vestland’s latency to continental exchanges, trimming round-trip times to Frankfurt to under 19 ms and making the corridor viable for real-time capital-markets traffic. Municipal utilities in Stavanger and Bergen now bundle district-heating offtake agreements with land leases, turning mandatory heat-reuse rules from a compliance cost into an ancillary-revenue opportunity that can lift project IRR by 80-100 basis points. A forthcoming 40 MW shore-to-ship power project at the Port of Bergen will anchor an adjacent micro-data-center cluster, illustrating how maritime electrification is spawning new edge nodes outside traditional metro cores. Meanwhile, Oslo’s airport-area land bank is nearing full allocation, forcing developers into multi-story designs that raise capex per megawatt by 12-15% compared with single-level Vestland halls. Collectively, these dynamics suggest that Vestland’s share of the Norway data center market could top 30% by 2031 even without materially faster build-outs than currently planned.
Competitive Landscape
The Norway data center market features moderate concentration. Green Mountain and Stack Infrastructure jointly accounted for roughly 60% of operational megawatts in 2025, leveraging deep municipal relationships and multi-certified facilities. Green Mountain’s vertically integrated model, spanning site acquisition to mechanical design, allows PUE levels below 1.25 and long-term hydro power deals that smaller rivals struggle to match. Stack Infrastructure’s DigiPlex portfolio anchors the Oslo colocation ecosystem but faces pricing pressure as cloud providers commission self-built campuses.
Bulk Infrastructure, backed by BGO’s USD 1 billion commitment, is positioning to capture the hyperscale tier through wholesale power agreements and 100 GWh tariff discounts. Telenor’s USD 9.6 million stake in Skygard signals telecom carriers’ intent to hedge slowing consumer-connectivity revenues by moving up the cloud stack. Energy major Equinor is leveraging dispatchable gas assets to guarantee near-perfect uptime for AI inference, underscoring convergence between the power and compute sectors.
Uptime Institute Tier certification, statutory heat-reuse obligations and a forthcoming embodied-carbon tax raise the regulatory bar, advantaging incumbents with on-staff engineering and ESG reporting infrastructure. For new entrants, joint ventures with utilities or real-estate funds are becoming the de-facto route to market, given high capex, queue-bound grid interconnections and heightened labor-cost inflation.
Norway Data Center Industry Leaders
Green Mountain AS
Bitdeer Technologies Group
Bulk Infrastructure Group AS
Microsoft Corporation
Stack Infrastructure, Inc.
- *Disclaimer: Major Players sorted in no particular order

Recent Industry Developments
- January 2026: Green Mountain commenced phase-one commissioning of its OSL2-Hamar campus, Norway’s largest data-center project under construction, aimed at hyperscalers that require sub-1.25 PUE and multi-megawatt blocks.
- October 2025: The government published the national data center strategy mandating site registration above 1 MW, compulsory heat reuse for halls over 5 MW and restrictions on cryptocurrency mining to preserve grid capacity for AI workloads.
- July 2025: Telenor announced a NOK 100 million (USD 9.6 million) investment in Skygard’s sovereign-cloud platform to serve public-sector and BFSI clients.
- April 2025: Equinor created a dedicated power unit to supply AI and data-center demand through blended hydro and gas portfolios guaranteeing 99.995% uptime.


Norway Data Center Market Report Scope
The data center market encompasses the infrastructure, services, and technologies that support the storage, management, and processing of data. This market includes various data center sizes, tier classifications, types, end-user industries, and hotspots, reflecting the diverse needs of businesses and organizations operating in the country.
The Norway Data Center Market Report is Segmented by Data Center Size (Small, Medium, Large, and Hyperscale), Tier Type (Tier 1 and 2, Tier 3, and Tier 4), Data Center Type (Hyperscale/Self-Built, Enterprise/Edge, and Colocation), End User (BFSI, IT and ITES, E-Commerce, Government, Manufacturing, Media and Entertainment, Telecom, and Other End Users), and Hotspot (Oslo, Vestland, and Rest of Norway). The Market Forecasts are Provided in Terms of IT Load Capacity (Megawatt).
| Small |
| Medium |
| Large |
| Hyperscale |
| Tier 1 and 2 |
| Tier 3 |
| Tier 4 |
| Hyperscale / Self-Built | ||
| Enterprise / Edge | ||
| Colocation | Non-Utilized | |
| Utilized | Retail Colocation | |
| Wholesale Colocation | ||
| BFSI |
| IT and ITES |
| E-Commerce |
| Government |
| Manufacturing |
| Media and Entertainment |
| Telecom |
| Other End Users |
| Oslo |
| Vestland |
| Rest of Norway |
| By Data Center Size | Small | ||
| Medium | |||
| Large | |||
| Hyperscale | |||
| By Tier Type | Tier 1 and 2 | ||
| Tier 3 | |||
| Tier 4 | |||
| By Data Center Type | Hyperscale / Self-Built | ||
| Enterprise / Edge | |||
| Colocation | Non-Utilized | ||
| Utilized | Retail Colocation | ||
| Wholesale Colocation | |||
| By End User | BFSI | ||
| IT and ITES | |||
| E-Commerce | |||
| Government | |||
| Manufacturing | |||
| Media and Entertainment | |||
| Telecom | |||
| Other End Users | |||
| By Hotspot | Oslo | ||
| Vestland | |||
| Rest of Norway | |||


Market Definition
- IT LOAD CAPACITY - The IT load capacity or installed capacity, refers to the amount of energy consumed by servers and network equipments placed in a rack installed. It is measured in megawatt (MW).
- ABSORPTION RATE - It denotes the extend to which the data center capacity has been leased out. For instance, a 100 MW DC has leased out 75 MW, then absorption rate would be 75%. It is also referred as utilization rate and leased-out capacity.
- RAISED FLOOR SPACE - It is an elevated space build over the floor. This gap between the original floor and the elevated floor is used to accommodate wiring, cooling, and other data center equipment. This arrangement assist in having proper wiring and cooling infrastructure. It is measured in square feet (ft^2).
- DATA CENTER SIZE - Data Center Size is segmented based on the raised floor space allocated to the data center facilities. Mega DC - # of Racks must be more than 9000 or RFS (raised floor space) must be more than 225001 Sq. ft; Massive DC - # of Racks must be in between 9000 and 3001 or RFS must be in between 225000 Sq. ft and 75001 Sq. ft; Large DC - # of Racks must be in between 3000 and 801 or RFS must be in between 75000 Sq. ft and 20001 Sq. ft; Medium DC # of Racks must be in between 800 and 201 or RFS must be in between 20000 Sq. ft and 5001 Sq. ft; Small DC - # of Racks must be less than 200 or RFS must be less than 5000 Sq. ft.
- TIER TYPE - According to Uptime Institute the data centers are classified into four tiers based on the proficiencies of redundant equipment of the data center infrastructure. In this segment the data center are segmented as Tier 1,Tier 2, Tier 3 and Tier 4.
- COLOCATION TYPE - The segment is segregated into 3 categories namely Retail, Wholesale and Hyperscale Colocation service. The categorization is done based on the amount of IT load leased out to potential customers. Retail colocation service has leased capacity less than 250 kW; Wholesale colocation services has leased capacity between 251 kW and 4 MW and Hyperscale colocation services has leased capacity more than 4 MW.
- END CONSUMERS - The Data Center Market operates on a B2B basis. BFSI, Government, Cloud Operators, Media and Entertainment, E-Commerce, Telecom and Manufacturing are the major end-consumers in the market studied. The scope only includes colocation service operators catering to the increasing digitalization of the end-user industries.
| Keyword | Definition |
|---|---|
| Rack Unit | Generally referred as U or RU, it is the unit of measurement for the server unit housed in the racks in the data center. 1U is equal to 1.75 inches. |
| Rack Density | It defines the amount of power consumed by the equipment and server housed in a rack. It is measured in kilowatt (kW). This factor plays a critical role in data center design and, cooling and power planning. |
| IT Load Capacity | The IT load capacity or installed capacity, refers to the amount of energy consumed by servers and network equipment placed in a rack installed. It is measured in megawatt (MW). |
| Absorption Rate | It denotes how much of the data center capacity has been leased out. For instance, if a 100 MW DC has leased out 75 MW, then the absorption rate would be 75%. It is also referred to as utilization rate and leased-out capacity. |
| Raised Floor Space | It is an elevated space built over the floor. This gap between the original floor and the elevated floor is used to accommodate wiring, cooling, and other data center equipment. This arrangement assists in having proper wiring and cooling infrastructure. It is measured in square feet/meter. |
| Computer Room Air Conditioner (CRAC) | It is a device used to monitor and maintain the temperature, air circulation, and humidity inside the server room in the data center. |
| Aisle | It is the open space between the rows of racks. This open space is critical for maintaining the optimal temperature (20-25 °C) in the server room. There are primarily two aisles inside the server room, a hot aisle and a cold aisle. |
| Cold Aisle | It is the aisle wherein the front of the rack faces the aisle. Here, chilled air is directed into the aisle so that it can enter the front of the racks and maintain the temperature. |
| Hot Aisle | It is the aisle where the back of the racks faces the aisle. Here, the heat dissipated from the equipment’s in the rack is directed to the outlet vent of the CRAC. |
| Critical Load | It includes the servers and other computer equipment whose uptime is critical for data center operation. |
| Power Usage Effectiveness (PUE) | It is a metric which defines the efficiency of a data center. It is calculated by: (𝑇𝑜𝑡𝑎𝑙 𝐷𝑎𝑡𝑎 𝐶𝑒𝑛𝑡𝑒𝑟 𝐸𝑛𝑒𝑟𝑔𝑦 𝐶𝑜𝑛𝑠𝑢𝑚𝑝𝑡𝑖𝑜𝑛)/(𝑇𝑜𝑡𝑎𝑙 𝐼𝑇 𝐸𝑞𝑢𝑖𝑝𝑚𝑒𝑛𝑡 𝐸𝑛𝑒𝑟𝑔𝑦 𝐶𝑜𝑛𝑠𝑢𝑚𝑝𝑡𝑖𝑜𝑛). Further, a data center with a PUE of 1.2-1.5 is considered highly efficient, whereas, a data center with a PUE >2 is considered highly inefficient. |
| Redundancy | It is defined as a system design wherein additional component (UPS, generators, CRAC) is added so that in case of power outage, equipment failure, the IT equipment should not be affected. |
| Uninterruptible Power Supply (UPS) | It is a device that is connected in series with the utility power supply, storing energy in batteries such that the supply from UPS is continuous to IT equipment even during utility power is snapped. The UPS primarily supports the IT equipment only. |
| Generators | Just like UPS, generators are placed in the data center to ensure an uninterrupted power supply, avoiding downtime. Data center facilities have diesel generators and commonly, 48-hour diesel is stored in the facility to prevent disruption. |
| N | It denotes the tools and equipment required for a data center to function at full load. Only "N" indicates that there is no backup to the equipment in the event of any failure. |
| N+1 | Referred to as 'Need plus one', it denotes the additional equipment setup available to avoid downtime in case of failure. A data center is considered N+1 when there is one additional unit for every 4 components. For instance, if a data center has 4 UPS systems, then for to achieve N+1, an additional UPS system would be required. |
| 2N | It refers to fully redundant design wherein two independent power distribution system is deployed. Therefore, in the event of a complete failure of one distribution system, the other system will still supply power to the data center. |
| In-Row Cooling | It is the cooling design system installed between racks in a row where it draws warm air from the hot aisle and supplies cool air to the cold aisle, thereby maintaining the temperature. |
| Tier 1 | Tier classification determines the preparedness of a data center facility to sustain data center operation. A data center is classified as Tier 1 data center when it has a non-redundant (N) power component (UPS, generators), cooling components, and power distribution system (from utility power grids). The Tier 1 data center has an uptime of 99.67% and an annual downtime of <28.8 hours. |
| Tier 2 | A data center is classified as Tier 2 data center when it has a redundant power and cooling components (N+1) and a single non-redundant distribution system. Redundant components include extra generators, UPS, chillers, heat rejection equipment, and fuel tanks. The Tier 2 data center has an uptime of 99.74% and an annual downtime of <22 hours. |
| Tier 3 | A data center having redundant power and cooling components and multiple power distribution systems is referred to as a Tier 3 data center. The facility is resistant to planned (facility maintenance) and unplanned (power outage, cooling failure) disruption. The Tier 3 data center has an uptime of 99.98% and an annual downtime of <1.6 hours. |
| Tier 4 | It is the most tolerant type of data center. A Tier 4 data center has multiple, independent redundant power and cooling components and multiple power distribution paths. All IT equipment are dual powered, making them fault tolerant in case of any disruption, thereby ensuring interrupted operation. The Tier 4 data center has an uptime of 99.74% and an annual downtime of <26.3 minutes. |
| Small Data Center | Data center that has floor space area of ≤ 5,000 Sq. ft or the number of racks that can be installed is ≤ 200 is classified as a small data center. |
| Medium Data Center | Data center which has floor space area between 5,001-20,000 Sq. ft, or the number of racks that can be installed is between 201-800, is classified as a medium data center. |
| Large Data Center | Data center which has floor space area between 20,001-75,000 Sq. ft, or the number of racks that can be installed is between 801-3,000, is classified as a large data center. |
| Massive Data Center | Data center which has floor space area between 75,001-225,000 Sq. ft, or the number of racks that can be installed is between 3001-9,000, is classified as a massive data center. |
| Mega Data Center | Data center that has a floor space area of ≥ 225,001 Sq. ft or the number of racks that can be installed is ≥ 9001 is classified as a mega data center. |
| Retail Colocation | It refers to those customers who have a capacity requirement of 250 kW or less. These services are majorly opted by small and medium enterprises (SMEs). |
| Wholesale Colocation | It refers to those customers who have a capacity requirement between 250 kW to 4 MW. These services are majorly opted by medium to large enterprises. |
| Hyperscale Colocation | It refers to those customers who have a capacity requirement greater than 4 MW. The hyperscale demand primarily originates from large-scale cloud players, IT companies, BFSI, and OTT players (like Netflix, Hulu, and HBO+). |
| Mobile Data Speed | It is the mobile internet speed a user experiences via their smartphones. This speed is primarily dependent on the carrier technology being used in the smartphone. The carrier technologies available in the market are 2G, 3G, 4G, and 5G, where 2G provides the slowest speed while 5G is the fastest. |
| Fiber Connectivity Network | It is a network of optical fiber cables deployed across the country, connecting rural and urban regions with high-speed internet connection. It is measured in kilometer (km). |
| Data Traffic per Smartphone | It is a measure of average data consumption by a smartphone user in a month. It is measured in gigabyte (GB). |
| Broadband Data Speed | It is the internet speed that is supplied over the fixed cable connection. Commonly, copper cable and optic fiber cable are used in both residential and commercial use. Here, optic cable fiber provides faster internet speed than copper cable. |
| Submarine Cable | A submarine cable is a fiber optic cable laid down at two or more landing points. Through this cable, communication and internet connectivity between countries across the globe is established. These cables can transmit 100-200 terabits per second (Tbps) from one point to another. |
| Carbon Footprint | It is the measure of carbon dioxide generated during the regular operation of a data center. Since, coal, and oil & gas are the primary source of power generation, consumption of this power contributes to carbon emissions. Data center operators are incorporating renewable energy sources to curb the carbon footprint emerging in their facilities. |


Research Methodology
Mordor Intelligence follows a four-step methodology in all our reports.
- Step-1: Identify Key Variables: In order to build a robust forecasting methodology, the variables and factors identified in Step-1 are tested against available historical market numbers. Through an iterative process, the variables required for market forecast are set and the model is built on the basis of these variables.
- Step-2: Build a Market Model: Market-size estimations for the forecast years are in nominal terms. Inflation is not a part of the pricing, and the average selling price (ASP) is kept constant throughout the forecast period for each country.
- Step-3: Validate and Finalize: In this important step, all market numbers, variables and analyst calls are validated through an extensive network of primary research experts from the market studied. The respondents are selected across levels and functions to generate a holistic picture of the market studied.
- Step-4: Research Outputs: Syndicated Reports, Custom Consulting Assignments, Databases & Subscription Platforms


