North America Sugar Confectionery Market Size and Share
Market Overview
| Study Period | 2021 - 2031 |
|---|---|
| Forecast Data Period | 2026 - 2031 |
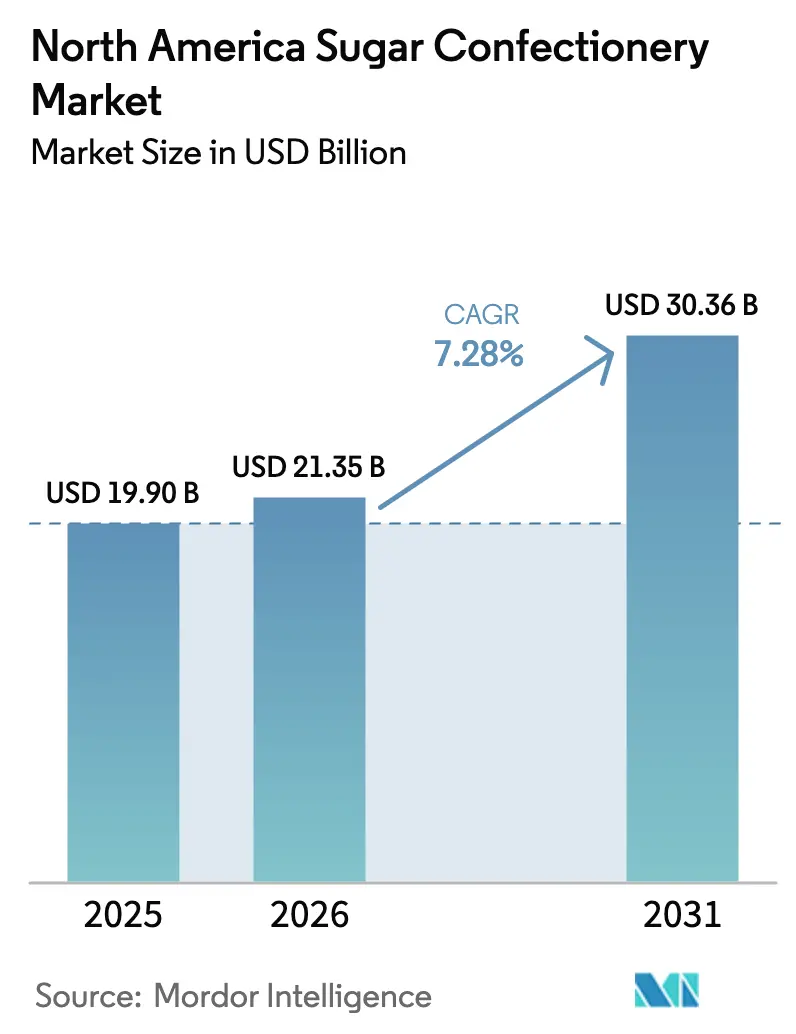
| Base Year Market Size (2025) | USD 19.90 Billion |
| Market Size (2026) | USD 21.35 Billion |
| Market Size (2031) | USD 30.36 Billion |
| Growth Rate (2026 - 2031) | 7.28% CAGR |
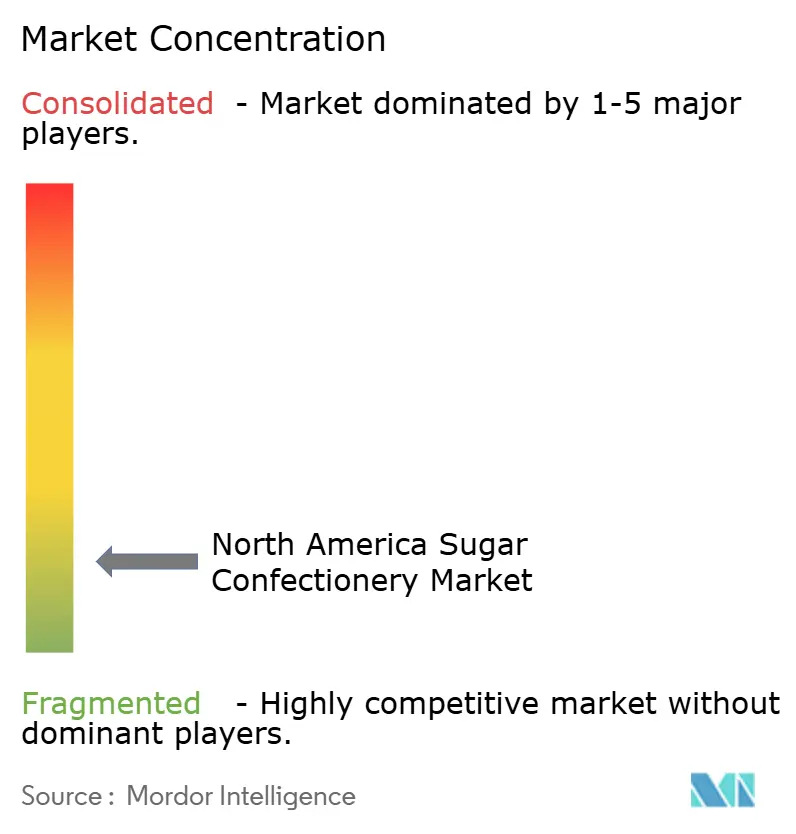
| Market Concentration | Low |
Major Players
*Disclaimer: Major Players sorted in no particular order Image © Mordor Intelligence. Reuse requires attribution under CC BY 4.0. |
|
North America Sugar Confectionery Market Analysis by Mordor Intelligence
The North American sugar confectionery market size is expected to grow from USD 19.90 billion in 2025 to USD 21.35 billion in 2026 and is forecast to reach USD 30.36 billion by 2031 at 7.28% CAGR over 2026-2031. Rising health concerns about added sugars are driving demand for premium products, pushing manufacturers to reformulate recipes, offer portion-control packs, and expand indulgent product lines. Gummies and jellies lead the market, supported by new flavors, freeze-dried textures, and capacity expansions like HARIBO’s Wisconsin plant. Lollipops, though smaller, are growing fastest due to nostalgic branding and functional ingredients. Packaging is shifting from single-serve to multipacks, catering to e-commerce and club store trends. While mass-tier products dominate, premium and artisanal lines are growing rapidly, driven by clean-label recipes, transparent sourcing, and giftable packaging.
Key Report Takeaways
- By product type, pastilles, gummies, and jellies led with 35.62% of North America sugar confectionery market share in 2025, while lollipops posted the highest forecast CAGR at 7.95% through 2031.
- By packaging type, single-serve formats captured 63.55% share of the North America sugar confectionery market size in 2025; multipacks are on track to expand at a 7.32% CAGR to 2031.
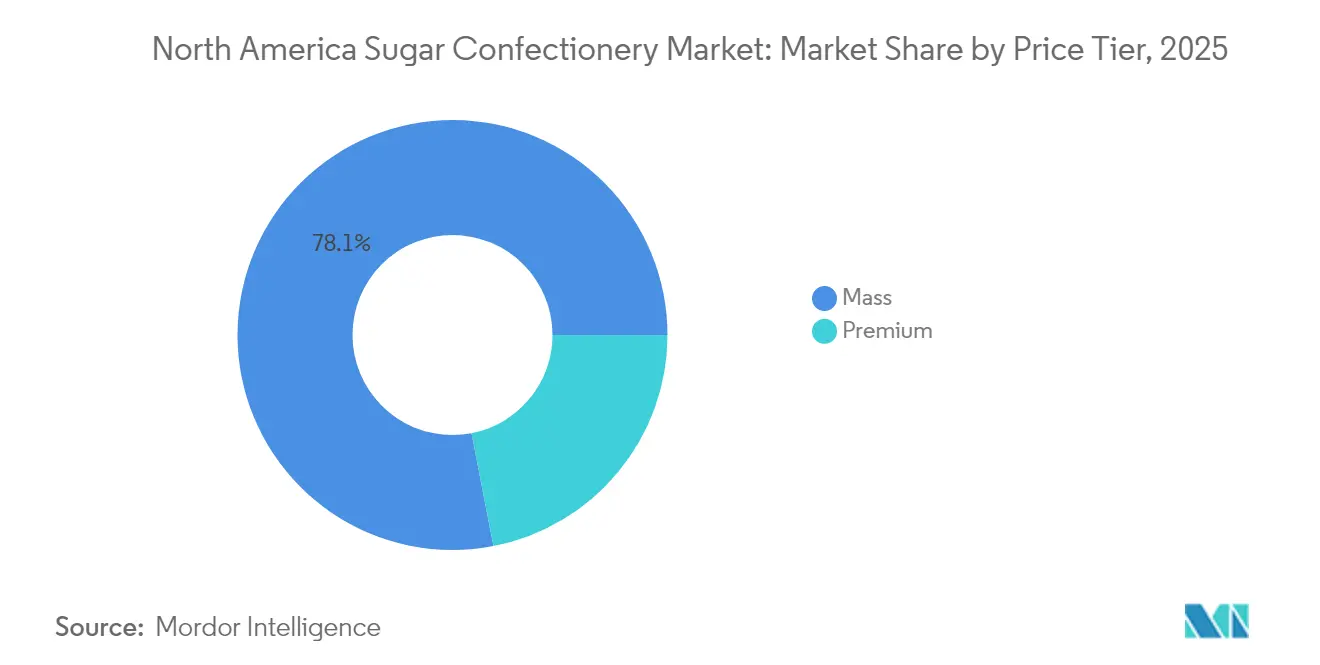
- By price tier, the mass segment accounted for 78.05% of 2025 sales, whereas premium confectionery is advancing at a 7.64% CAGR through 2031, outpacing the overall market.
- By distribution channel, supermarkets and hypermarkets held 44.88% share in 2025, yet online retail is the fastest-growing channel with a 8.62% CAGR forecast to 2031.
Note: Market size and forecast figures in this report are generated using Mordor Intelligence’s proprietary estimation framework, updated with the latest available data and insights as of 2026.
North America Sugar Confectionery Market Trends and Insights
Drivers Impact Analysis*
| Drivers | (~) % Impact on CAGR Forecast | Geographic Relevance | Impact Timeline |
|---|---|---|---|
| Innovative Product Launches and Limited-Edition Offerings Attract Consumer Attention | +1.2% | United States, Canada, with spill-over to Mexico | Short term (≤ 2 years) |
| Aggressive Marketing and Promotional Campaigns by Major Brands Influences Buying Behavior | +0.8% | North America-wide, concentrated in US metro areas | Short term (≤ 2 years) |
| Premiumization and Artisanal Positioning | +1.0% | United States, Canada urban centers | Medium term (2-4 years) |
| Omnichannel Growth via E-Commerce, D2C Drops, and Retailer Marketplaces | +1.5% | United States, Canada, emerging in Mexico | Medium term (2-4 years) |
| Social Media and Influencer-Led Discovery Accelerating Viral Trials for Novel Flavors and Seasonal Items | +0.9% | United States, Canada, youth-skewed demographics | Short term (≤ 2 years) |
| Clean Label and Transparency Increase Trust and Brand Switching in Family and School-Lunch Occasions | +0.7% | United States, Canada | Long term (≥ 4 years) |
| Source: Mordor Intelligence | |||


Innovative Product Launches and Limited-Edition Offerings Attract Consumer Attention
In 2024, Mars introduced several new products, including M&M's Peanut Butter & Jelly, a freeze-dried version of Skittles called Skittles Pop'd, and multiple Snickers variants, showcasing its focus on rapid product innovation. Hershey also launched Kit Kat Duos and Reese's Caramel Big Cup, aiming to attract consumers with unique offerings and encourage product trials. Limited-edition releases, often tied to seasonal events or cultural trends, have proven highly successful, achieving sell-through rates 25-35% higher than regular products. This success has pushed brands to adopt a continuous innovation cycle rather than sticking to annual product updates. Ferrero's 2024 launch of Tic Tac Chewy highlights a shift in strategy, expanding beyond traditional hard mints to appeal to younger consumers who prefer chewable textures over compressed tablets. Additionally, freeze-dried candy, a trend fueled by TikTok under the #candy hashtag, has transitioned from niche confectioners to mainstream brands. Mars capitalized on this trend with the introduction of Skittles Pop'd, further solidifying its position in the market. Retailers are adapting to these changes by dedicating 10-15% of their confectionery shelf space to innovation zones. These zones feature rotating products every 8-12 weeks, ensuring a steady stream of new offerings to maintain consumer interest and prevent product fatigue.
Premiumization and Artisanal Positioning
Between 2024 and 2030, the premium-tier confectionery market is expected to grow at a CAGR of 7.89%, outpacing the mass segment's growth rate of 7.37%. This growth reflects a shift in consumer preferences, with many willing to pay 20-40% more for premium confectionery that offers indulgent experiences compared to traditional candy. Artisanal brands like Taza Chocolate, Theo Chocolate, and Dandelion Chocolate have gained popularity by focusing on single-origin ingredients, transparent supply chains, and simple, high-quality recipes. These attributes appeal strongly to affluent millennials and Gen Z consumers. Major players like Mars are also incorporating premium features into their mass-market products. For example, Mars plans to launch its M&M's Bakery Collection and Honey Roasted Peanut variant in 2026, targeting consumers who prefer familiar brands with upgraded flavor options. Clean-label products further enhance the perception of premium quality. Around 40% of North American consumers are willing to pay extra for eco-friendly packaging, and brands that clearly disclose ingredient origins on their packaging see 12-18% higher repeat purchase rates compared to competitors with less transparency[1]National Confectioners Association. "Candy USA - Industry Data and Insights.", candyusa.com..
Omnichannel Growth via E-Commerce, D2C Drops, and Retailer Marketplaces
Online retail is growing rapidly, with a strong 9.03% CAGR projected through 2030, making it the fastest-growing distribution channel. Platforms like Amazon's "Subscribe & Save," Walmart.com, and brand-specific direct-to-consumer (D2C) websites are breaking down geographic limitations and enabling highly targeted promotions. On Amazon, Black Forest Gummy Bears consistently rank as the top-selling gummy candy. At the same time, HARIBO and Trolli dominate bulk-format searches, highlighting the preference for larger pack sizes in e-commerce, which helps reduce shipping costs. In 2024, HI-CHEW launched its D2C platform, featuring a "Find Your Flavor" quiz that customizes product assortments for consumers. This initiative not only enhances personalization but also collects valuable first-party data to improve future product development. Similarly, Mondelez shifted Oreo's D2C operations to Shopify in 2024. Instead of focusing on high sales volumes, Mondelez uses the channel to test limited-edition products and gather consumer insights, which help shape broader retail strategies. Retailers are also adopting marketplace models to expand their offerings. For example, Walmart.com now allows third-party candy sellers on its platform.
Social Media and Influencer-Led Discovery Accelerating Viral Trials for Novel Flavors and Seasonal Items
TikTok has become the go-to platform for discovering confectionery innovations. Posts tagged with #candy on TikTok are driving demand spikes, outpacing traditional advertising by 3-5 times in speed. In February 2024, Walgreens' Nice! Gummy Mango saw a staggering 7-fold sales increase after a TikTok post went viral. This surge was so significant that Walgreens had to impose purchase limits and hasten their restocking efforts. Brands are now favoring partnerships with micro-influencers over traditional celebrity endorsements. These micro-influencers boast engagement rates of 5-8%, a stark contrast to the sub-1% rates of their macro counterparts. This shift allows brands to more effectively target niche flavor preferences and dietary segments, all while keeping costs down. Content featuring freeze-dried candies is leading TikTok's confectionery scene. Creators are highlighting how these candies' textures amplify crunch and deepen flavor. Recognizing the trend, Mars has introduced Skittles Pop'd, ensuring they don't lose ground to independent producers. Both Instagram's shoppable posts and TikTok Shop are streamlining the journey from awareness to purchase. Brands that integrate buy buttons within influencer content see conversion rates 18-25% higher than those that depend on profile-link redirects. Seasonal events like Halloween, Valentine's Day, and Easter account for 62-64% of annual confectionery sales. Social media plays a pivotal role in amplifying these sales peaks, using countdown campaigns and messages about limited availability to create urgency.
Restraint Impact Analysis*
| Restraint | (~) % Impact on CAGR Forecast | Geographic Relevance | Impact Timeline |
|---|---|---|---|
| Raising Health Concerns Over Sugar Consumption | -1.3% | United States, Canada, with regulatory momentum | Long term (≥ 4 years) |
| Increasing Competition From Healthier Alternatives | -1.1% | United States, Canada urban markets | Medium term (2-4 years) |
| Private-Label Competition and Price Pressure | -0.8% | North America-wide, concentrated in value-focused retail | Medium term (2-4 years) |
| Environmental Concerns and Packaging Waste Issues Pushing for Sustainable Alternatives, Raising Costs | -0.5% | United States, Canada, emerging in Mexico | Long term (≥ 4 years) |
| Source: Mordor Intelligence | |||
Raising Health Concerns Over Sugar Consumption
Regulatory frameworks are becoming stricter regarding sugar disclosures and consumption limits. The FDA has introduced a rule, effective January 2025, requiring high-sugar products to display warning icons by 2027[2]U.S. Food and Drug Administration. "Front of Package Labeling.", fda.gov. Similarly, Health Canada is working to align sugar-free claims with WHO standards. These measures aim to reduce added-sugar intake to less than 10% of daily calories. However, compliance with these regulations is costly, with reformulation expenses per SKU estimated between USD 50,000 and USD 200,000. These costs include ingredient testing, sensory validation, and packaging redesign. Although most North American consumers express a preference for reduced-sugar confectionery, only 10% consistently purchase such products. This gap between consumer intent and actual buying behavior makes it challenging for sugar-free products to achieve commercial success. To address this, brands are introducing "better-for-you" sub-brands. For example, SmartSweets offers stevia-sweetened gummies that are priced 30-50% higher to compensate for lower sales volumes. This approach effectively segments the market into two categories: indulgence and wellness.
Increasing Competition From Healthier Alternatives
Protein bars, fruit snacks, and functional gummies are increasingly appealing to Gen Z and millennial consumers, who value nutrient density and ingredient transparency, thus taking market share from traditional sugar confectioneries. SmartSweets, a brand valued at USD 125 million, is present in around 50,000 stores across North America. It markets its gummies as "candy without compromise," offering just 3 grams of sugar compared to the 25-30 grams found in traditional counterparts, all while ensuring a chewy texture through the use of soluble fiber blends. In March 2024, Ferrero made headlines with its USD 1.3 billion acquisition of Kellogg's fruit snack portfolio. This move highlights the industry's acknowledgment that adjacent categories pose a threat to core confectionery volumes. The acquisition brought Stretch Island fruit strips and other health-oriented formats into Ferrero's distribution fold. While non-chocolate confectionery saw growth in 2023, this growth was tempered by declines in hard candy and mints. Consumers are increasingly gravitating towards gummy vitamins and collagen-infused chews, products that straddle the line between supplements and treats. In 2024, sales of private-label sugar-free chocolates witnessed a notable surge, suggesting that retailers are strategically using their own-brand formulations to attract health-conscious consumers, offering them at discounts of 20-30% compared to national brands.
*Our forecasts treat driver/restraint impacts as directional, not additive. The impact forecasts reflect baseline growth, mix effects, and variable interactions.
Segment Analysis
By Product Type: Gummies Dominate, Lollipops Surge
In 2025, pastilles, gummies, and jellies accounted for 35.62% of the total revenue, making them the leading product type. Their popularity is driven by advancements in texture, a wide variety of flavors, and viral trends on social media platforms like Instagram and TikTok, which highlight gummy formats as visually appealing and shareable content. HARIBO addressed supply challenges by opening a USD 300 million production facility in Pleasant Prairie, Wisconsin, in 2023. This facility, which will scale up production through 2025, allows the company to use "Made in USA" labeling, appealing to domestic retailers focused on local sourcing. Black Forest Gummy Bears consistently rank as Amazon's best-selling gummy product, showcasing the growing preference for bulk packaging and subscription models that encourage repeat purchases. In 2024, Trolli launched its Sour Brite Squad, incorporating functional ingredients such as vitamin C and electrolytes into sour gummy formulations. This product targets active consumers who want a balance of indulgence and minor nutritional benefits.
Lollipops are projected to grow at a CAGR of 7.95% through 2031, the fastest growth rate among all product types. This growth is fueled by nostalgic limited-edition offerings, the addition of functional ingredients, and premium positioning that increases average transaction values. In 2024, Ferrero acquired Ricolino for USD 1.3 billion, integrating Tutsi Pop, a leading Mexican lollipop brand, into its North American portfolio. This acquisition enables cross-border distribution and introduces innovative flavor combinations, such as tamarind, chili, and mango, into mainstream product lines. Chupa Chups, owned by Perfetti Van Melle, maintains its market relevance by frequently rotating limited-edition flavors every 8-12 weeks and collaborating with entertainment franchises. These licensed products command a 15-25% price premium compared to standard offerings. Lollipops' portability and portion control appeal to health-conscious parents looking for lower-calorie treats for their children. Additionally, premium variants infused with ingredients like collagen or vitamin D attract adult consumers, who are willing to pay USD 3-5 per unit, compared to the USD 0.50-1.00 price range for traditional lollipops.


By Packaging Type: Single-Serve Leads, Multipacks Gain
In 2025, single-serve packaging accounted for 63.55% of the total revenue, making it the most dominant format in the confectionery market. This popularity is driven by impulse purchases at checkout lanes, convenience stores, and vending machines, where consumers prioritize quick access over cost savings. Convenience stores, which contribute around 20% of confectionery distribution, prefer single-serve products priced between USD 1-2. These products not only ensure faster turnover per shelf space but also require minimal inventory management. Examples include Mars' M&M's single-serve tubes and Hershey's king-size Reese's Cups, both designed for portability, fitting easily into cup holders and backpack pockets. The dominance of single-serve packaging reflects North America's car-dependent lifestyle and snacking habits that value convenience over cost efficiency. However, this format generates 30-40% more packaging waste per gram of candy compared to multipacks, raising environmental concerns as stricter regulations on single-use plastics are introduced by municipalities.
Multipacks are growing at a compound annual growth rate (CAGR) of 7.32% through 2031, outpacing the growth of single-serve formats. Retailers are focusing on increasing basket sizes, while subscription-box models are gaining traction in direct-to-consumer channels. For example, Amazon's Subscribe & Save program offers discounts of 5-15% on recurring candy shipments, favoring multipacks that lower per-unit shipping costs and encourage consumers to stock up. Target's Up&Up private-label line is also adapting to this trend by reformulating 40% of its confectionery products and emphasizing family-sized multipacks. These multipacks, priced 20-30% lower than national-brand alternatives, appeal to cost-conscious households that prioritize value over brand loyalty. Wholesale retailers like Costco and Sam's Club are further driving multipack adoption by positioning bulk candy as a staple category alongside groceries. Their offerings, such as 2-5 pound bags priced between USD 15-30, help increase average transaction values.
By Price Tier: Mass Scale, Premium Accelerates
In 2025, mass-tier confectionery products accounted for 78.05% of total revenue, highlighting their role as affordable treats accessible to a wide range of income groups. Leading companies like Mars, Hershey, and Ferrero dominate the North American market by offering popular brands such as M&M's, Reese's, and Skittles. These products, priced between USD 1-3 per unit, are designed to encourage impulse purchases and repeat buying. Private-label chocolate in the mass tier also saw significant growth in 2024, pushing national brands to defend their market share through increased promotional spending and faster innovation. Retailers like Walmart and Target have expanded their private-label confectionery lines—'Nice!' and 'Up&Up'—by 25-30% in SKU count since 2023. These private-label products are priced 20-30% lower than branded alternatives, attracting price-conscious consumers who prioritize value over brand loyalty.
The premium-tier confectionery market is expected to grow at a compound annual growth rate (CAGR) of 7.64% from 2025 to 2031, outpacing the overall market growth of 7.28%. This growth reflects a shift in consumer preferences, as more people are willing to pay 20-40% higher prices for premium indulgent experiences. A survey conducted by Ferrero in September 2025 revealed that 76% of respondents preferred full-sized chocolate bars, and 72% leaned toward premium chocolate, showing that special occasions increasingly influence purchasing decisions. Artisanal brands like Taza Chocolate, Theo Chocolate, and Dandelion Chocolate have carved out a niche by focusing on single-origin ingredients, transparent supply chains, and simple recipes. These features appeal to affluent millennials and Gen Z consumers, who are willing to spend USD 8-12 per bar. In late 2023, AMC Theatres introduced its 'Cinema Sweets' premium private-label candy line. Priced 30-50% higher than mass-tier products, this line targets theater audiences with gourmet gummies and artisanal chocolates, encouraging trial and repeat purchases.
By Distribution Channel: Supermarkets Lead, Online Surges
In 2025, supermarkets and hypermarkets accounted for 44.88% of the distribution channel share, making them the largest contributors. This dominance is driven by features like dedicated confectionery aisles, seasonal displays, and checkout-lane impulse zones, which collectively generate 30-40% of category sales. Retail giants Walmart and Kroger dominate North American confectionery sales by utilizing their scale to secure promotional allowances and exclusive product offerings, setting themselves apart from convenience stores and drug chains. Supermarkets remain the primary grocery shopping destinations where consumers consolidate their purchases. However, they face increasing margin pressures due to the growing penetration of private-label products. To address this, retailers are reallocating shelf space to premium and health-focused products with higher profit margins, while reducing the shelf presence of traditional mass-market brands that generate lower profits per square foot.
Online retail is growing rapidly, with a compound annual growth rate (CAGR) of 8.62% projected through 2031, making it the fastest-growing distribution channel. Platforms like Amazon's Subscribe & Save, Walmart.com, and brand-specific websites are eliminating geographic barriers and enabling highly targeted promotions. On Amazon, Black Forest Gummy Bears consistently rank as the top-selling gummy candy, while HARIBO and Trolli dominate bulk-format searches, highlighting the preference for larger pack sizes that help offset shipping costs. In 2024, HI-CHEW launched a direct-to-consumer platform featuring a "Find Your Flavor" quiz, which offers personalized product assortments and collects valuable first-party data to improve future product development. Additionally, Mondelez shifted Oreo's direct-to-consumer operations to Shopify in 2024, using the platform as a testing ground for limited-edition products and a tool for gathering consumer data. This approach helps refine their broader retail strategies and product offerings.
Geography Analysis
The United States leads North America's confectionery market, driven by high candy consumption, strong retail networks, and year-round marketing. In 2024, the U.S. confectionery market grew, with non-chocolate segments like gummies, hard candies, and mints remaining popular despite rising health awareness. The FDA's front-of-package labeling rule, effective in 2027, requires high-sugar products to display warnings, prompting reformulation costs of USD 50,000 to USD 200,000 per SKU. However, only 10% of consumers consistently buy reduced-sugar options, limiting the commercial benefits. E-commerce plays a key role, with Amazon dominating through Subscribe & Save, Prime Pantry, and third-party sellers. Viral TikTok trends, such as freeze-dried candy, drive demand spikes 3-5 times faster than traditional advertising.
Canada contributes 10.32-11.74% of North America's confectionery revenue in 2025, with bilingual packaging laws and strict sugar-free claim regulations. Major retailers like Loblaw, Sobeys, and Metro dominate grocery distribution. Local brands like Ganong Bros., known for nostalgic products like Chicken Bones, and Laura Secord, offering premium chocolates priced 30-50% higher than imports, maintain relevance. Health Canada's alignment with WHO sugar-free standards in 2024 has accelerated reformulation, but smaller players face higher compliance costs, benefiting multinationals like Mars and Hershey.
Mexico is a fast-growing confectionery market, driven by rising incomes and urbanization. Ferrero's USD 1.3 billion acquisition of Ricolino in 2024 added brands like Vero and Rockaleta to its portfolio, enabling distribution across North America. Ricolino's tamarind, chili, and mango flavors appeal to Hispanic consumers in the U.S., helping Ferrero tap into this growing demographic. COFEPRIS has enforced front-of-package sugar warnings since 2020, positioning Mexican manufacturers as leaders in compliance. Convenience stores and tiendas account for half of Mexico's confectionery sales, focusing on single-serve products priced at MXN 5-15 (USD 0.30-0.90). Modern retailers like OXXO and Walmart de México are expanding, offering multipacks and premium products to increase basket values. Central America and the Caribbean contribute a small share but offer opportunities to replicate Mexico's strategies in similar markets.
Competitive Landscape
The North America sugar confectionery market is fragmented, with a wide mix of multinational manufacturers, regional confectioners, private-label brands, and niche artisanal producers competing across diverse product segments. While major companies such as Mars Incorporated, Mondelēz International Inc., Perfetti Van Melle BV, The Hershey Company, Ferrero International S.p.A strong brand equity and extensive distribution networks, they operate alongside numerous mid-sized and local players that cater to specific flavor preferences, seasonal demand, and impulse-driven purchases. This broad competitive base results in a dynamic marketplace where innovation, branding, and shelf visibility strongly influence consumer choice.
Smaller and regional manufacturers contribute significantly to fragmentation by introducing unique flavors, craft-style formulations, clean-label offerings, and nostalgic or locally inspired products. These companies often thrive by targeting specialty retailers, convenience stores, and online platforms, differentiating themselves through premium positioning or novel textures, gummies, jellies, hard candies, and hybrid confectionery formats. Their agility enables them to respond quickly to emerging trends such as low-sugar variants, functional candy formats, or plant-based ingredients, widening the competitive field and challenging the dominance of larger brands.
Fragmentation is further reinforced by evolving consumer behavior and the expansion of multiple retail channels—from supermarkets and mass merchandisers to convenience outlets, club stores, and e-commerce marketplaces, where diverse brands regularly compete for impulse purchases and promotional visibility. As consumers seek greater variety, seasonal exclusives, and experiential candy formats, manufacturers of all sizes find opportunities to grow. This environment ensures that no single company can fully dominate, maintaining a competitive landscape characterized by constant product launches, strong price competition, and a steady influx of new entrants.
North America Sugar Confectionery Industry Leaders
-
Mars Incorporated
-
Mondelēz International Inc.
-
Perfetti Van Melle BV
-
The Hershey Company
-
Ferrero International S.p.A
- *Disclaimer: Major Players sorted in no particular order

Recent Industry Developments
- October 2025: Bazooka Brands launched Juicy Drop Gummy Mystery Cubes with a multi-flavor interactive 3D gummy experience, available on Amazon and in leading stores like Walmart, Target, and Walgreens, according to the brand.
- October 2025: Nerds released an enhanced version of its gummy clusters in 2025, featuring a strawberry-punch gummy core with a juicy center surrounded by a crunchy Nerds candy shell, now available at major retailers, according to the brand.
- March 2025: Mondelēz launched Glow Up versions of Sour Patch Kids in 2025, offering experiential candy that glows under blacklight, adding a shelf-ready innovation to the gummy segment. The candy will be available in a 3.08 oz small peg bag and a 6.7 oz large peg bag.
- January 2025: Wells Enterprises, in collaboration with Ferrara Candy Company and Trolli, launched new frozen Trolli Gummi Pops. According to the brand, the product is known for its dual neon colors, bold flavors, and soft and chewy texture.


North America Sugar Confectionery Market Report Scope
Hard Candy, Lollipops, Mints, Pastilles, Gummies, and Jellies, Toffees and Nougats, Others are covered as segments by Confectionery Variant. Convenience Store, Online Retail Store, Supermarket/Hypermarket, Others are covered as segments by Distribution Channel. Canada, Mexico, United States are covered as segments by Country.| Hard Candy |
| Mints |
| Pastilles, Gummies, and Jellies |
| Toffees and Nougats |
| Lollipops |
| Other |
| Single-serve |
| Multipacks |
| Mass |
| Premium |
| Supermarket/Hypermarket |
| Online Retail Store |
| Convenience Store |
| Other Distribution Channels |
| United States |
| Canada |
| Mexico |
| Rest of North America |
| Product Type | Hard Candy |
| Mints | |
| Pastilles, Gummies, and Jellies | |
| Toffees and Nougats | |
| Lollipops | |
| Other | |
| Packaging type | Single-serve |
| Multipacks | |
| Price Tier | Mass |
| Premium | |
| Distribution Channel | Supermarket/Hypermarket |
| Online Retail Store | |
| Convenience Store | |
| Other Distribution Channels | |
| Country | United States |
| Canada | |
| Mexico | |
| Rest of North America |


Market Definition
- Milk and White Chocolate - Milk chocolates is a solid chocolate made with milk (in the form of either milk powder, liquid milk, or condensed milk) and cocoa solids. White chocolate is made from cocoa butter and milk and contains no cocoa solids whatsoever. The scope includes regular chocolates, low-sugar, and sugar-free variants
- Toffees & Nougats - Toffees include hard, chewy, and small or one-bite candies marketed with labels as toffee or toffee-like confectionery. Nougat is a chewy confection with almond, sugar, and egg white as a basic ingredient; and it originated in Europe and Middle East countries.
- Cereals Bars - A snack composed of breakfast cereal that has been compressed into a bar shape and is held together with a form of edible adhesive. The scope includes snack bars made with cereals such as rice, oats, corn, etc. mixed with a binding syrup. These also include products labeled as cereal bars, cereal treat bars, or grain bars.
- Chewing Gum - This is a preparation for chewing, usually made of flavored and sweetened chicle or such substitutes as polyvinyl acetate. The types of chewing gums included in the scope are sugar-chewing gums and sugar-free chewing gums
| Keyword | Definition |
|---|---|
| Dark Chocolate | Dark chocolate is a form of chocolate containing cocoa solids and cocoa butter without the milk. |
| White Chocolate | White chocolate is the type of chocolate containing the highest percentage of milk solids, typically around or over 30 percent. |
| Milk Chocolate | Milk chocolate is made from dark chocolate that has a low cocoa solid content and higher sugar content, plus a milk product. |
| Hard Candy | A candy made of sugar and corn syrup boiled without crystallizing. |
| Toffees | A hard, chewy, often brown sweet that is made from sugar boiled with butter. |
| Nougats | A chewy or brittle candy containing almonds or other nuts and sometimes fruit. |
| Cereal bar | A cereal bar is a bar-shaped food product, made by pressing cereals and usually dried fruit or berries, which are in most cases held together by glucose syrup. |
| Protein bar | Protein bars are nutrition bars that contain a high proportion of protein to carbohydrates/fats. |
| Fruit & Nut bar | These are often based on dates with other dried fruit and nut additions and, in some cases, flavorings. |
| NCA | The National Confectioners Association is an American trade organization that promotes chocolate, candy, gum and mints, and the companies that make these treats. |
| CGMP | Current good manufacturing practices are those conforming to the guidelines recommended by relevant agencies. |
| Unstandardized foods | Unstandardized foods are those that do not have a standard of identity or that deviate from a prescribed standard in any manner. |
| GI | The glycemic index (GI) is a way of ranking carbohydrate-containing foods based on how slowly or quickly they are digested and increase blood glucose levels over a period of time |
| Skimmed milk powder | Skimmed milk powder is obtained by removing water from pasteurized skim milk by spray-drying. |
| Flavanols | Flavanols are a group of compounds found in cocoa, tea, apples, and many other plant-based foods and beverages. |
| WPC | Whey protein concentrate- the substance obtained by the removal of sufficient nonprotein constituents from pasteurized whey so that the finished dry product contains greater than 25% protein. |
| LDL | Low density Lipoprotein- the bad cholesterol |
| HDL | High density Lipoprotein- the good cholesterol |
| BHT | butylated Hydroxytoluene is a lab-made chemical that is added to foods as a preservative. |
| Carrageenan | Carrageenan is an additive used to thicken, emulsify, and preserve foods and drinks. |
| Free form | Not containing certain ingredients, such as gluten, dairy, or sugar. |
| Cocoa butter | It is a fatty substance obtained from cocoa beans, used in the manufacture of confectionery. |
| Pastellies | A type of of Brazilian candy made from sugar, eggs, and milk. |
| Draggees | Small, round candies that are coated with a hard sugar shell |
| CHOPRABISCO | Royal Belgian Association of the chocolate, pralines, biscuit, and confectionery industry- A trade association that represents the Belgian chocolate industry. |
| European Directive 2000/13 | A European Union directive that regulates the labeling of food products |
| Kakao-Verordnung | The German chocolate ordinance, a set of regulations that define what can be labeled as "chocolate" in Germany. |
| FASFC | Federal Agency for the Safety of the Food Chain |
| Pectin | A natural substance that is derived from fruits and vegetables. It is used in confectionery to create a gel-like texture. |
| Invert sugars | A type of sugar that is made up of glucose and fructose. |
| Emulsifier | A substance that helps to mix to liquids that does not mix together. |
| Anthocyanins | A type of flavonoid that is responsible for the red, purple, and blue colors of confectionery. |
| Functional Foods | Foods that have been modified to provide additional health benefits beyond basic nutrition. |
| Kosher certificate | This certification verifies that the ingredients, production process including all machinery, and/or food-service process complies with the standards of Jewish dietary law |
| Chicory root extract | A natural extract from the chicory root that is a good source of fiber, calcium, phosphorous, and folate |
| RDD | Recommended daily dose |
| Gummies | A chewy gelatin-based candy that is often flavored with fruit. |
| Nutraceuticals | Food or dietary supplements that are claimed to have health benefits. |
| Energy bars | Snack bars that are high in carbohydrates and calories are designed to provide energy on the go. |
| BFSO | Belgian Food Safety Organization for the food chain. |


Research Methodology
Mordor Intelligence follows a four-step methodology in all our reports.
- Step-1: Identify Key Variables: In order to build a robust forecasting methodology, the variables and factors identified in Step 1 are tested against available historical market numbers. Through an iterative process, the variables required for market forecast are set, and the model is built on the basis of these variables.
- Step-2: Build a Market Model: Market-size estimations for the forecast years are in nominal terms. Inflation is not a part of the pricing, and the average selling price (ASP) is kept constant throughout the forecast period for each country.
- Step-3: Validate and Finalize: In this important step, all market numbers, variables, and analyst calls are validated through an extensive network of primary research experts from the market studied. The respondents are selected across levels and functions to generate a holistic picture of the market studied.
- Step-4: Research Outputs: Syndicated Reports, Custom Consulting Assignments, Databases & Subscription Platforms


