Asia Pacific Sugar Confectionery Market Size and Share
Market Overview
| Study Period | 2021 - 2031 |
|---|---|
| Forecast Data Period | 2026 - 2031 |
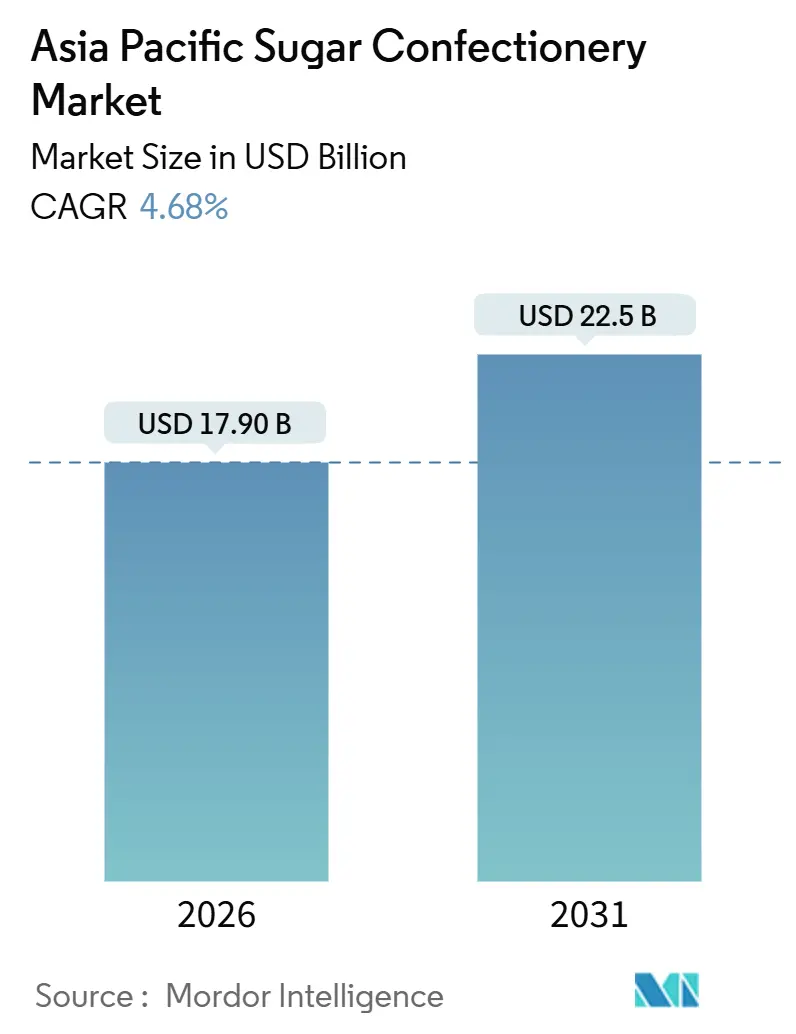
| Market Size (2025) | USD 17.90 Billion |
| Market Size (2031) | USD 22.5 Billion |
| Growth Rate (2026 - 2031) | 4.68% CAGR |
| Largest Market | China |
| Market Concentration | Medium |
Major Players*Disclaimer: Major Players sorted in no particular order Image © Mordor Intelligence. Reuse requires attribution under CC BY 4.0. |
|
Asia Pacific Sugar Confectionery Market Analysis by Mordor Intelligence
The Asia-Pacific sugar confectionery market stood at USD 17.90 billion in 2026 and is projected to reach USD 22.50 billion by 2031, reflecting a 4.68% CAGR and confirming that the Asia-Pacific sugar confectionery market size is expanding in a stable, mid-single-digit range. Product reformulation, functional fortification, and gamified packaging are reshaping consumer expectations, while grocery e-commerce and convenience stores multiply purchase occasions. Multinationals are localizing output to shorten lead times and navigate tariff barriers, yet regional players keep pace through halal, botanical, and reduced-sugar niches. Moderating raw-sugar prices are easing cost pressure, although extreme weather remains a margin risk. Elevated regulatory scrutiny around synthetic colorants is accelerating the adoption of natural alternatives and influencing R&D budgets across the Asia-Pacific sugar confectionery market.
Key Report Takeaways
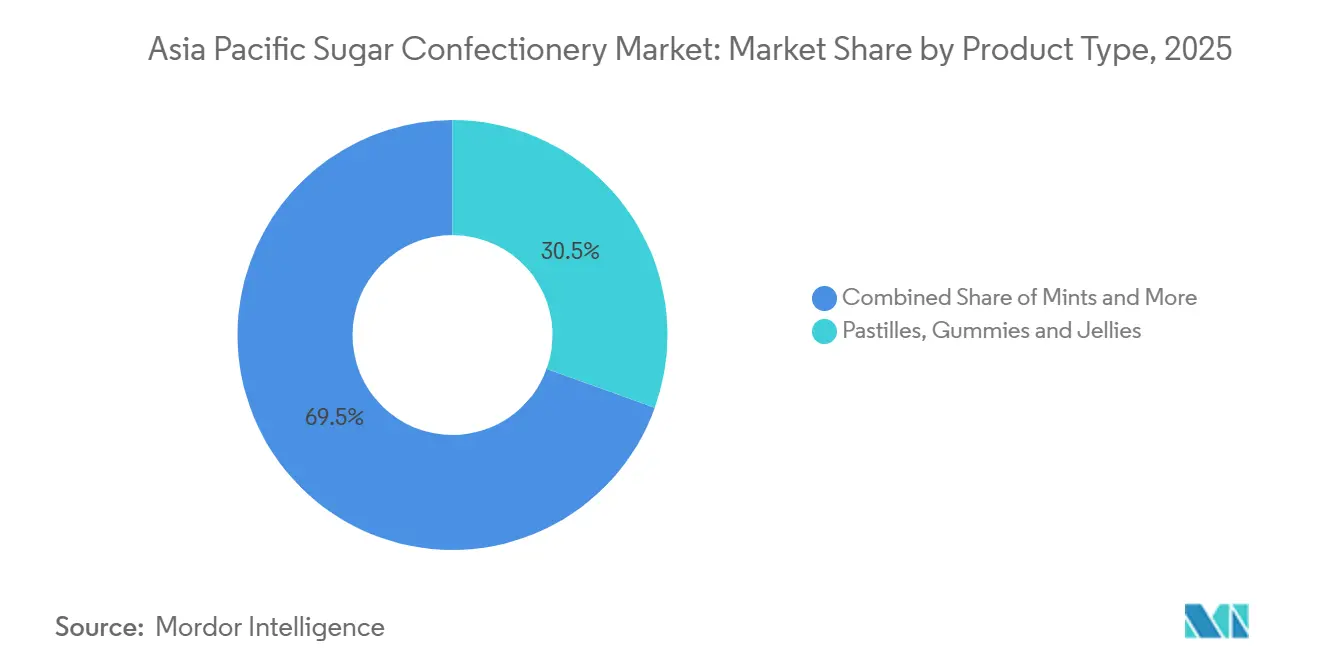
- By product type, pastilles, gummies, and jellies held 30.5% of the Asia-Pacific sugar confectionery market share in 2025.
- Power mints are forecast to expand at a 7.4% CAGR through 2031, the fastest among all product types within the Asia-Pacific sugar confectionery market size.
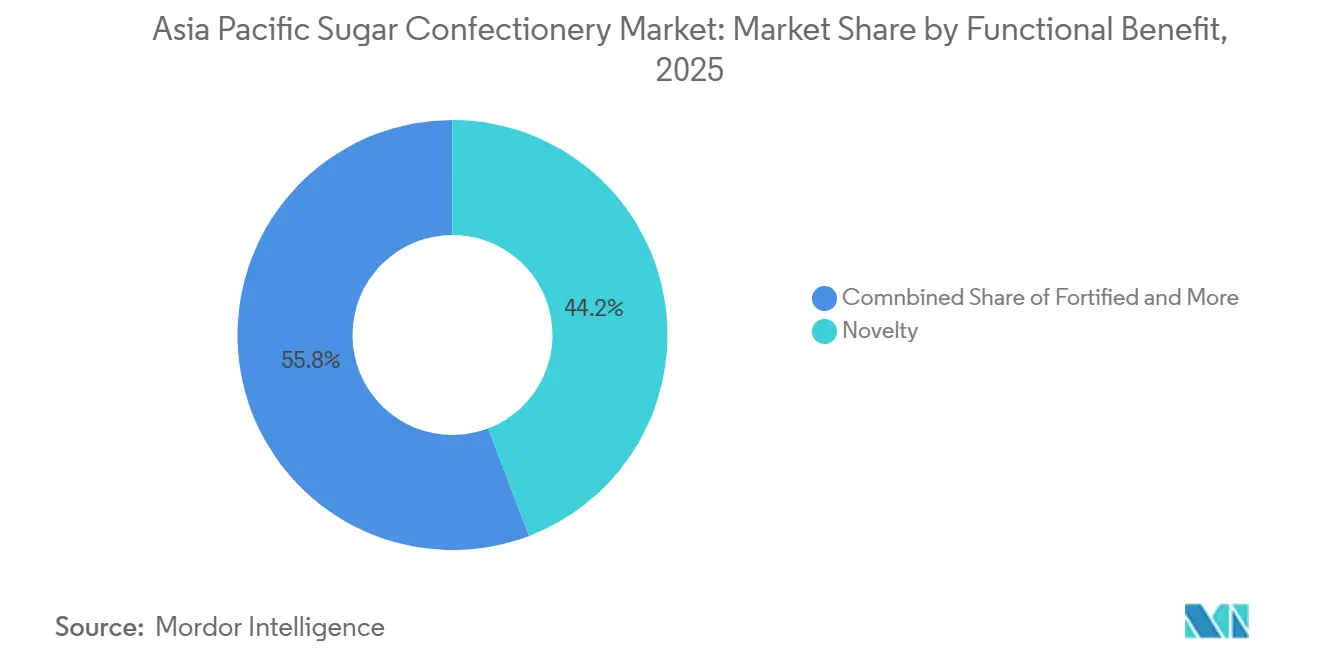
- By functional benefit, novelty-driven varieties commanded 44.2% revenue in 2025, while fortified candy is advancing at a 9% CAGR to 2031.
- By geography, China led with 28.1% revenue in 2025, yet India is advancing at a 6.8% CAGR through 2031.
Note: Market size and forecast figures in this report are generated using Mordor Intelligence’s proprietary estimation framework, updated with the latest available data and insights as of January 2026.
Asia Pacific Sugar Confectionery Market Trends and Insights
Drivers Impact Analysis*
| DRIVER | (~)% IMPACT ON CAGR FORECAST | GEOGRAPHIC RELEVANCE | IMPACT TIMELINE |
|---|---|---|---|
| Rising per-capita snack occasions in emerging economies | +1.2% | India, Indonesia, Vietnam, Philippines, with spillover to Thailand | Medium term (2-4 years) |
| Continuous flavour and texture innovation cycles by leading brands | +0.9% | Global, with accelerated adoption in China, Japan, South Korea | Short term (≤ 2 years) |
| Premium gifting-led demand spikes during festive seasons | +0.7% | China, India, Southeast Asia (Chinese New Year, Diwali, Mid-Autumn Festival) | Short term (≤ 2 years) |
| Rapid expansion of discount and dollar-store retail formats | +0.8% | Indonesia, Thailand, Vietnam, Philippines, rural India | Medium term (2-4 years) |
| Permissible-indulgence positioning via reduced-sugar recipes | +0.6% | Singapore, Australia, Japan, urban China | Long term (≥ 4 years) |
| Gamified / collectible packaging driving impulse purchases | +0.5% | Southeast Asia, China, South Korea (youth demographics) | Short term (≤ 2 years) |
| Source: Mordor Intelligence | |||


Rising Per-Capita Snack Occasions in Emerging Economies
Urbanization in India, Indonesia, and Vietnam is fragmenting meal patterns into multiple snack occasions, with confectionery filling the gap between breakfast and lunch or serving as an evening energy bridge. India's organized retail penetration reached more than 14% in 2025, yet tier-2 cities such as Pune and Coimbatore are adding modern-trade square footage at twice the national average, pulling branded sugar confectionery into distribution networks previously dominated by unbranded local sweets. Indonesia's middle class, projected to exceed 135 million by 2030 [1]University of Southern California, USA, "The Rising of Middle Class in Indonesia: Opportunity and Challenge", cipe.umd.edu, is driving demand for individually wrapped candies that fit motorbike commutes, a format that Mars Wrigley and Perfetti Van Melle are prioritizing in their Southeast Asia product roadmaps. The Philippines' convenience-store density, one outlet per 2,800 residents in Metro Manila, creates multiple daily purchase touchpoints, converting casual browsers into habitual candy buyers.
Permissible-Indulgence Positioning via Reduced-Sugar Recipes
Health-conscious consumers in Singapore, Australia, and Japan are demanding confectionery that delivers indulgence without guilt, a paradox that brands are resolving through reduced-sugar formulations and functional fortification. Thailand's sugar-tax final phase, implemented in April 2025 [2]BANGKOK GLOBAL LAW, "Implementation of Final Phase of Sugar-Based Excise Tax under Thai Excise Law", www.bgloballaw.com, set a 10-gram-per-100-milliliter ceiling that candy makers are voluntarily adopting for solid formats to preempt future regulation. Singapore's Nutri-Grade labeling, which assigns A-to-D grades based on sugar and saturated-fat content, is steering manufacturers toward natural sweeteners such as stevia and monk fruit, though consumer acceptance remains uneven due to aftertaste concerns. EKOLO's sugar-free phlorotannin candy, launched in South Korea in 2024, leverages seaweed-derived sweeteners to position itself as a "functional indulgence," a framing that resonates with the 35-to-50 demographic seeking metabolic health benefits. Australia's regulatory framework permits health claims on confectionery fortified with vitamins or minerals, a loophole that Nestlé and Perfetti Van Melle are exploiting to justify premium pricing on products that might otherwise compete on taste alone.
Premium Gifting-Led Demand Spikes During Festive Seasons
Festive gifting in Asia-Pacific generates demand surges that can represent 30% to 40% of annual confectionery revenue in markets such as China and India. Chinese New Year drives bulk purchases of individually wrapped hard candies and toffees, packaged in red-and-gold tins that signal prosperity, while India's Diwali season sees families exchange assorted candy boxes alongside traditional sweets. Mondelez's 2024 investment of USD 200 million in its Sri City facility included a flexible packaging line capable of switching between everyday and festive formats within 4 hours, a capability that reduces inventory risk during off-peak months. Japan's White Day and Valentine's Day rituals sustain year-round demand for premium chocolate-coated confectionery, yet sugar-candy brands are carving share by positioning fruit jellies as a lighter, less caloric gifting alternative. Southeast Asia's Mid-Autumn Festival is expanding beyond mooncakes into confectionery gift sets, a trend that Lotte and Meiji are exploiting with limited-edition packaging that doubles as collectible keepsakes.
Rapid Expansion of Discount and Dollar-Store Retail Formats
Discount chains and dollar stores are democratizing access to branded confectionery in rural and peri-urban Asia-Pacific, a distribution shift that forces suppliers to rethink pack sizes and price architectures. 7-Eleven operated more than 65,000 stores across the region in 2025 [3]Seven & i Holdings Co., Ltd., "Monthly Business Performance", www.7andi.com, with Indonesia and Thailand accounting for the fastest net-addition rates, while Lawson's partnership with Alfamart is seeding convenience outlets in Javanese villages that previously relied on mom-and-pop kiosks. These formats prioritize single-serve SKUs priced below USD 0.50, a threshold that requires manufacturers to shrink portion sizes or accept lower per-unit margins. Mars Wrigley's 2025 launch of 5-gram Skittles sachets in India and the Philippines targets this channel, trading margin for volume in markets where trial is the gateway to habitual consumption. Thailand's discount grocers, such as Makro and Lotus's, are bundling confectionery into multi-packs that offer 15% to 20% savings versus supermarket pricing, a tactic that pulls price-sensitive shoppers away from premium hypermarket aisles.
Restraints Impact Analysis*
| RESTRAINT | (~)% IMPACT ON CAGR FORECAST | GEOGRAPHIC RELEVANCE | IMPACT TIMELINE |
|---|---|---|---|
| Sugar-tax adoption and anti-obesity campaigns | -0.8% | Thailand, Singapore, Malaysia, with potential expansion to Indonesia, Philippines | Medium term (2-4 years) |
| Raw-sugar price volatility compressing manufacturer margins | -0.5% | Global, with acute exposure in India, China, Australia (cane-producing regions) | Short term (≤ 2 years) |
| Shortfall of pharmaceutical-grade gelatin for gummies | -0.4% | China, Japan, South Korea (high gummy consumption per capita) | Medium term (2-4 years) |
| Heightened regulatory scrutiny on synthetic colourants | -0.3% | China, Australia, Japan (stringent food-safety regimes) | Long term (≥ 4 years) |
| Source: Mordor Intelligence | |||
Reduced Sugar Adoption and Anti-Obesity Campaigns
Fiscal measures targeting sugar-sweetened products are reshaping formulation strategies and eroding volume growth in markets where governments prioritize public-health outcomes over industry revenue. The WHO's 2025 manual on SSB taxation documented that Thailand's phased approach reduced per-capita sugar consumption by 8.6% between 2019 and 2025, a decline that confectionery brands are offsetting through portion control and natural-sweetener substitution. Singapore's Nutri-Grade system, while non-fiscal, is steering consumer choice toward lower-sugar options through front-of-pack labeling that assigns intuitive letter grades, a mechanism that brands fear could extend to solid confectionery if obesity rates continue climbing. Malaysia's Ministry of Health proposed a sugar-tax framework in late 2025, though parliamentary approval remains pending, creating regulatory uncertainty that delays long-term capital allocation for new production lines.
Heightened Regulatory Scrutiny on Synthetic Colourants
Food-safety authorities in China, Australia, and Japan are tightening permissible limits on synthetic colorants, forcing manufacturers to reformulate products or risk being delisted from major retail chains. China's GB 2760-2024 standard, effective January 2025, reduced the allowable concentration of tartrazine (Yellow 5) and allura red (Red 40) by 20%, a shift that required Mars Wrigley and Mondelez to adjust Skittles and Cadbury formulations for the Chinese market. Australia's Food Standards Australia New Zealand (FSANZ) mandated warning labels on products containing six synthetic colors linked to hyperactivity in children, a requirement that prompted Nestlé to switch KITKAT Chunky variants to natural beetroot and turmeric extracts. Natural colorants cost 3 to 5 times more than synthetic alternatives and exhibit lower stability under heat and light, challenges that inflate production costs and shorten shelf life. Japan's consumer advocacy groups are pressuring retailers to prioritize "clean label" confectionery, a trend that favors smaller artisanal brands over multinational portfolios still transitioning away from synthetic inputs.
*Our forecasts treat driver/restraint impacts as directional, not additive. The impact forecasts reflect baseline growth, mix effects, and variable interactions.
Segment Analysis
By Product Type: Gummies Anchor Share, Power Mints Surge
Pastilles, gummies, and jellies commanded 30.5% of the market in 2025, a dominance rooted in their versatility across age groups and their capacity to serve as carriers for functional ingredients such as vitamins, caffeine, or botanicals. Power mints are forecast to expand at 7.4% CAGR through 2031, outpacing all other product types as urban commuters and students seek portable energy boosts that fit pockets and deliver instant refreshment. Hard candy, the category's heritage anchor, is stabilizing around 20% share as brands layer nostalgic flavors, butterscotch, peppermint, with sugar-free formulations to retain aging consumers who prioritize dental health. Toffees and nougats occupy a mid-tier position, benefiting from premium gifting occasions yet constrained by sticky textures that limit on-the-go consumption. Lollipops, while niche, are gaining traction in Southeast Asia through character licensing from Disney and Marvel, which converts children's entertainment into impulse purchases at checkout counters. Standard mints hold a steady share by serving as breath-freshening staples in markets such as Japan and South Korea, where social etiquette around oral hygiene drives habitual consumption. Awak'n Energy Mints, launched in 2025, blend 50 milligrams of caffeine with B-vitamins to position themselves as a functional alternative to energy drinks, a framing that resonates with fitness enthusiasts and night-shift workers.


By Functional Benefit: Novelty Leads, Fortified Accelerates
Novelty-driven products captured 44.2% of functional-benefit sales in 2025, reflecting consumer appetite for limited-edition flavors, seasonal packaging, and sensory experiences that transcend basic sweetness. Fortified confectionery is accelerating at 9% CAGR as brands embed micronutrients, such as vitamin C, zinc, and calcium, to justify premium pricing and appeal to health-conscious parents seeking permissible treats for children. Digestive and botanical variants, while smaller in absolute volume, are carving a niche in urban China and Singapore, where traditional Chinese medicine principles lend credibility to ginger, ginseng, or chrysanthemum-infused candies. The "Others" segment encompasses sugar-free and reduced-calorie offerings that serve diabetic or weight-conscious consumers, a demographic that Australia's regulatory environment supports through permissive health-claim frameworks.
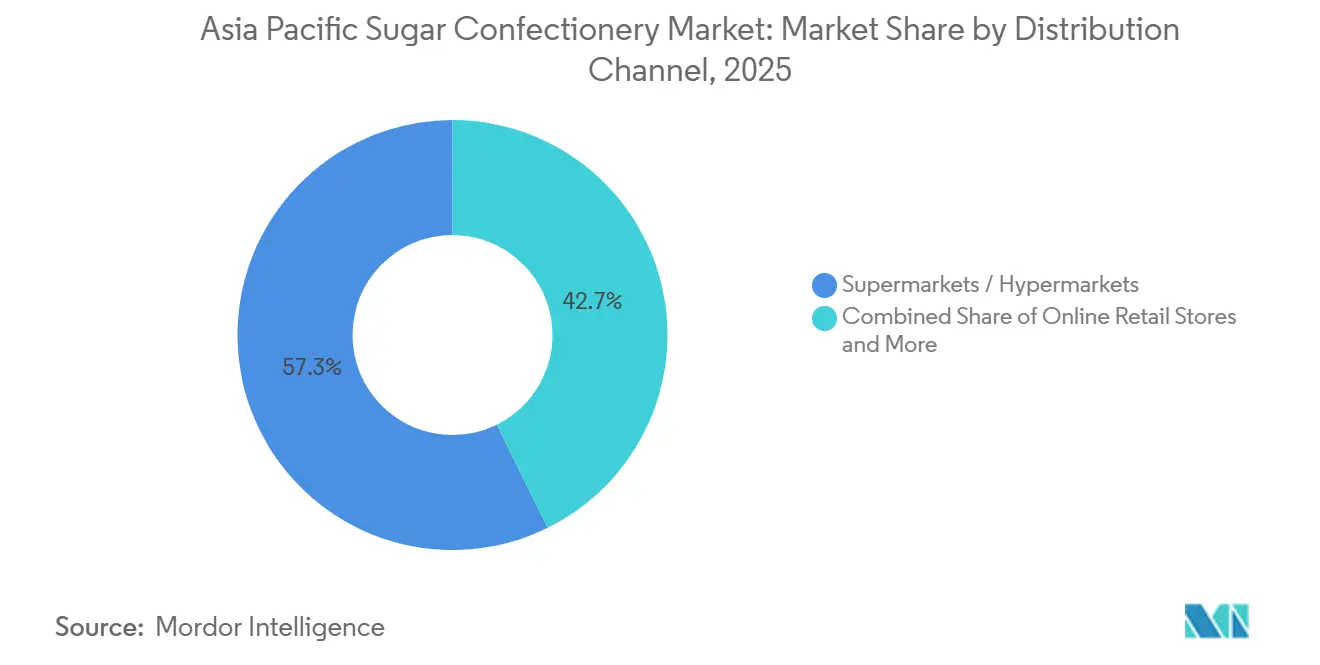
By Distribution Channel: Hypermarkets Dominate, Online Surges
Supermarkets and hypermarkets accounted for 57.3% of distribution in 2025, a reflection of their ability to offer wide assortments, promotional pricing, and impulse-purchase merchandising at checkout lanes. Online retail stores are expanding at 11.4% CAGR, propelled by same-day delivery infrastructure in Jakarta, Bangkok, and Manila that converts digital browsing into instant gratification. Convenience stores, while smaller in absolute share, punch above their weight in Japan and South Korea, where 24-hour accessibility and dense urban footprints create multiple daily purchase occasions. Other channels, including vending machines and specialty confectionery boutiques, serve niche roles, yet their fragmentation complicates distribution for brands seeking scale.
Geography Analysis
China held 28.1% of regional revenue in 2025, yet its growth rate is moderating as urbanization plateaus and health-conscious consumers shift discretionary spending toward functional foods and beverages. India is expanding at 6.8% CAGR through 2031, driven by rising per-capita incomes, organized retail penetration, and festive-season demand spikes during Diwali, Holi, and regional harvest festivals. Japan's market is stabilizing as an aging population prioritizes throat-soothing lozenges and reduced-sugar formats over traditional hard candies, a demographic shift that Meiji and Morinaga are addressing through collagen-fortified and propolis-infused product lines. Australia's regulatory environment, which permits health claims on fortified confectionery, is steering innovation toward vitamin-enriched gummies that appeal to parents seeking permissible treats for children. Indonesia's middle class, projected to exceed 135 million by 2030, is pulling branded sugar confectionery into distribution networks previously dominated by unbranded local sweets, a transition that Lotte and Perfetti Van Melle are accelerating through partnerships with Alfamart and Indomaret convenience chains.
South Korea's high convenience-store density in Seoul, creates habitual purchase loops where consumers stop multiple times weekly, a pattern that drives impulse purchases of limited-edition candy packaging and collectible collaborations. Thailand's sugar-tax final phase, implemented in April 2025, is pushing manufacturers toward reduced-sugar formulations and natural sweeteners, a regulatory nudge that Singapore's Nutri-Grade labeling is replicating through non-fiscal consumer guidance. Singapore's compact geography and high smartphone penetration make it a testbed for e-commerce innovations such as 30-minute delivery windows and augmented-reality packaging experiences that convert digital engagement into physical purchases. The Rest of Asia-Pacific including Vietnam, Philippines, Malaysia, and emerging markets such as Myanmar and Cambodia is expanding faster than the regional average as modern retail formats seed branded confectionery into distribution networks that previously relied on mom-and-pop kiosks. Vietnam's 2024 opening of a Lotte confectionery factory signals multinational confidence in the country's manufacturing cost structure and its role as an export hub to neighboring ASEAN markets Lotte Confectionery.
Ferrero's 2024 expansion of its Hangzhou facility, which added a dedicated line for dual-texture gummies, underscores China's continued importance as both a consumption market and a regional manufacturing hub Ferrero Group. India's USD 200 million Mondelez investment in its Sri City facility, announced in 2024, reflects confidence in the country's long-term growth trajectory despite near-term headwinds from raw-material inflation and fragmented distribution Mondelez International. Japan's premium confectionery segment is attracting attention from European brands such as Lindt and Fazer, which are positioning themselves as luxury gifting options that command 50% to 80% premiums over domestic incumbents. Southeast Asia's festive calendar Chinese New Year, Hari Raya, Songkran generates demand surges that can represent 30% to 40% of annual revenue, a seasonality that requires flexible manufacturing and packaging capabilities to avoid inventory obsolescence during off-peak months.
Competitive Landscape
The Asia-Pacific sugar confectionery market indicates moderate consolidation where global majors Mars, Ferrero, Mondelez, Haribo, and Perfetti Van Melle compete alongside regional champions such as Lotte, Meiji, Hsu Fu Chi, and Morinaga. This balance creates white-space opportunities for niche players offering halal-certified gummies in Indonesia, sugar-free hard candies in South Korea, or botanical-infused lozenges in urban China, segments that multinational portfolios often overlook due to scale thresholds or regulatory complexity.
Strategic patterns emphasize localized production to capture festive-season demand spikes, with Mars Wrigley's 2025 Pune factory expansion and Ferrero's Hangzhou facility demonstrating a commitment to in-market manufacturing that reduces lead times and tariff exposure. Gamified packaging OREO x Pokémon in Southeast Asia, KITKAT x POP MART in Singapore, is converting shelf presence into social-media virality, a tactic that disproportionately drives impulse purchases among Gen Z and millennial consumers who value collectibility alongside taste. Technology deployment is differentiating leaders from laggards: Mondelez's 2024 Sri City investment included a flexible packaging line capable of switching between everyday and festive formats within 4 hours, a capability that reduces inventory risk and accelerates time-to-market for limited-edition SKUs Mondelez International.
Smaller contenders such as EKOLO in South Korea and Boncha Bio in Japan are unsettling incumbents by embedding functional ingredients phlorotannins, probiotics, adaptogens into candy matrices that deliver health benefits alongside indulgence, a positioning that commands premium pricing and attracts health-conscious consumers willing to pay 30% to 50% more than standard formats. Emerging disruptors are leveraging direct-to-consumer e-commerce to bypass traditional retail margins, a strategy that Mars Wrigley piloted in China with personalized M&M's and that smaller brands are replicating through subscription boxes and influencer partnerships on Tmall and JD.com. Compliance with evolving food-safety standards China's GB 2760-2024, Australia's FSANZ colorant warnings is becoming a competitive moat, as brands with robust R&D pipelines can reformulate faster than rivals constrained by legacy supply chains or limited access to natural-ingredient suppliers.
Asia Pacific Sugar Confectionery Industry Leaders
-
Mars Incorporated
-
Mondelēz International Inc.
-
Morinaga & Co. Ltd
-
Nestlé SA
-
Perfetti Van Melle Holding B.V.
- *Disclaimer: Major Players sorted in no particular order


Recent Industry Developments
- January 2025: Mondelez India has announced a new collaboration between Oreo and "Pokémon." The limited-edition cookies showcase 16 unique "Pokémon" designs. This launch also introduces a special yellow cookie, marking a first for Oreo in India.
- September 2024: Mondelez is investing Rs 1,600 crore to expand its facility in Sri City, India. The plant currently has a capacity of approximately one lakh tonnes per annum. With this expansion, the company plans to introduce additional product variants at the facility.
- March 2023: Lotte Vietnam Co., Ltd. has inaugurated the Lotte My Phuoc Factory in Binh Duong Province, Vietnam. This facility will manufacture Bouchee cakes and Choco Pie products under the Lotte Chocolat brand.


Asia Pacific Sugar Confectionery Market Report Scope
Hard Candy, Lollipops, Mints, Pastilles, Gummies, and Jellies, Toffees and Nougats, Others are covered as segments by Confectionery Variant. Convenience Store, Online Retail Store, Supermarket/Hypermarket, Others are covered as segments by Distribution Channel. Australia, China, India, Indonesia, Japan, Malaysia, New Zealand, South Korea are covered as segments by Country.| Hard Candy | |
| Mints | Power Mints |
| Standard Mints | |
| Pastilles, Gummies and Jellies | |
| Toffees and Nougats | |
| Lollipops | |
| Others |
| Novelty |
| Fortified |
| Digestive / Botanicals |
| Others |
| Supermarkets / Hypermarkets |
| Online Retail Stores |
| Convenience Stores |
| Other Channels |
| China |
| India |
| Japan |
| Australia |
| Indonesia |
| South Korea |
| Thailand |
| Singapore |
| Rest of Asia-Pacific |
| By Product Type | Hard Candy | |
| Mints | Power Mints | |
| Standard Mints | ||
| Pastilles, Gummies and Jellies | ||
| Toffees and Nougats | ||
| Lollipops | ||
| Others | ||
| By Functional Benefit | Novelty | |
| Fortified | ||
| Digestive / Botanicals | ||
| Others | ||
| By Distribution Channel | Supermarkets / Hypermarkets | |
| Online Retail Stores | ||
| Convenience Stores | ||
| Other Channels | ||
| By Geography | China | |
| India | ||
| Japan | ||
| Australia | ||
| Indonesia | ||
| South Korea | ||
| Thailand | ||
| Singapore | ||
| Rest of Asia-Pacific | ||


Market Definition
- Milk and White Chocolate - Milk chocolates is a solid chocolate made with milk (in the form of either milk powder, liquid milk, or condensed milk) and cocoa solids. White chocolate is made from cocoa butter and milk and contains no cocoa solids whatsoever. The scope includes regular chocolates, low-sugar, and sugar-free variants
- Toffees & Nougats - Toffees include hard, chewy, and small or one-bite candies marketed with labels as toffee or toffee-like confectionery. Nougat is a chewy confection with almond, sugar, and egg white as a basic ingredient; and it originated in Europe and Middle East countries.
- Cereals Bars - A snack composed of breakfast cereal that has been compressed into a bar shape and is held together with a form of edible adhesive. The scope includes snack bars made with cereals such as rice, oats, corn, etc. mixed with a binding syrup. These also include products labeled as cereal bars, cereal treat bars, or grain bars.
- Chewing Gum - This is a preparation for chewing, usually made of flavored and sweetened chicle or such substitutes as polyvinyl acetate. The types of chewing gums included in the scope are sugar-chewing gums and sugar-free chewing gums
| Keyword | Definition |
|---|---|
| Dark Chocolate | Dark chocolate is a form of chocolate containing cocoa solids and cocoa butter without the milk. |
| White Chocolate | White chocolate is the type of chocolate containing the highest percentage of milk solids, typically around or over 30 percent. |
| Milk Chocolate | Milk chocolate is made from dark chocolate that has a low cocoa solid content and higher sugar content, plus a milk product. |
| Hard Candy | A candy made of sugar and corn syrup boiled without crystallizing. |
| Toffees | A hard, chewy, often brown sweet that is made from sugar boiled with butter. |
| Nougats | A chewy or brittle candy containing almonds or other nuts and sometimes fruit. |
| Cereal bar | A cereal bar is a bar-shaped food product, made by pressing cereals and usually dried fruit or berries, which are in most cases held together by glucose syrup. |
| Protein bar | Protein bars are nutrition bars that contain a high proportion of protein to carbohydrates/fats. |
| Fruit & Nut bar | These are often based on dates with other dried fruit and nut additions and, in some cases, flavorings. |
| NCA | The National Confectioners Association is an American trade organization that promotes chocolate, candy, gum and mints, and the companies that make these treats. |
| CGMP | Current good manufacturing practices are those conforming to the guidelines recommended by relevant agencies. |
| Unstandardized foods | Unstandardized foods are those that do not have a standard of identity or that deviate from a prescribed standard in any manner. |
| GI | The glycemic index (GI) is a way of ranking carbohydrate-containing foods based on how slowly or quickly they are digested and increase blood glucose levels over a period of time |
| Skimmed milk powder | Skimmed milk powder is obtained by removing water from pasteurized skim milk by spray-drying. |
| Flavanols | Flavanols are a group of compounds found in cocoa, tea, apples, and many other plant-based foods and beverages. |
| WPC | Whey protein concentrate- the substance obtained by the removal of sufficient nonprotein constituents from pasteurized whey so that the finished dry product contains greater than 25% protein. |
| LDL | Low density Lipoprotein- the bad cholesterol |
| HDL | High density Lipoprotein- the good cholesterol |
| BHT | butylated Hydroxytoluene is a lab-made chemical that is added to foods as a preservative. |
| Carrageenan | Carrageenan is an additive used to thicken, emulsify, and preserve foods and drinks. |
| Free form | Not containing certain ingredients, such as gluten, dairy, or sugar. |
| Cocoa butter | It is a fatty substance obtained from cocoa beans, used in the manufacture of confectionery. |
| Pastellies | A type of of Brazilian candy made from sugar, eggs, and milk. |
| Draggees | Small, round candies that are coated with a hard sugar shell |
| CHOPRABISCO | Royal Belgian Association of the chocolate, pralines, biscuit, and confectionery industry- A trade association that represents the Belgian chocolate industry. |
| European Directive 2000/13 | A European Union directive that regulates the labeling of food products |
| Kakao-Verordnung | The German chocolate ordinance, a set of regulations that define what can be labeled as "chocolate" in Germany. |
| FASFC | Federal Agency for the Safety of the Food Chain |
| Pectin | A natural substance that is derived from fruits and vegetables. It is used in confectionery to create a gel-like texture. |
| Invert sugars | A type of sugar that is made up of glucose and fructose. |
| Emulsifier | A substance that helps to mix to liquids that does not mix together. |
| Anthocyanins | A type of flavonoid that is responsible for the red, purple, and blue colors of confectionery. |
| Functional Foods | Foods that have been modified to provide additional health benefits beyond basic nutrition. |
| Kosher certificate | This certification verifies that the ingredients, production process including all machinery, and/or food-service process complies with the standards of Jewish dietary law |
| Chicory root extract | A natural extract from the chicory root that is a good source of fiber, calcium, phosphorous, and folate |
| RDD | Recommended daily dose |
| Gummies | A chewy gelatin-based candy that is often flavored with fruit. |
| Nutraceuticals | Food or dietary supplements that are claimed to have health benefits. |
| Energy bars | Snack bars that are high in carbohydrates and calories are designed to provide energy on the go. |
| BFSO | Belgian Food Safety Organization for the food chain. |


Research Methodology
Mordor Intelligence follows a four-step methodology in all our reports.
- Step-1: Identify Key Variables: In order to build a robust forecasting methodology, the variables and factors identified in Step 1 are tested against available historical market numbers. Through an iterative process, the variables required for market forecast are set, and the model is built on the basis of these variables.
- Step-2: Build a Market Model: Market-size estimations for the forecast years are in nominal terms. Inflation is not a part of the pricing, and the average selling price (ASP) is kept constant throughout the forecast period for each country.
- Step-3: Validate and Finalize: In this important step, all market numbers, variables, and analyst calls are validated through an extensive network of primary research experts from the market studied. The respondents are selected across levels and functions to generate a holistic picture of the market studied.
- Step-4: Research Outputs: Syndicated Reports, Custom Consulting Assignments, Databases & Subscription Platforms


