South America Confectionery Market Size and Share
Market Overview
| Study Period | 2021 - 2031 |
|---|---|
| Forecast Data Period | 2026 - 2031 |
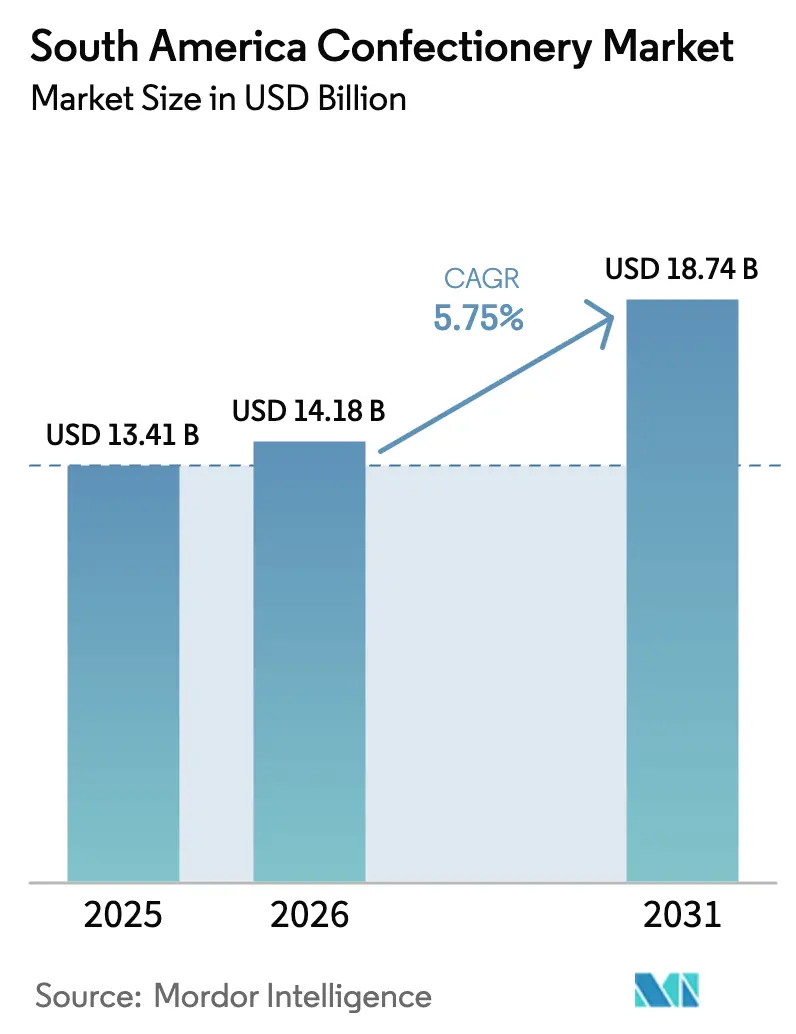
| Base Year Market Size (2025) | USD 13.41 Billion |
| Market Size (2026) | USD 14.18 Billion |
| Market Size (2031) | USD 18.74 Billion |
| Growth Rate (2026 - 2031) | 5.75% CAGR |
| Market Concentration | Medium |
Major Players
*Disclaimer: Major Players sorted in no particular order Image © Mordor Intelligence. Reuse requires attribution under CC BY 4.0. |
|
South America Confectionery Market Analysis by Mordor Intelligence
The South America confectionery market size was valued at USD 13.41 billion in 2025 and estimated to grow from USD 14.18 billion in 2026 to reach USD 18.74 billion by 2031, at a CAGR of 5.75% during the forecast period (2026-2031). The market is driven by urban income recovery, a growing preference for premium chocolate, and the rapid expansion of online retail, although front-of-pack sugar warnings are prompting adjustments in product portfolios. Social media, targeted advertising campaigns, and youth-focused marketing are shaping consumer preferences and enhancing brand visibility. Technological advancements in manufacturing, packaging, and automation are improving product quality, reducing costs, and increasing efficiency. While trends such as premiumization, functional reformulations, and the emergence of digitally native brands are boosting profit margins, challenges like raw-material price volatility and stricter labeling regulations are tempering growth. Brazil remains the leading revenue contributor, but the rise of e-commerce and Argentina's post-inflation recovery are redistributing opportunities across the region. Manufacturers that combine sustainable sourcing with technology-driven fulfillment are well-positioned to capitalize on the next wave of confectionery demand.
Key Report Takeaways
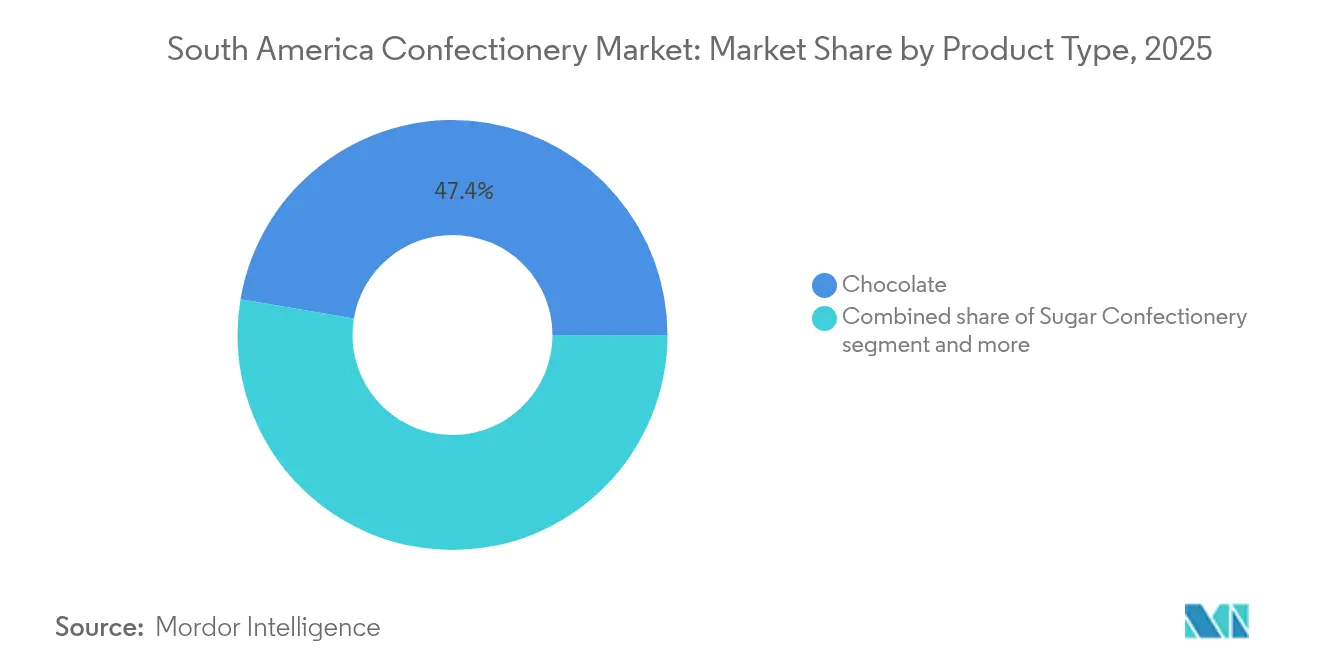
- By product type, chocolate dominated with 47.35% confectionery market share in 2025, while sugar confectionery is projected to grow at a 6.22% CAGR through 2031.
- By packaging, single-serve formats accounted for 60.64% of the confectionery market size in 2025, whereas multipacks are set to expand at a 6.05% CAGR to 2031.
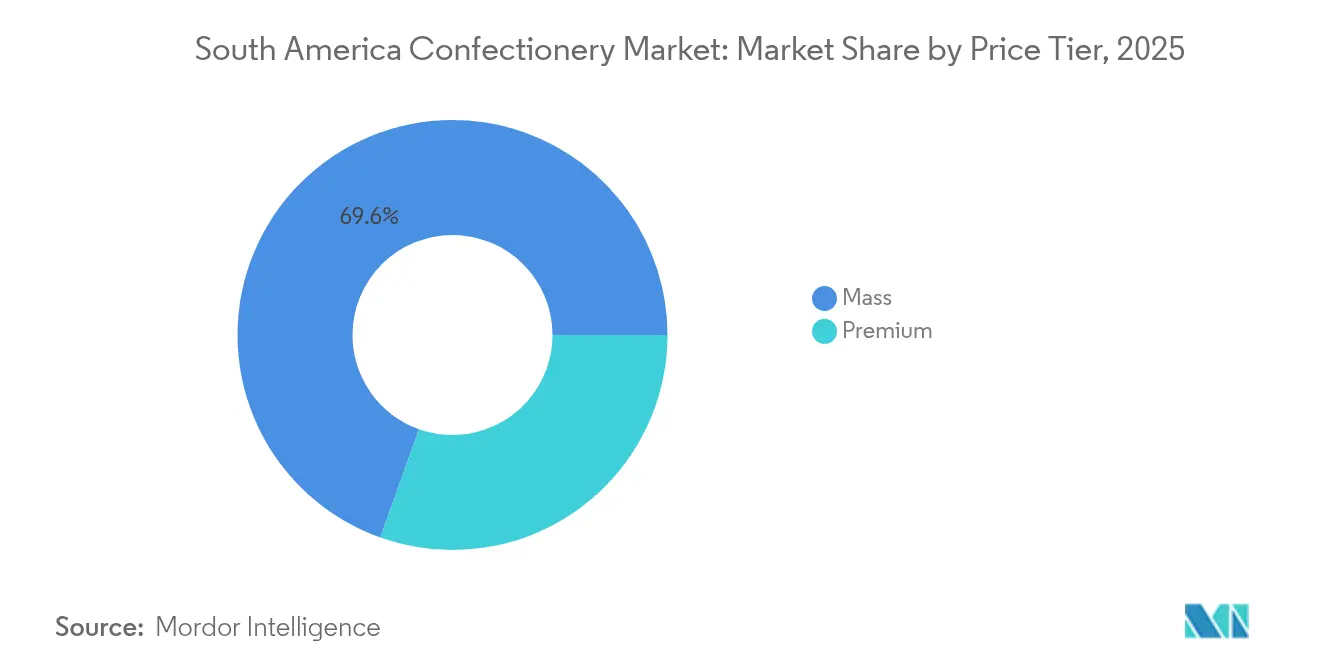
- By price tier, the mass segment captured 69.55% of 2025 revenue, but premium offerings are forecast to advance at a 7.35% CAGR through 2031.
- By distribution channel, supermarkets and hypermarkets led with 54.05% of sales in 2025, while online retail is on track for a 7.12% CAGR through 2031.
- By geography, Brazil generated 61.78% of regional revenue in 2025, yet Argentina is the fastest-growing country at a 6.84% CAGR to 2031.
Note: Market size and forecast figures in this report are generated using Mordor Intelligence’s proprietary estimation framework, updated with the latest available data and insights as of 2026.
South America Confectionery Market Trends and Insights
Drivers Impact Analysis*
| Driver | (~) % Impact on CAGR Forecast | Geographic Relevance | Impact Timeline |
|---|---|---|---|
| Rising demand for premium and gourmet confectionery products | +1.2% | Brazil, Argentina, Chile urban centers | Medium term (2-4 years) |
| Influence of social media and advertising campaigns | + 0.8% | Brazil, Colombia, with spillover to Argentina | Short term (≤ 2 years) |
| Technological innovations in packaging, automation, and manufacturing processes | +0.6% | Brazil, Argentina manufacturing hubs | Long term (≥ 4 years) |
| Expansion of modern retail and e-commerce | +1.4% | Brazil, Chile, Argentina metro areas | Medium term (2-4 years) |
| Surge in sugar-free and functional confectionery launches | +0.9% | Brazil, Chile (regulatory-driven), Argentina | Medium term (2-4 years) |
| Consumer interest in sustainable and ethically sourced ingredients | +0.7% | Brazil, Colombia cocoa regions, Chile | Long term (≥ 4 years) |
| Source: Mordor Intelligence | |||


Rising demand for premium and gourmet confectionery products
With disposable incomes recovering, consumers are increasingly opting for premium chocolates and artisanal confections, seeking unique alternatives to standard products. For example, the World Bank reported that Chile's consumer expenditure reached USD 203.46 billion in 2023[1]Source: World Bank, "Consumer Expenditure", worldbank.org. Premium confectionery products, characterized by innovative flavors, appealing packaging, and exclusive experiences, fulfill consumer preferences for indulgence, personalized gifting, and distinctive offerings. This trend drives manufacturers to prioritize product innovation and differentiation, resulting in expanded product portfolios and stronger consumer engagement. Additionally, the premium segment's higher price points enhance company's profitability, fueling further market growth. Nestlé's acquisition of Grupo CRM in 2024 highlights this trend, granting the Swiss multinational control over Kopenhagen's 400-store premium network and Brasil Cacau's bean-to-bar operations, reflecting confidence in affluent consumers' readiness to spend despite inflationary challenges. In urban retail markets like São Paulo and Buenos Aires, attributes such as single-origin labels, organic certifications, and exclusive collaborations with renowned pastry chefs are rapidly becoming standard expectations.
Influence of social media and advertising campaigns
Digital platforms have narrowed the gap between product launches and mass awareness. This evolution enables confectionery brands to bypass traditional media purchases, instead leveraging influencer partnerships and user-generated content to establish trends. In 2024, Mondelez's Oreo campaign in collaboration with Netflix's "Wednesday" series in Brazil resulted in a 70% increase in marketing investments. By employing character licensing and limited-edition packaging, the campaign effectively converted streaming audiences into retail store visitors. Advertising strategies now emphasize storytelling and emotional engagement, fostering brand loyalty and driving impulse purchases. Social media significantly aids in spreading new confectionery trends and promoting limited-edition products. These trends are often highlighted through user-generated content, which boosts consumer interest and encourages product trials. Additionally, the rise in mobile internet users and the influence of social media are accelerating e-commerce growth. By promoting online retail platforms and offering exclusive digital deals, these channels are expanding market reach. For example, the International Telecommunication Union reported that Chile had 26.2 million mobile cellular subscriptions in 2024[2]Source: International Telecommunication Union, "Number of mobile cellular subscriptions", itu.int.
Expansion of modern retail and e-commerce
In 2024, supermarkets and hypermarkets accounted for a significant 54.71% share of the distribution market. Despite this dominance, online retail stores are anticipated to grow at a robust annual rate of 7.58% through 2030. This growth is attributed to substantial investments in infrastructure and a noticeable shift in consumer shopping behaviors. Retailers are increasingly adopting multipack formats to optimize basket economics. For example, selling a 6-pack of chocolate bars generates a higher absolute margin compared to selling six individual bars separately. Furthermore, e-commerce logistics are evolving to prioritize consolidated shipments, which effectively lower per-unit delivery costs and improve operational efficiency. Modern retail outlets, particularly supermarkets and hypermarkets, provide consumers with a broad assortment of confectionery products in a convenient, one-stop-shopping environment. These channels are especially prominent in urban areas, where they enhance product visibility and availability. Additionally, strategic product placements within these stores encourage impulse purchases, further driving sales.
Surge in sugar-free and functional confectionery launches
In South America, a surge in sugar-free and functional confectionery launches is reshaping the market, catering to a rising wave of health-conscious consumers. Manufacturers are harnessing advancements in natural sweeteners and clean-label formulations, enhancing taste and texture to counteract the historical taste challenges of sugar-free products. With mounting regulatory pressures and heightened health awareness, manufacturers are swiftly reformulating, opting for alternative sweeteners and functional ingredients. This strategy not only helps them avoid front-of-pack warnings but also appeals to the wellness-focused consumer base. Cargill's Genuine Zero chocolate, debuting in 2024, smartly employs allulose and stevia, achieving zero added sugar without compromising mouthfeel. This product is squarely aimed at Brazilian consumers on the hunt for reduced-sugar options. Meanwhile, in November 2024, NotCo rolled out NotSquares, a protein-fortified plant-based snack bar, marketing it as a post-workout substitute for conventional candy bars. These strategic launches are in line with ANVISA's RDC 429/2020 and ANMAT's Law 27,642. These regulations mandate warning octagons on products surpassing sugar limits, effectively carving out a two-tier market. Here, reformulated SKUs not only secure prime shelf space but also enjoy greater advertising liberties.
Restraints Impact Analysis*
| Restraint | (~) % Impact on CAGR Forecast | Geographic Relevance | Impact Timeline |
|---|---|---|---|
| Health concerns related to excessive sugar consumption | -0.9% | Brazil, Chile (strict labeling), Argentina | Short term (≤ 2 years) |
| Fluctuations in raw material prices | -1.3% | Brazil, Colombia cocoa regions, Argentina | Short term (≤ 2 years) |
| Private-label and economy brand margin pressure | -0.6% | Brazil, Argentina retail chains | Medium term (2-4 years) |
| Seasonal demand fluctuations affecting consistent sales volumes | -0.4% | Regional, with peaks in Easter and Christmas | Short term (≤ 2 years) |
| Source: Mordor Intelligence | |||
Health concerns related to excessive sugar consumption
Health concerns over excessive sugar consumption are significantly impacting the South America confectionery market, driven by both consumer caution and regulatory pressures. The region has experienced a rise in obesity, type 2 diabetes mellitus (T2DM), cardiovascular diseases, dental caries, and other metabolic disorders, all associated with high consumption of sugar-sweetened beverages (SSBs) and confectionery products. For instance, in 2024, Brazil recorded a 10.6% prevalence of diabetes among adults, amounting to 16,621,400 cases, according to the International Diabetes Federation[3]Source: International Diabetes Federation, "Brazil- Key information", idf.org. These health risks have heightened public awareness, prompting consumers to prefer low-sugar, sugar-free, or functional confectionery options, thereby reducing demand for traditional sugary products. Governments are introducing measures such as sugar taxes, stricter labeling regulations, and advertising restrictions on high-sugar foods to address public health concerns. These actions, coupled with shifting consumer preferences, present significant challenges for manufacturers reliant on sugary confections, compelling them to reformulate products and expand their portfolios. Additionally, these health concerns have increased competition from healthier snacks and alternative indulgences, further limiting sales of conventional confectioneries.
Fluctuations in raw material prices
From February to August 2024, cocoa prices increased by 20.4%, driven by supply disruptions in West Africa and speculative trading. The International Cocoa Organization reported that erratic rainfall caused mid-crop shortfalls in Côte d'Ivoire and Ghana. Similarly, Brazil's 2024 sugarcane harvest experienced drought-related delays, contributing to sugar price volatility. These fluctuations, caused by reduced production and increased demand, have put pressure on manufacturers' cost structures. Such raw material price instability complicates production planning and pricing strategies, making it challenging to maintain stable product prices and profitability. Additionally, currency volatility and regional inflation further intensify operational risks. Manufacturers are addressing these challenges by focusing on cost management, sourcing locally, developing premium products that can command higher prices, and implementing dynamic pricing models. However, prolonged raw material price instability could hinder market growth, reduce product affordability, and increase price sensitivity among South American consumers.
*Our forecasts treat driver/restraint impacts as directional, not additive. The impact forecasts reflect baseline growth, mix effects, and variable interactions.
Segment Analysis
By Product Type: Chocolate Anchors Volume, Sugar Confectionery Gains Velocity
In 2025, chocolate accounted for 47.35% of the market revenue, highlighting strong consumer preferences for milk and dark tablets, seasonal gifting, and premium single-origin bars. However, sugar confectionery is projected to grow at a faster annual rate of 6.22% through 2031, compared to chocolate's 5.55%. This growth is driven by manufacturers' innovations in gummies, pastilles, and hard candies, designed to meet front-of-pack labeling requirements while offering unique experiences. Dark chocolate benefits from its perceived health advantages, with marketed cocoa percentages emphasizing antioxidant properties and reduced added sugars. Meanwhile, milk and white chocolates remain key volume drivers in mass retail, particularly during festive periods like Easter and Christmas. The resurgence of sugar confectionery is linked to reformulation efforts: hard candies now incorporate isomalt and erythritol to avoid "high sugar" warnings, while pastilles and gummies use fruit purees and natural colorants to attract parents seeking cleaner labels.
Although snack bars represent a smaller segment, they are experiencing growth as functional nutrition aligns with on-the-go convenience. Cereal and protein bars are increasingly popular in gyms and workplace vending machines. Brands such as NotCo with its NotSquares and Dr. Peanut's protein alfajor are targeting millennials, positioning confectionery as a macro-friendly snack rather than a purely indulgent treat. Energy bars, while still niche, are gaining popularity in Colombia and Chile, driven by the regions' outdoor recreation and cycling culture, which demand portable calorie options. Fruit and nut bars are positioned as premium products, with brands emphasizing whole ingredients and minimal processing to differentiate themselves from mass-market granola bars.


By Packaging Type: Multipacks Gain Ground as E-Commerce Reshapes Fulfillment
In 2025, single-serve formats represented 60.64% of sales, primarily driven by impulse purchases at convenience stores, kiosks, and checkout lanes. However, multipacks are anticipated to grow at an annual rate of 6.05% through 2031. This growth stems from retailers and e-commerce platforms focusing on basket size and per-unit economics. For example, a 6-pack of chocolate bars delivers a higher absolute margin compared to selling six individual units separately. Modern retail chains are responding by expanding multipack offerings to attract family shoppers who prioritize value over single-serve convenience. E-commerce logistics further enhance the appeal of multipacks, as consolidated shipments lower per-unit delivery costs. Additionally, subscription models, where consumers receive monthly assortments, are gaining traction in Brazil and Argentina. Mondelez, a major player, aims to achieve 30% digital penetration by 2026.
Single-serve packaging remains essential for on-the-go consumption and product trials. This is particularly evident in convenience stores, where 70% of purchases are unplanned and influenced by point-of-sale displays. Mars Wrigley has implemented a transaction-zone strategy, placing M and M's Minis 310-gram sharing packs near checkout counters. This strategy bridges the gap between single-serve and multipack by offering resealable formats that cater to both impulse and planned purchases. Sustainability concerns are also shaping packaging decisions. For instance, Rainforest Alliance now requires recyclable or compostable wrappers for cocoa products. In response, brands are testing paper-based laminates and biodegradable films to meet retailer requirements and consumer expectations.
By Price Tier: Premium Segment Outpaces Mass as Consumers Trade Up
In 2025, mass-market confectionery accounted for 69.55% of the volume share, driven by its affordability and extensive distribution. However, the premium segment is projected to grow at an annual rate of 7.35% through 2031. This growth is primarily attributed to middle-income urban consumers valuing origin stories, sustainable sourcing, and artisanal craftsmanship. Nestlé's acquisition of Grupo CRM, completed in 2024, has provided the Swiss multinational control over Kopenhagen's 400-store premium network. These stores report average transaction values 200-300% higher than mass retail, while Brasil Cacau's bean-to-bar strategy achieves a 40-60% price premium over standard commodity chocolate.
Premium brands are effectively leveraging single-origin cocoa, organic certifications, and limited-edition collaborations to support their higher price points. Brands such as Lindt, with its Excellence line, and Ferrero's Rocher are expanding their presence in duty-free outlets and upscale supermarkets. They are focusing on gifting occasions, where packaging appeal and brand heritage significantly influence purchasing decisions. In response, mass-market players are introducing "masstige" sub-brands that provide incremental upgrades, such as higher cocoa content or Fair Trade certification, at mid-tier prices. This approach blurs category lines and attracts consumers seeking premium experiences at more affordable prices. Additionally, private-label premium lines launched by Carrefour and Walmart in Brazil are further fragmenting the market. By offering artisanal aesthetics at prices close to mass-market levels, these private labels are pushing branded manufacturers to intensify innovation and marketing efforts to maintain their market share.
By Distribution Channel: Online Retail Accelerates as Supermarkets Hold Core Volume
In 2025, supermarkets and hypermarkets accounted for 54.05% of total sales, highlighting their significance as primary destinations for weekly grocery shopping. These outlets serve as one-stop shops, offering a wide range of products under one roof, which appeals to consumers seeking convenience and efficiency. On the other hand, online retail stores are projected to achieve a strong annual growth rate of 7.12% through 2031. This growth is driven by substantial investments in infrastructure, advancements in last-mile delivery systems, and a noticeable shift in consumer purchasing behaviors toward digital platforms. Mondelez is actively pursuing strategies to enhance its digital penetration, aiming to capitalize on the growing e-commerce trend.
Convenience stores, while smaller in terms of sales volume, play a pivotal role in catering to impulse purchases and on-the-go consumption. This is especially true in urban areas, where many transactions are spontaneous, often influenced by eye-catching point-of-sale displays. For instance, Mars Wrigley strategically positions M and M's and Maltesers near checkout counters, tapping into the trend of last-minute additions to shopping baskets. While other distribution channels,such as independent retailers, pharmacies, and vending machines,are seeing consolidation with the rise of modern retail, they continue to hold significance in rural regions and low-income neighborhoods, where access to supermarkets is limited.
Geography Analysis
In 2025, Brazil accounted for 61.78% of the regional revenue, driven by its large population, increasing disposable incomes, and a strong confectionery culture encompassing mass-market tablets and premium artisanal brands. Nestlé's acquisition of Grupo CRM, the owner of Kopenhagen and Brasil Cacau, bolsters its premium chocolate distribution and positions the Swiss multinational to tap into the gifting market. In response to ANVISA's RDC 429/2020 regulation requiring front-of-pack warning labels for high-sugar products, manufacturers are adapting. Cargill's Genuine Zero chocolate and NotCo's NotSquares highlight the use of alternative sweeteners and functional ingredients to address regulatory requirements while appealing to health-conscious consumers.
Argentina is projected to grow at an annual rate of 6.84% through 2031, the fastest in the region, as macroeconomic stabilization and currency reforms enhance purchasing power, enabling consumers to upgrade from economy brands to mid-tier and premium options. Similar to Brazil's labeling regulations, ANMAT's Law 27,642 requires warning octagons for products exceeding sugar thresholds. This has accelerated sugar-free innovations, such as Dr. Peanut's protein alfajor, designed for gym-goers seeking indulgence without compromising their nutritional goals. To mitigate domestic volatility, Arcor, Argentina's largest confectionery producer, acquired Sayon Industrias Teal in December 2024 and a Peruvian chocolate brand earlier in the year, reflecting a strategy of geographic diversification and vertical integration. As retailers like Carrefour and Walmart introduce premium store brands with artisanal aesthetics at competitive prices, the intensifying private-label competition is pushing branded manufacturers to focus on innovation and marketing to protect their market share.
Chile, Colombia, and other South American countries collectively offer growth potential, with Chile standing out due to its strict regulatory environment and high per-capita consumption. Chile's Law 20.606, enacted in 2016 and progressively tightened, mandates front-of-pack warning labels and restricts advertising. Meanwhile, Colombia's confectionery sector benefits from domestic cocoa production and proximity to Central American supply chains. However, the sector experiences significant quarterly volatility, driven by seasonal demand peaks during Easter and Christmas.
Competitive Landscape
The South America confectionery market exhibits moderate consolidation. In South America, multinational corporations such as Nestlé SA, Mondelez International Inc., and Mars Inc. hold a significant share of the confectionery market. However, regional players like Arcor, Cacau Show, and Colombina maintain a strong foothold by capitalizing on local brand loyalty, vertical integration, and extensive franchise networks, advantages that multinational companies often find difficult to replicate effectively. These regional champions have built a deep understanding of local consumer preferences, enabling them to tailor their offerings and marketing strategies to resonate with the regional audience.
South America's confectionery landscape is marked by relentless product innovation and strategic expansions. Leading companies are crafting premium offerings, emphasizing unique flavors, clean labels, and healthier choices to align with shifting consumer tastes. They're showcasing operational agility by bolstering manufacturing capabilities, establishing research and development centers, and digitizing production. Their strategies encompass forging partnerships with local distributors, acquiring regional brands, and launching direct-to-consumer channels. Market frontrunners are not just setting up new manufacturing units and retail outlets but are also amplifying their e-commerce presence and fortifying distribution networks in both urban and rural locales.
The adoption of advanced technologies is becoming a critical differentiator between market leaders and lagging competitors. Automation and digital marketing are now essential tools for defending profit margins and capturing greater market share. Significant growth opportunities exist in the functional confectionery segment, particularly in products like protein bars and sugar-free gummies, which remain underdeveloped compared to North America. Furthermore, direct-to-consumer subscription models present a promising avenue, enabling companies to bypass traditional retail channels and secure consistent, recurring revenue streams. These models also allow companies to build stronger relationships with consumers by offering personalized experiences and exclusive product offerings, further enhancing brand loyalty and customer retention.
South America Confectionery Industry Leaders
-
Arcor S.A.I.C
-
Cacau Show
-
Ferrero International SA
-
Mondelēz International Inc.
-
Nestlé SA
- *Disclaimer: Major Players sorted in no particular order

Recent Industry Developments
- September 2024: Ferrero Rocher has introduced a new bar format of its chocolates in Brazil, aiming to broaden its audience reach. These bars offer a more informal and accessible alternative to the brand's traditional chocolate offerings.
- February 2024: Cacau Show has acquired the PlayCenter amusement park in São Paulo, enhancing its experiential retail strategy by combining chocolate tourism with family entertainment.
- July 2023: Ferrero's sister company, Ferrara Candy Co., announced the acquisition of Brazilian snacks company Dori Alimentos, which sells a variety of chocolate and sugar confectionery brands, including Dori, Pettiz, and Jubes.
- April 2023: Under the ONE brand, The Hershey Company launched the Peanut Butter and Jelly Flavored Protein Bar. The ONE Limited Edition Peanut Butter and Jelly flavored bars are packed with 20 g of protein, 1 g of sugar, and the familiar taste of peanut butter and strawberry jelly flavors.


South America Confectionery Market Report Scope
Chocolate, Gums, Snack Bar, Sugar Confectionery are covered as segments by Confections. Convenience Store, Online Retail Store, Supermarket/Hypermarket, Others are covered as segments by Distribution Channel. Argentina, Brazil are covered as segments by Country.| Chocolate | Dark Chocolate | |
| Milk and White Chocolate | ||
| Sugar Confectionery | Hard Candy | |
| Mints | ||
| Pastilles, Gummies, and Jellies | ||
| Toffees and Nougats | ||
| Lollipops | ||
| Other | ||
| Snack Bar | Cereal Bar | |
| Energy Bar | ||
| Protein Bar | ||
| Fruit and Nut Bar | ||
| Gums | Chewing Gum | Overview |
| Sugar Chewing Gum | ||
| Sugar-free Chewing Gum | ||
| Bubble Gum | ||
| Single-serve |
| Multipacks |
| Mass |
| Premium |
| Supermarket/Hypermarket |
| Online Retail Store |
| Convenience Store |
| Other Distribution Channels |
| Brazil |
| Argentina |
| Colombia |
| Chile |
| Rest of South America |
| Product Type | Chocolate | Dark Chocolate | |
| Milk and White Chocolate | |||
| Sugar Confectionery | Hard Candy | ||
| Mints | |||
| Pastilles, Gummies, and Jellies | |||
| Toffees and Nougats | |||
| Lollipops | |||
| Other | |||
| Snack Bar | Cereal Bar | ||
| Energy Bar | |||
| Protein Bar | |||
| Fruit and Nut Bar | |||
| Gums | Chewing Gum | Overview | |
| Sugar Chewing Gum | |||
| Sugar-free Chewing Gum | |||
| Bubble Gum | |||
| Packaging type | Single-serve | ||
| Multipacks | |||
| Price Tier | Mass | ||
| Premium | |||
| Distribution Channel | Supermarket/Hypermarket | ||
| Online Retail Store | |||
| Convenience Store | |||
| Other Distribution Channels | |||
| Geography | Brazil | ||
| Argentina | |||
| Colombia | |||
| Chile | |||
| Rest of South America | |||


Market Definition
- Milk and White Chocolate - Milk chocolates is a solid chocolate made with milk (in the form of either milk powder, liquid milk, or condensed milk) and cocoa solids. White chocolate is made from cocoa butter and milk and contains no cocoa solids whatsoever. The scope includes regular chocolates, low-sugar, and sugar-free variants
- Toffees & Nougats - Toffees include hard, chewy, and small or one-bite candies marketed with labels as toffee or toffee-like confectionery. Nougat is a chewy confection with almond, sugar, and egg white as a basic ingredient; and it originated in Europe and Middle East countries.
- Cereals Bars - A snack composed of breakfast cereal that has been compressed into a bar shape and is held together with a form of edible adhesive. The scope includes snack bars made with cereals such as rice, oats, corn, etc. mixed with a binding syrup. These also include products labeled as cereal bars, cereal treat bars, or grain bars.
- Chewing Gum - This is a preparation for chewing, usually made of flavored and sweetened chicle or such substitutes as polyvinyl acetate. The types of chewing gums included in the scope are sugar-chewing gums and sugar-free chewing gums
| Keyword | Definition |
|---|---|
| Dark Chocolate | Dark chocolate is a form of chocolate containing cocoa solids and cocoa butter without the milk. |
| White Chocolate | White chocolate is the type of chocolate containing the highest percentage of milk solids, typically around or over 30 percent. |
| Milk Chocolate | Milk chocolate is made from dark chocolate that has a low cocoa solid content and higher sugar content, plus a milk product. |
| Hard Candy | A candy made of sugar and corn syrup boiled without crystallizing. |
| Toffees | A hard, chewy, often brown sweet that is made from sugar boiled with butter. |
| Nougats | A chewy or brittle candy containing almonds or other nuts and sometimes fruit. |
| Cereal bar | A cereal bar is a bar-shaped food product, made by pressing cereals and usually dried fruit or berries, which are in most cases held together by glucose syrup. |
| Protein bar | Protein bars are nutrition bars that contain a high proportion of protein to carbohydrates/fats. |
| Fruit & Nut bar | These are often based on dates with other dried fruit and nut additions and, in some cases, flavorings. |
| NCA | The National Confectioners Association is an American trade organization that promotes chocolate, candy, gum and mints, and the companies that make these treats. |
| CGMP | Current good manufacturing practices are those conforming to the guidelines recommended by relevant agencies. |
| Unstandardized foods | Unstandardized foods are those that do not have a standard of identity or that deviate from a prescribed standard in any manner. |
| GI | The glycemic index (GI) is a way of ranking carbohydrate-containing foods based on how slowly or quickly they are digested and increase blood glucose levels over a period of time |
| Skimmed milk powder | Skimmed milk powder is obtained by removing water from pasteurized skim milk by spray-drying. |
| Flavanols | Flavanols are a group of compounds found in cocoa, tea, apples, and many other plant-based foods and beverages. |
| WPC | Whey protein concentrate- the substance obtained by the removal of sufficient nonprotein constituents from pasteurized whey so that the finished dry product contains greater than 25% protein. |
| LDL | Low density Lipoprotein- the bad cholesterol |
| HDL | High density Lipoprotein- the good cholesterol |
| BHT | butylated Hydroxytoluene is a lab-made chemical that is added to foods as a preservative. |
| Carrageenan | Carrageenan is an additive used to thicken, emulsify, and preserve foods and drinks. |
| Free form | Not containing certain ingredients, such as gluten, dairy, or sugar. |
| Cocoa butter | It is a fatty substance obtained from cocoa beans, used in the manufacture of confectionery. |
| Pastellies | A type of of Brazilian candy made from sugar, eggs, and milk. |
| Draggees | Small, round candies that are coated with a hard sugar shell |
| CHOPRABISCO | Royal Belgian Association of the chocolate, pralines, biscuit, and confectionery industry- A trade association that represents the Belgian chocolate industry. |
| European Directive 2000/13 | A European Union directive that regulates the labeling of food products |
| Kakao-Verordnung | The German chocolate ordinance, a set of regulations that define what can be labeled as "chocolate" in Germany. |
| FASFC | Federal Agency for the Safety of the Food Chain |
| Pectin | A natural substance that is derived from fruits and vegetables. It is used in confectionery to create a gel-like texture. |
| Invert sugars | A type of sugar that is made up of glucose and fructose. |
| Emulsifier | A substance that helps to mix to liquids that does not mix together. |
| Anthocyanins | A type of flavonoid that is responsible for the red, purple, and blue colors of confectionery. |
| Functional Foods | Foods that have been modified to provide additional health benefits beyond basic nutrition. |
| Kosher certificate | This certification verifies that the ingredients, production process including all machinery, and/or food-service process complies with the standards of Jewish dietary law |
| Chicory root extract | A natural extract from the chicory root that is a good source of fiber, calcium, phosphorous, and folate |
| RDD | Recommended daily dose |
| Gummies | A chewy gelatin-based candy that is often flavored with fruit. |
| Nutraceuticals | Food or dietary supplements that are claimed to have health benefits. |
| Energy bars | Snack bars that are high in carbohydrates and calories are designed to provide energy on the go. |
| BFSO | Belgian Food Safety Organization for the food chain. |


Research Methodology
Mordor Intelligence follows a four-step methodology in all our reports.
- Step-1: Identify Key Variables: In order to build a robust forecasting methodology, the variables and factors identified in Step 1 are tested against available historical market numbers. Through an iterative process, the variables required for market forecast are set, and the model is built on the basis of these variables.
- Step-2: Build a Market Model: Market-size estimations for the forecast years are in nominal terms. Inflation is not a part of the pricing, and the average selling price (ASP) is kept constant throughout the forecast period for each country.
- Step-3: Validate and Finalize: In this important step, all market numbers, variables, and analyst calls are validated through an extensive network of primary research experts from the market studied. The respondents are selected across levels and functions to generate a holistic picture of the market studied.
- Step-4: Research Outputs: Syndicated Reports, Custom Consulting Assignments, Databases & Subscription Platforms


