
Market Overview
| Study Period | 2021 - 2031 |
|---|---|
| Forecast Data Period | 2026 - 2031 |
| Base Year Market Size (2025) | 6.43 Million tons |
| Market Volume (2026) | 6.78 Million tons |
| Market Volume (2031) | 8.87 Million tons |
| Growth Rate (2026 - 2031) | 5.51 % |
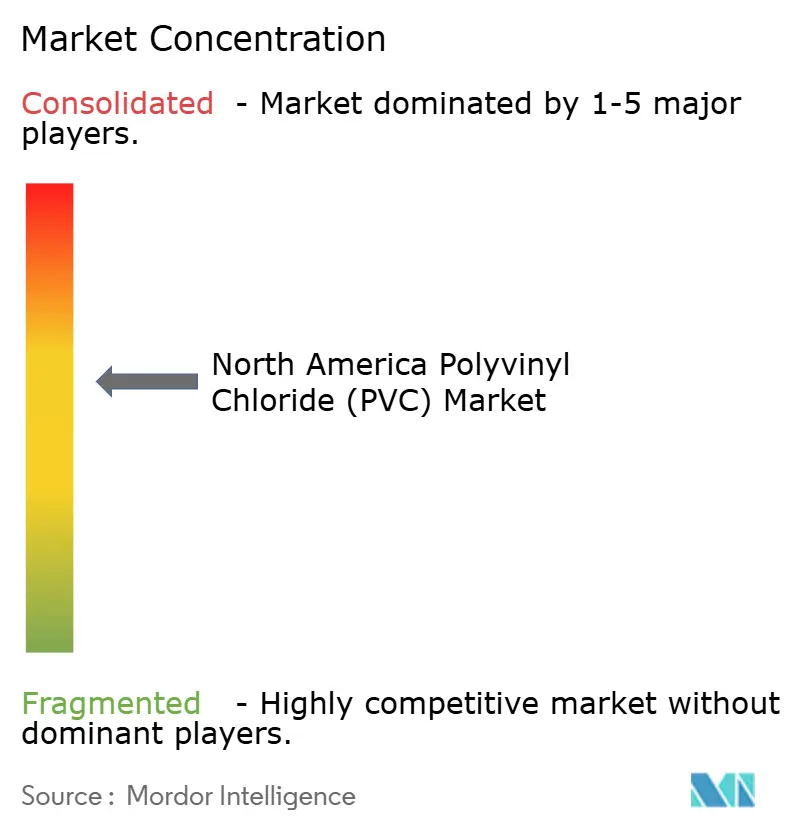
| Market Concentration | Medium |
Major Players *Disclaimer: Major Players sorted in no particular order Image © Mordor Intelligence. Reuse requires attribution under CC BY 4.0. | |
North America Polyvinyl Chloride (PVC) Market Analysis by Mordor Intelligence
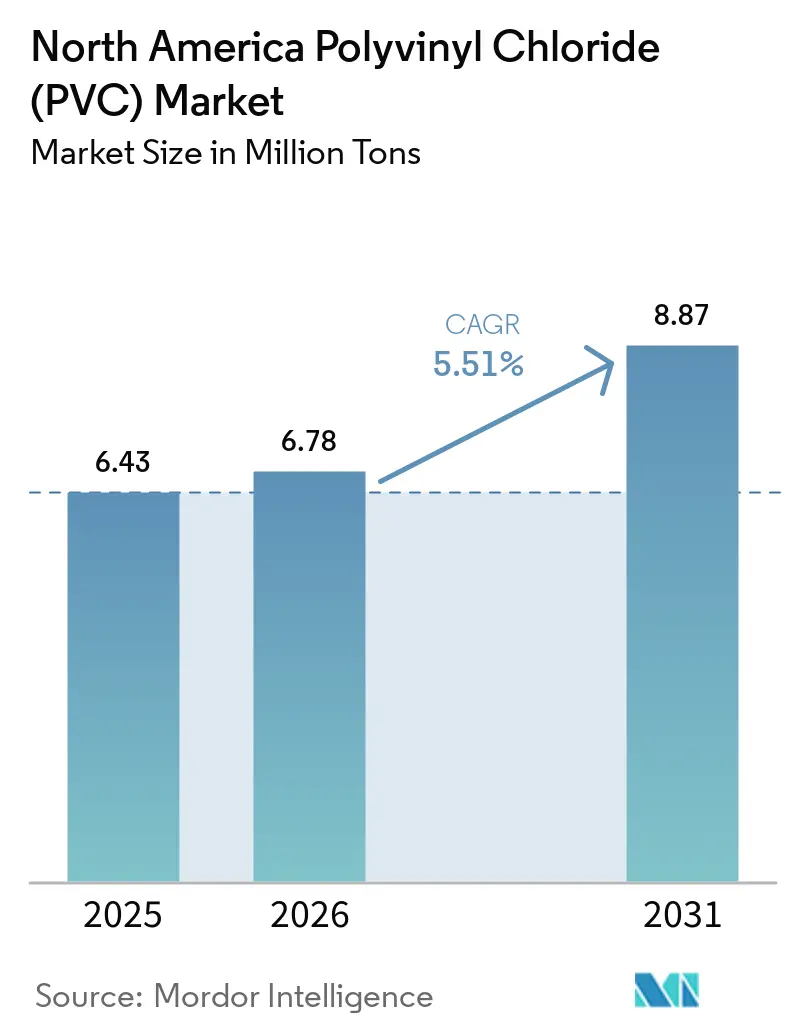
The North America Polyvinyl Chloride Market size is projected to expand from 6.43 Million tons in 2025 and 6.78 Million tons in 2026 to 8.87 Million tons by 2031, registering a CAGR of 5.51% between 2026 to 2031. Federal infrastructure funding, healthcare-related reshoring, and the adoption of bio-based plasticizers are jointly lifting demand even as environmental activism challenges chlorinated polymers. Government allocations for lead service-line replacement are pulling rigid pipe through procurement cycles that run at least until 2029, while FDA guidance on medical-grade polymers is unlocking premium tiers of flexible PVC. The United States' demand dominates because its municipal water networks and medical-device hubs dwarf regional peers. Producers with vertically integrated assets and AI-driven process control are trimming energy intensity, securing carbon-credit upside in California, and positioning for corporate sustainability mandates.
Key Report Takeaways
- By product type, rigid PVC led with 59.88% of the polyvinyl chloride market share in 2025, while flexible PVC is forecast to grow at a 5.82% CAGR through 2031.
- By application, Pipes and Fittings led with 45.71% of the polyvinyl chloride market share in 2025, while Profiles, Hoses, and Tubing are forecast to grow at a 5.63% CAGR through 2031.
- By end-user industry, building and construction commanded 59.66% of the polyvinyl chloride market share in 2025, while healthcare is projected to advance at a 6.12% CAGR to 2031.
- By geography, the United States accounted for 77.92% of the polyvinyl chloride market share in 2025 and is poised for a 5.93% CAGR through 2031.
Note: Market size and forecast figures in this report are generated using Mordor Intelligence’s proprietary estimation framework, updated with the latest available data and insights as of 2026.
North America Polyvinyl Chloride (PVC) Market Trends and Insights
Drivers Impact Analysis*
| Driver | (~) % Impact on CAGR Forecast | Geographic Relevance | Impact Timeline |
|---|---|---|---|
| Surging use in medical-grade devices and IV bags | +1.2% | United States, with concentration in Midwest and Southeast manufacturing hubs | Medium term (2-4 years) |
| Federal funding for replacement water infrastructure | +1.8% | United States, particularly states with aging municipal systems (Michigan, Pennsylvania, Ohio) | Long term (≥ 4 years) |
| Regulatory tailwinds for lead-free plumbing | +0.9% | United States and Canada, driven by EPA and Health Canada mandates | Medium term (2-4 years) |
| Bio-based plasticizers unlocking premium niches | +0.7% | North America, with early adoption in consumer-facing packaging and medical applications | Short term (≤ 2 years) |
| AI-optimized PVC production lowering carbon intensity | +0.5% | United States and Canada, concentrated in facilities with digital infrastructure | Long term (≥ 4 years) |
| Source: Mordor Intelligence | |||


Surging Use in Medical-Grade Devices and IV Bags
Healthcare’s pivot toward single-use disposables is reshoring flexible PVC that had migrated offshore during the 2010s. The medical plastics segment reached USD 577.66 billion in 2024 and will grow 10.2% annually to 2030, with PVC specified for IV units, tubing, blood bags, and syringes. FDA guidance issued in 2024 triggered investments in ultra-clean resin lines that meet ISO 10993, creating a domestic premium tier that commands 15-20% price uplifts[1]U.S. Food and Drug Administration, “Medical Device Supply Chain Resilience,” fda.gov. These volumes decouple healthcare PVC from housing cycles, sustaining demand even when residential starts dip. An aging population and chronic disease prevalence keep dialysis equipment and infusion sets on a steady growth curve. CPSC reaffirmation of phthalate limits in 2024 accelerated the switch to bio-based plasticizers in pediatric devices, reinforcing the segment’s premium positioning.
Federal Funding for Replacement Water Infrastructure
The EPA earmarked USD 15 billion under the Bipartisan Infrastructure Law for lead service-line replacement, with another USD 35 billion flowing through the Drinking Water State Revolving Fund. States with large inventories of lead pipe face statutory obligation windows, compressing procurement cycles and elevating suppliers holding NSF/ANSI 14 certifications. PVC pipe averages 30–40% lower cost per linear foot than ductile iron, making it the default choice for cash-constrained utilities. Regional demand spikes in Michigan, Ohio, and Pennsylvania favor producers with nearby capacity. While polyethylene advocates court regulators, PVC’s entrenched qualification base preserves share for the forecast horizon.
Regulatory Tailwinds for Lead-Free Plumbing
The EPA’s Lead and Copper Rule Improvements and Health Canada’s 2025 Plumbing Fittings Regulation cut allowable lead content in wetted surfaces to 0.25%. Because PVC is inherently lead-free, specifiers avoid the compliance risk present with metallic alternatives. LEED v4.1 and the WELL Building Standard now award points for lead-free plumbing, reinforcing uptake in commercial construction. In states like California and New York, where green-building incentives stack on federal mandates, PVC’s regulatory advantage widens. Municipalities pursuing accelerated replacement schedules further cement PVC’s positioning in potable-water systems.
Bio-Based Plasticizers Unlocking Premium Niches
Vegetable oil and citrate-derived plasticizers fetch 20–30% premiums but gain share wherever “phthalate-free” claims support brand positioning. The CPSC bans eight phthalates in children’s products, and the FDA is reevaluating DEHP in medical devices, guiding converters toward bio-based alternatives. Early adopters are resolving migration and low-temperature flexibility issues, opening avenues in medical tubing, food-contact films, and premium flooring. Long-term feedstock contracts with agricultural suppliers hedge volatility, allowing formulators to protect margins while marketing sustainability credentials.
Restraints Impact Analysis*
| Restraint | (~) % Impact on CAGR Forecast | Geographic Relevance | Impact Timeline |
|---|---|---|---|
| Intensifying environmental and health scrutiny | -0.8% | North America, with intensity in California, New York, and Canadian provinces | Medium term (2-4 years) |
| Tightening limits on phthalate plasticizers | -0.6% | United States and Canada, driven by CPSC and Health Canada regulations | Short term (≤ 2 years) |
| Upcoming PFAS-style scrutiny on chlorinated polymers | -0.5% | United States, with potential spill-over to Canada and Mexico | Long term (≥ 4 years) |
| Source: Mordor Intelligence | |||
Intensifying Environmental and Health Scrutiny
Activist campaigns have persuaded several California water districts to adopt “PVC-free” policies despite decades of safe service and NSF certification[2]National Sanitation Foundation, “NSF/ANSI 14: Plastics Piping System Components,” nsf.org . Media focus on microplastics in drinking water and “forever chemical” narratives blur distinctions between PVC and PFAS, swaying procurement in politically sensitive regions. Automotive OEMs in Europe are specifying halogen-free wire insulation to meet End-of-Life Vehicle mandates, and North American plants on global platforms are following suit. Reputational risk, rather than technical deficiency, is steering some bids toward polyethylene, forcing PVC advocates to amplify lifecycle-assessment data.
Tightening Limits on Phthalate Plasticizers
The CPSC’s 2024 prohibition of eight phthalates and the FDA’s ongoing DEHP risk review require costly reformulation of legacy flexible PVC. Smaller converters lacking R&D bandwidth face margin compression or market exit, consolidating share with vertically integrated majors. EPA TSCA evaluations flag unreasonable occupational exposure risks for DIDP and DINP, foreshadowing additional curbs. Investor caution surrounding potential phase-outs is delaying capital additions in flexible-PVC capacity, tempering near-term expansion.
*Our forecasts treat driver/restraint impacts as directional, not additive. The impact forecasts reflect baseline growth, mix effects, and variable interactions.
Segment Analysis
By Product Type: Rigid Dominance Masks Flexible’s Healthcare Surge
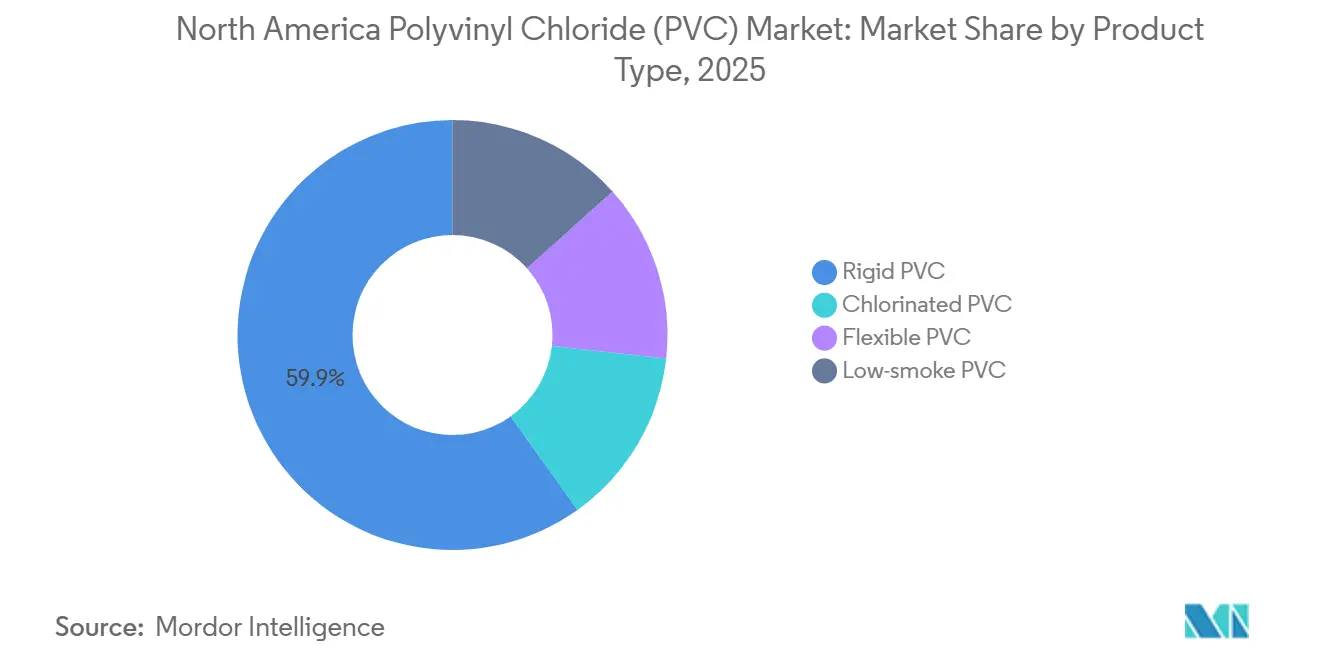
Rigid PVC captured 59.88% of 2025 tonnage, anchoring the polyvinyl chloride market in water pipe, conduit, and window profiles. Flexible PVC, however, is poised for a 5.82% CAGR to 2031 on the strength of medical disposables and phthalate-compliant formulations. Within the polyvinyl chloride market size, clear rigid grades serve pressure pipe certified under NSF/ANSI 14, while non-clear rigid dominates DWV and conduit.
Flexible PVC’s higher growth rate reflects its compatibility with bio-based plasticizers and premium healthcare niches. Clear flexible grades are standard in IV bags and transparent tubing that require fluid-flow visibility. Non-clear flexible remains integral in wire jacketing and industrial hoses, and low-smoke PVC grades are mandated for tunnels and high-rise applications under NFPA 262. CPVC extends into hot-water distribution where 200 °F ratings eclipse standard PVC. Diversified producers spanning rigid and flexible variants are best placed to capture the polyvinyl chloride market’s bifurcating opportunity set.


By Application: Pipes Anchor Volume, Profiles Capture Growth
Pipes and fittings accounted for 45.71% of 2025 consumption, anchoring the polyvinyl chloride market share on infrastructure programs. Profiles, hoses, and tubing will grow at a 5.63% CAGR through 2031, paced by window-frame retrofits, industrial hoses, and medical tubing. Films and sheets retain relevance in medical drapes and geomembranes despite substitution to polyolefins in commodity packaging.
Wire and cable demand bifurcates between commodity building wire and specialty automotive harnesses. Bottles now occupy niche chemical-packaging slots after mainstream beverage migration to PET and HDPE. Short-cycle applications such as profiles and hoses deliver faster asset turns and margin potential than long-cycle pipe, yet they expose converters to economic swings.
By End-user Industry: Construction’s Scale, Healthcare’s Velocity
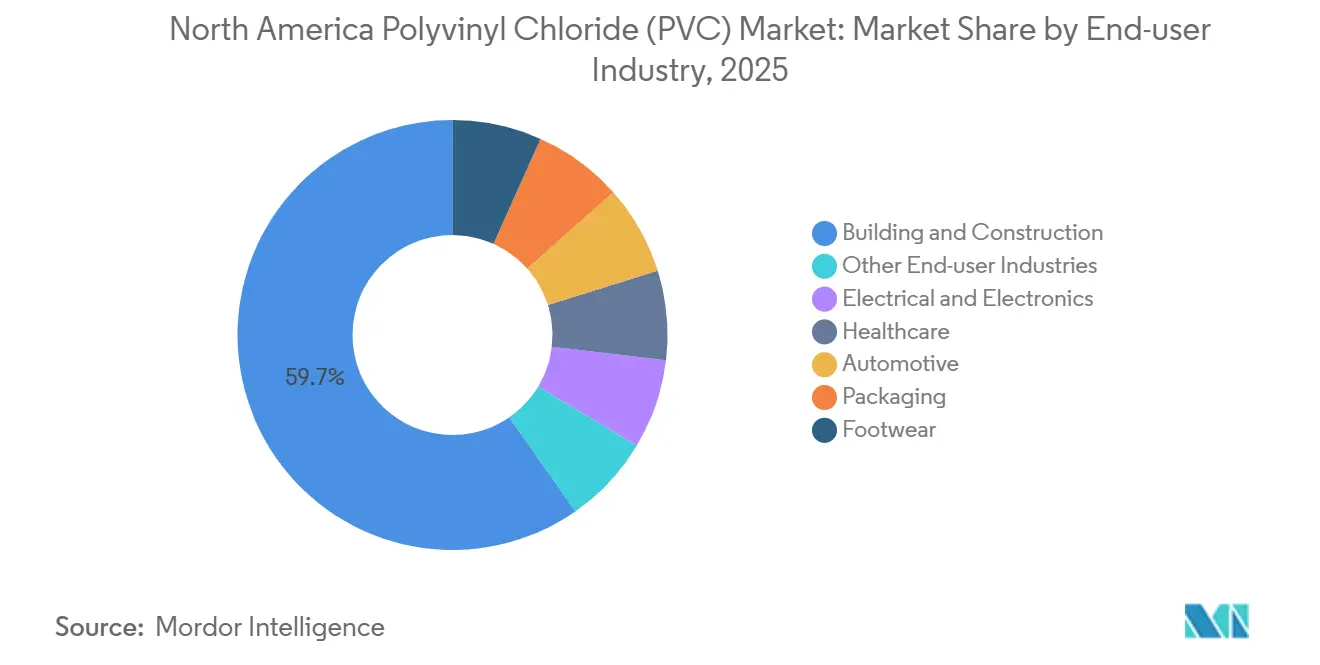
Building and construction used 59.66% of 2025 tonnage, leveraging PVC’s 30–40% cost advantage over copper and ductile iron. LEED v4.1 credits for lead-free systems and recycled content reinforce the specification. However, cyclical housing and interest-rate sensitivity cap upside. Healthcare volumes will grow at a 6.12% CAGR through 2031, making it the fastest-expanding end-user industry within the polyvinyl chloride market.
Medical-grade PVC earns 15–20% premiums, and FDA supply-chain guidance spurs investment in ISO 10993-compliant lines. Electrical and electronics rely on PVC conduit and junction boxes but face halogen-free substitution in data centers and EVs. Automotive volumes rise in wire harnesses yet risk displacement by cross-linked polyethylene. Packaging, footwear, and other outlets hold residual shares, with vinyl footwear thriving in abrasion-resistant niches.
Geography Analysis
The United States controlled 77.92% of 2025 volume and will grow at a 5.93% CAGR through 2031, underpinned by its vast municipal water networks and medical-device clusters. The US polyvinyl chloride market benefits from EPA infrastructure that grants funnel disproportionately to Midwest states, rewarding producers with proximate assets. Vertical integration, from chlor-alkali to compounding, creates switching costs that insulate U.S. suppliers from low-priced imports.
Canada’s smaller population constrains absolute tonnage, yet regulatory alignment with U.S. standards eases cross-border trade. Health Canada’s 0.25% lead limit for plumbing fittings harmonizes with EPA rules, enabling producers to leverage common product listings. The country’s demand centers on renovation of older housing stock and municipal pipe replacements in Ontario and Quebec.
Mexico benefits from USMCA tariff-shift provisions that make cross-border supply chains attractive for commodity rigid pipe. Domestic capacity has inched upward, but the nation remains a net PVC importer serving local construction and automotive plants. Producers operating on both sides of the border can arbitrage labor and energy cost differentials while meeting U.S. compliance demands for medical-grade imports.
Regulatory Landscape
PVC production and upstream vinyl chloride monomer (VCM) handling in North America are covered by air-emissions, worker-safety, and chemicals-management frameworks. In the United States, the EPA regulates PVC and copolymers production under Clean Air Act National Emission Standards for Hazardous Air Pollutants (NESHAP), while OSHA limits occupational exposure to vinyl chloride under 29 CFR 1910.1017 (permissible exposure limit of 1 ppm as an 8-hour time-weighted average). Under TSCA, EPA designated vinyl chloride as a high-priority substance for risk evaluation in December 2024 and published a draft scope in January 2025, increasing compliance attention across resin producers and VCM-integrated sites.
In Canada, vinyl chloride is listed as a toxic substance under the Canadian Environmental Protection Act (CEPA) 1999 (Schedule 1), with management implemented through federal and provincial controls and codes of practice affecting plastics and rubber operations. Plumbing-system requirements in the United States and Canada also continue to favor lead-free materials in potable-water applications, keeping product standards and commonly specified listings in focus for utilities and building codes. Overall, these frameworks raise the cost and complexity of operating non-integrated or older assets while reinforcing barriers to entry for new PVC capacity.
Value Chain Analysis
The North America PVC value chain starts with feedstocks (ethylene and chlorine) produced via steam cracking and chlor-alkali operations, followed by vinyl chloride monomer synthesis and polymerization into PVC resins (suspension, bulk, and specialty grades). Vertical integration matters because it stabilizes exposure to ethylene, chlorine, and power costs, and it supports tighter control of emissions compliance across VCM and PVC units. Recent moves reflect this structure, including Shintech (Shin-Etsu) announcing a USD 3.4 billion investment in Louisiana in March 2026 covering a second ethylene unit plus additional chlor-alkali and VCM capacity, and Westlake rationalizing older suspension PVC capacity through the shutdown of its Aberdeen, Mississippi plant.
Downstream, PVC resin is processed by compounders and additive suppliers (stabilizers, impact modifiers, processing aids, and plasticizers including bio-based options) to produce pipe and fittings, profiles, wire and cable compounds, films and sheets, and medical tubing and bags. Distribution typically combines direct sales to large converters with networks of regional distributors that support municipal infrastructure and construction channels, where certifications and listings are often required for bid eligibility. Trade associations such as the Vinyl Institute, Uni-Bell PVC Pipe Association, and the PVC Pipe Association also influence specifications, testing practices, and advocacy, affecting how resin producers and converters position products in regulated end markets such as potable water and healthcare.
Competitive Landscape
Five producers, Westlake, Formosa Plastics, Orbia, Shin-Etsu, and Occidental, hold about 60–65% of regional capacity, indicating moderate concentration. Capacity expansions continue: Westlake’s Lake Charles build-out added 250,000 t/y in 2024, trimming freight for Gulf Coast converters. INEOS upgraded Chocolate Bayou with machine-learning controls that cut energy use 10%, lowering Scope 1 emissions by 25,000 t/y.
Formosa secured a 10-year, USD 300 million contract with a Midwestern water utility, reflecting the value of NSF-certified pipe and established distributor networks. Shin-Etsu partnered on bio-plasticizer compounds to penetrate phthalate-free healthcare niches. Orbia’s low-smoke PVC addresses data-center cable codes, while Braskem’s Brazilian expansion targets North American imports.
AI-driven process optimization is emerging as a quiet differentiator, improving yields and reducing off-spec volumes. Yet disclosures are scarce, suggesting strategic sensitivity. The Vinyl Institute’s lifecycle-assessment tools help counter environmental scrutiny, but adoption varies. Substitution threats, polyethylene in water pipe, halogen-free compounds in automotive, define the competitive frontier more than new PVC entrants.
North America Polyvinyl Chloride (PVC) Industry Leaders
Westlake Corporation
Shin-Etsu Chemical Co., Ltd.
Formosa Plastics Corporation
Occidental Petroleum Corporation
Orbia
- *Disclaimer: Major Players sorted in no particular order

Market Opportunities and Future Outlook
A key whitespace area is higher-specification PVC supply aligned to infrastructure procurement and compliance-heavy applications, where qualification and documentation create switching costs. The EPA earmark of USD 15 billion under the Bipartisan Infrastructure Law for lead service-line replacement, alongside ongoing Drinking Water State Revolving Fund flows, sustains pipes and fittings as a large outlet for rigid PVC, while increasing demand for suppliers that can support utilities with certified products and dependable regional logistics. At the same time, healthcare reshoring and the 2024 FDA supply-chain guidance on medical devices continue to support demand for ultra-clean, ISO 10993-oriented resin and compound supply, which supports premium pricing for flexible PVC when paired with phthalate-compliant or bio-based plasticizer systems.
On the supply side, investment patterns point to opportunities in integrated, lower-emissions manufacturing footprints and decarbonization-oriented process upgrades. Shintechs March 2026 announcement of a USD 3.4 billion Louisiana expansion (ethylene, chlor-alkali, and VCM) highlights continued focus on large, integrated hubs designed to compete on cost and compliance. Industry decarbonization roadmaps that emphasize energy efficiency, electrification, and fuel switching also create room for differentiated resin with lower operational carbon intensity, especially as buyers and public procurement programs scrutinize emissions attributes alongside performance and cost requirements.
Recent Industry Developments
- June 2026: Westlake Corporation completed the acquisition of a PVC and VCM production site in Wilhelmshaven, Germany, adding 380,000 metric tons per year of PVC capacity. The transaction expands Westlakes chlorovinyl footprint and can influence North American trade flows by providing an additional integrated supply base for global customers and product balancing.
- December 2025: Westlake Corporation announced the closure of its suspension PVC resin plant in Aberdeen, Mississippi, with approximately 1 billion pounds of annual capacity, as part of a broader chlorovinyl asset rationalization. The move shifts supply emphasis toward Westlakes remaining integrated North American facilities, tightening the linkage between resin availability and Gulf Coast production economics.
- July 2024: Formosa Plastics Corporation, U.S.A. announced a major expansion of its PVC resin plant in Baton Rouge, Louisiana. The project reinforces Louisianas role as a regional PVC production hub and supports scale advantages for converters sourcing resin for pipes, profiles, and other construction-intensive applications.


Research Methodology Framework and Report Scope
Market Definition and Coverage
For this study, the market includes polyvinyl chloride (PVC) resin demand within North America, measured as the volume of PVC consumed across key applications and end uses during the year.
Scope exclusions: PVC downstream finished products are not counted as separate market value, and adjacent polymers or vinyl products outside PVC resin are excluded.
Segmentation Overview
- By Product Type
- Rigid PVC
- Clear Rigid PVC
- Non-clear Rigid PVC
- Flexible PVC
- Clear Flexible PVC
- Non-clear Flexible PVC
- Low-smoke PVC
- Chlorinated PVC
- Rigid PVC
- By Application
- Pipes and Fittings
- Films and Sheets
- Wires and Cables
- Bottles
- Profiles, Hoses and Tubing
- Other Applications
- By End-user Industry
- Building and Construction
- Electrical and Electronics
- Healthcare
- Automotive
- Packaging
- Footwear
- Other End-user Industries
- By Country
- United States
- Canada
- Mexico
Data Sources, Market Sizing, and Validation
Desk Research
Desk research was used to set the factual base for the model, especially around production, trade direction, and end use pull for PVC in the United States, Canada, and Mexico. We referred to public sources such as USITC trade statistics, US Census Bureau construction spending releases, Statistics Canada industrial and trade tables, and Mexico INEGI industrial indicators to understand the demand environment.
To keep assumptions realistic, the narrative was cross-checked using sources such as industry association publications, building code and infrastructure program disclosures, company annual reports and investor presentations, and reputable press coverage of capacity additions and outages. We also used paid subscriptions for company financials and intelligence, shipment-level trade views, and patent databases to validate select signals like expansion timing and product positioning. The desk sources listed here are illustrative only, and many other public documents were also used for data collection, validation, and clarification.
Primary Interviews and Surveys
Primary work focused on validating what actually drives PVC consumption in North America, and then pressure testing our key inputs before finalizing totals. We spoke with a mix of resin and compound supply-side participants, distributors, converters, and downstream buyers in construction, electrical, and healthcare so gaps from secondary reading could be closed and assumptions could be triangulated across the region.
Distribution of primary research fieldwork respondents
| Company type | Respondent position |
|---|---|
| Top tier: 36% | CXOs: 14% |
| Mid tier: 50% | Functional/Unit leaders: 32% |
| Smaller Players: 14% | Managers: 54% |
Market-Sizing & Forecasting
Sizing was built using a mix of top-down and bottom-up logic. On the top-down side, we reconstructed the North America demand pools by application and then reconciled the result back to production and net trade reality. Put simply, once end-use activity signals were mapped to PVC intensity of use, the total volume outcome was calculated.
Key inputs used in the model included construction and infrastructure activity, pipe and profile demand momentum, housing and renovation indicators, conversion capacity and utilization signals, and trade flows that change regional availability. Pricing was not used as the primary sizing unit since the report market size is in tons, but price direction was still reviewed to sanity check whether volume growth assumptions were realistic given macro conditions.
For forecasting, scenario analysis was applied. In the base case, demand follows the most consistent activity indicators, while upside or downside cases reflect changes in construction momentum, regulatory pressure on chlorinated polymers, and capacity additions. Bottom-up checks were then used selectively, such as sampling converter throughput, reviewing supplier commentary on volumes, and validating application shares through channel checks. Where gaps remained, we used conservative adoption ranges agreed during interviews.
Data Validation & Update Cycle
Outputs were validated through multiple checks so unusual jumps could be explained before sign-off. We compared the modeled tons by country and application against independent signals such as trade patterns, capacity change announcements, and observable demand trends in construction and electrical uses, and then reviewed variances that looked out of line.
Where inconsistencies appeared, follow-up outreach was triggered and assumptions were adjusted only after at least two independent confirmations were obtained. Reports are refreshed annually, with interim updates when material events occur such as large capacity shifts, trade disruptions, or sharp demand swings. Before delivery, the latest public releases are rechecked so clients receive an updated view for the stated base year and forecast window.
Mordor Intelligence's North America Polyvinyl Chloride Pvc Market Estimate Compared With Other Published Estimates
Different published estimates for the North America PVC market can look far apart because the measurement unit, the counted scope, and the pricing logic are not always aligned. Some sources report revenue, others report volume, and even within revenue-based views, the chosen price point and whether compounding or downstream conversion value is included can shift the total.
The table highlights that one common gap comes from mixing resin volume logic with downstream product value, which can inflate the number when pipes, profiles, and other converted goods are counted on top of resin demand. Another driver is year alignment and currency approach, since average annual prices and conversion from local currencies can change the reported USD value even when underlying tons move slowly.
Benchmark comparison
| Source | Market Size | Gaps in Research Methodology |
|---|---|---|
| Mordor Intelligence | USD 6.43 M (2025) | |
| Industry Publisher A | USD 13.61 B (2024) | Reported in USD revenue and likely reflects value chain pricing choices that can include downstream conversion value or different price assumptions, which makes it hard to reconcile directly to resin demand in tons. |
| Regional Publisher B | USD 7.64 B (2024) | Uses a revenue lens with a 2024 base year, and the estimate can move depending on the assumed average resin price, the treatment of imports versus domestic sales, and whether the model blends in compound or formulation value. |
The table shows that the biggest spread is explained by unit and scope choices. In Mordor Intelligence's model, the headline market size is anchored to PVC resin demand volume for North America rather than a revenue roll-up that may layer in converter margins or finished goods value. When the same market boundary, year, and unit are matched, the remaining differences usually come down to price timing, application share assumptions, and how trade flows are translated into apparent consumption.


Key Questions Answered in the Report
What is the size of the North America Polyvinyl Chloride (PVC) market?
The North America Polyvinyl Chloride (PVC) market size stands at 6.78 million tons in 2026 and is forecast to reach 8.87 million tons by 2031, growing at a 5.51% CAGR from 2026.
Which PVC product type is expanding fastest through 2031?
Flexible PVC is projected to rise at a 5.82% CAGR through 2031, fueled by healthcare tubing and phthalate-free formulations.
What drives PVC pipe demand in the United States?
USD 15 billion in federal funds for lead service-line replacement and 30–40% cost savings over ductile iron keep rigid PVC pipe at the center of municipal procurement.
Why is healthcare a strategic segment for PVC suppliers?
Medical-grade PVC commands 15–20% price premiums and grows 6.12% through 2031due to an aging population and supply-chain reshoring incentives.
Page last updated on:





