Market Overview
| Study Period | 2020 - 2031 |
|---|---|
| Forecast Data Period | 2026 - 2031 |
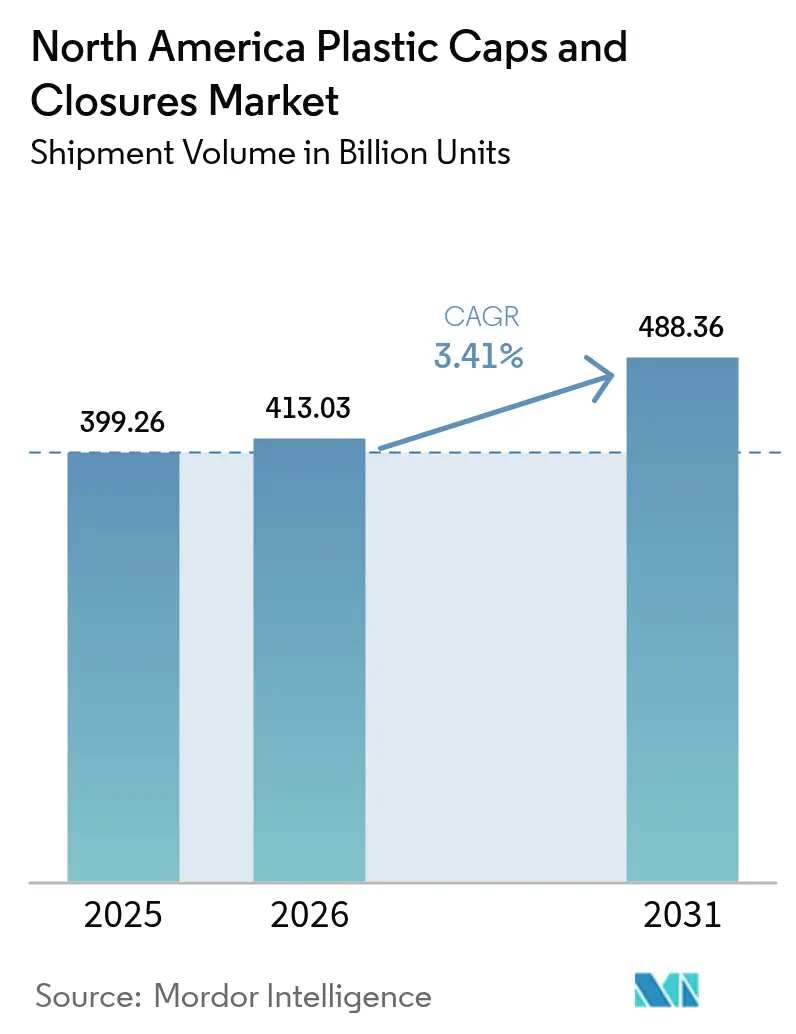
| Base Year Market Size (2025) | 399.26 Billion units |
| Market Volume (2026) | 413.03 Billion units |
| Market Volume (2031) | 488.36 Billion units |
| Growth Rate (2026 - 2031) | 3.41% CAGR |
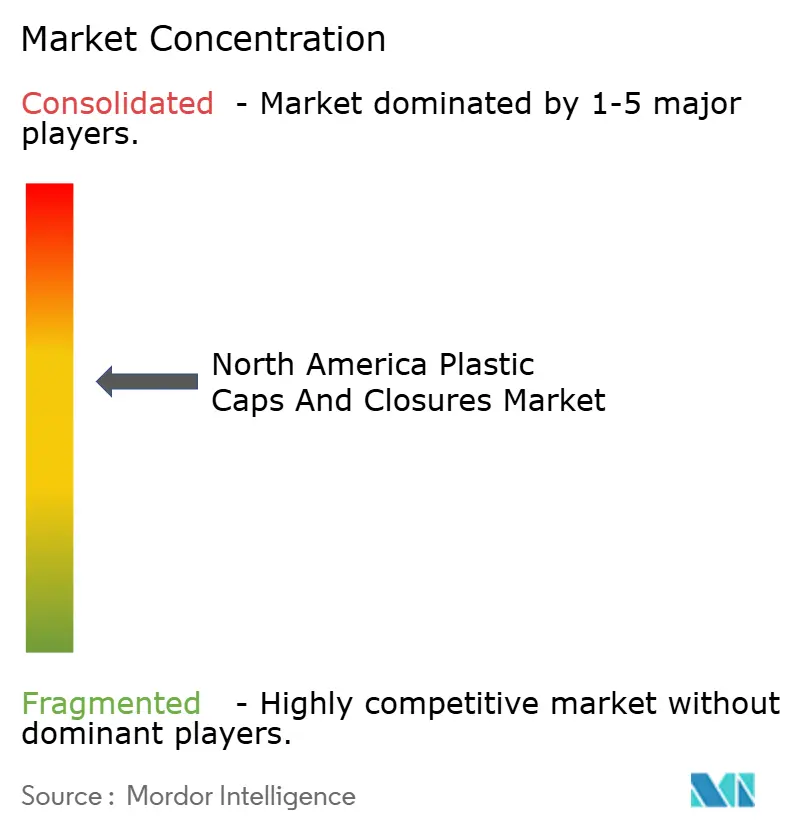
| Market Concentration | Medium |
Major Players *Disclaimer: Major Players sorted in no particular order Image © Mordor Intelligence. Reuse requires attribution under CC BY 4.0. | |
North America Plastic Caps And Closures Market Analysis by Mordor Intelligence
The North America plastic caps and closures market size is projected to expand from 399.26 billion units in 2025 and 413.03 billion units in 2026 to 488.36 billion units by 2031, registering a CAGR of 3.41% between 2026 and 2031. Beverage portfolios are pivoting toward polypropylene mono-material designs that accommodate California’s 50% recycled-content mandate, while child-resistant formats for online pharmaceutical shipments are scaling at nearly double the market baseline. Extended Producer Responsibility (EPR) fees of USD 0.02-0.04 per virgin-resin closure in nine U.S. states and four Canadian provinces are pressuring converter margins, intensifying procurement races for post-consumer recyclate. Compression molding retains cost leadership because new presses now cycle in sub-3 seconds for standard 28-millimeter beverage closures, while 3-D printing is being adopted for tethered-hinge prototypes ahead of California’s proposed 2027 tethered-cap rule. Competitive audits by brand owners now score suppliers on recycled-content percentage, carbon footprint per thousand units, and end-of-life recyclability, reshaping contract awards across the North America plastic caps and closures market.
Key Report Takeaways
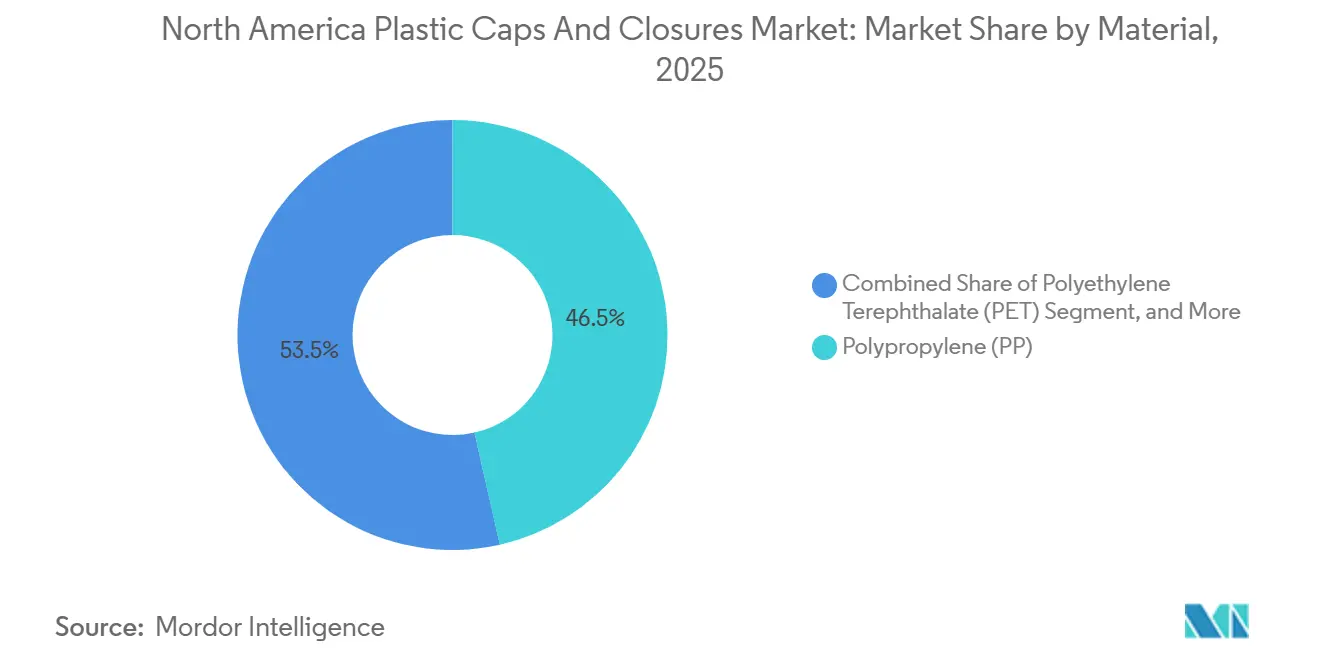
- By material, polypropylene held 46.47% of the North America plastic caps and closures market share in 2025, whereas polyethylene terephthalate closures are forecast to grow at a 4.31% CAGR through 2031.
- By type, threaded closures led the North America plastic caps and closures market with 48.83% of the market share in 2025, while child-resistant formats are projected to grow at 4.02% over 2026–2031.
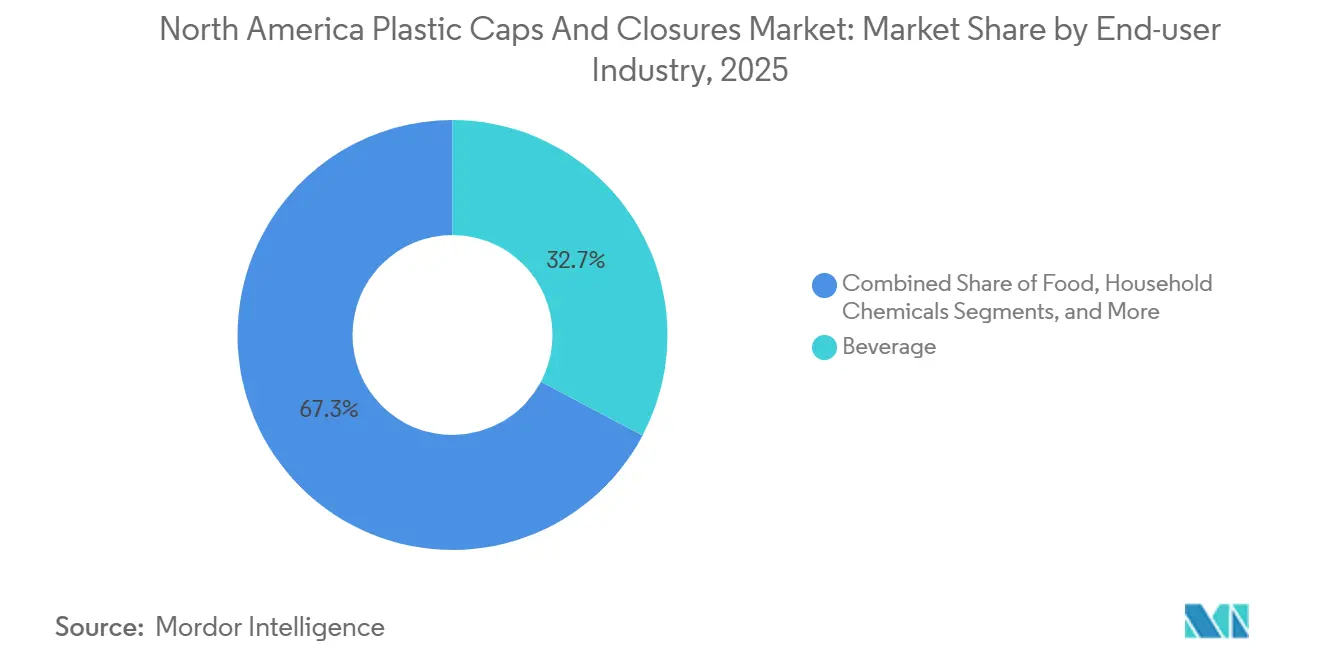
- By end-user, beverages commanded 32.74% of 2025 demand, whereas pharmaceutical and healthcare closures are pacing ahead at a 3.86% CAGR to 2031.
- By process, compression molding accounted for 53.81% of 2025 shipments, but 3-D printing for rapid prototyping is expanding at 3.66% annually.
- By geography, the United States represented 70.92% of 2025 volume, and Mexico is the fastest-growing country at 6.33% through 2031.
Note: Market size and forecast figures in this report are generated using Mordor Intelligence’s proprietary estimation framework, updated with the latest available data and insights as of 2026.
North America Plastic Caps And Closures Market Trends and Insights
Drivers Impact Analysis*
| Driver | (~) % Impact on CAGR Forecast | Geographic Relevance | Impact Timeline |
|---|---|---|---|
| Demand Surge for Bottled and Functional Beverages | +0.8% | United States and Canada, with spillover to Mexico urban centers | Medium term (2-4 years) |
| Brand-owner Push for Tethered and E-commerce-ready Closures | +0.6% | United States (California, Oregon, Washington), Canada (British Columbia, Quebec) | Long term (≥ 4 years) |
| Shift Toward PP Mono-material Caps for Easier Recycling | +0.5% | North America, with early adoption in California and Northeast US states | Medium term (2-4 years) |
| On-line Pharma and Nutraceutical Boom Fuels CRC Demand | +0.7% | United States and Canada, concentrated in metropolitan e-commerce fulfillment zones | Short term (≤ 2 years) |
| AI-enabled In-line Vision Lowers Defect Rates and Costs | +0.3% | United States and Mexico manufacturing corridors | Medium term (2-4 years) |
| Smart Caps with Embedded NFC and QR Authentication | +0.2% | United States (spirits and pharmaceutical segments), Canada (cannabis edibles) | Long term (≥ 4 years) |
| Source: Mordor Intelligence | |||


Demand Surge for Bottled and Functional Beverages
Functional beverage launches jumped 23% year-over-year in 2025, accelerating demand for tamper-evident 28- and 38-millimeter closures that hold 15 psi seal integrity.[1]Beverage Industry Magazine, “Functional Beverage Launches Surge 23% in 2025,” bevindustry.com Single-serve bottled water now captures 62% of category sales, pushing brands to specify lighter closures that trim material costs by USD 0.003 each. Sports-nutrition players are standardizing flip-top dispensers with silicone check valves that prevent backflow contamination. In the United States, per-capita intake of enhanced water climbed to 14.7 gallons in 2025, more than 50% higher than Canada, highlighting the country’s outsized pull on closure volumes. The convergence of portability preferences and health-centric product launches keeps beverages at the core of the North America plastic caps and closures market.
On-line Pharma and Nutraceutical Boom Fuels CRC Demand
U.S. online pharmacy revenue reached USD 92 billion in 2025, channeling 38% of prescription bottles through mail order fulfillment.[2]National Association of Boards of Pharmacy, “Online Pharmacy Sales Growth,” nabp.pharmacy The Poison Prevention Packaging Act requires child-resistant closures, and nutraceutical sellers now apply senior-friendly squeeze-and-turn designs that meet ASTM D3475 Protocol E, improving adult-opening success to 85% while retaining child safety. AptarGroup recorded a 22% lift in pharmaceutical closure shipments in Q3 2025 as GLP-1 drug packaging volumes surged. Growth clusters in Florida, Arizona, and California, where aging populations intersect with broadband penetration, underpin near-term upside. These dynamics reinforce the premium positioning of child-resistant offerings within the North America plastic caps and closures market.
Brand-Owner Push for Tethered and E-commerce-Ready Closures
California’s proposed SB 45 mandates tethered caps by 2027, mirroring Europe’s Single-Use Plastics Directive. Coca-Cola and PepsiCo pledged in January 2025 to migrate 80% of U.S. bottled water and carbonated soft drink portfolios to hinged-tether closures by December 2026. E-commerce leakage studies show torque-optimized closures cut parcel failure rates from 2.1% to 0.4%, a critical metric as beverage e-tail volumes grew 19% in 2025. Oregon beach cleanup data indicate 34% fewer loose caps where tethered formats are prevalent. High tooling costs, ranging from USD 45,000–80,000 per cavity, tighten supplier pools and sharpen differentiation in the North America plastic caps and closures market.
Shift Toward PP Mono-Material Caps for Easier Recycling
California’s SB 1013 stipulates that beverage containers contain 50% recycled content by 2030 and explicitly covers closures. Mono-material polypropylene eliminates the traditional PE liner, but maintaining hermetic seals demands sub-0.05 mm molding tolerances. Guala Closures validated an all-PP spirits cap that kept oxygen ingress below 0.3 cc/day over 12-month aging tests. Recycled PP trades at a USD 150-200 per-ton premium over virgin, incentivizing converters to lock multi-year contracts. Brand audits now reference ISO 14021 self-declaration standards, deterring greenwashing and accelerating the mono-material shift across the North America plastic caps and closures market.
Restraints Impact Analysis*
| Restraint | (~) % Impact on CAGR Forecast | Geographic Relevance | Impact Timeline |
|---|---|---|---|
| Extended Producer Responsibility Fees on Virgin Resin | -0.4% | United States (California, Maine, Oregon, Colorado), Canada (British Columbia, Quebec) | Short term (≤ 2 years) |
| Rise of Stand-up Pouches with Fitments Replacing Screw Caps | -0.3% | United States and Canada, concentrated in sauces, beverages, and household chemicals | Medium term (2-4 years) |
| US and Canada rPET Content Mandates Squeeze Virgin PP Demand | -0.2% | United States (California, Washington), Canada (federal mandate) | Long term (≥ 4 years) |
| Beverage Brand Trials of Aluminium Crown Re-seals | -0.1% | United States craft beer and premium spirits segments | Long term (≥ 4 years) |
| Source: Mordor Intelligence | |||
Extended Producer Responsibility Fees on Virgin Resin
Since 2025, nine U.S. states and four Canadian provinces have levied EPR fees of USD 0.02–0.04 per virgin-resin closure to finance recycling upgrades.[3]Product Stewardship Institute, “Extended Producer Responsibility Programs in North America,” productstewardship.us Maine’s program waives fees for 100% recycled content, conferring a USD 80-120 per-ton cost edge, yet the North American supply of food-grade recycled PP meets just 56% of demand. British Columbia’s scheme adds USD 0.015 per unit to fund improvements to curbside collection. Fragmented statutes compel converters to juggle SKUs and inventory, raising overhead across the North America plastic caps and closures market.
Rise of Stand-Up Pouches with Fitments Replacing Screw Caps
Regional shipments of flexible stand-up pouches grew 11% in 2025, displacing rigid bottles in condiments and detergents. Pouches with spout fitments reduce transport weight by 85% and cut logistics costs by USD 0.12 per unit on cross-country lanes. Heinz and Unilever eliminated 120 million rigid closures after switching ketchup and detergent SKUs in 2024. Carbonated beverages remain insulated because pouch spouts cannot withstand 45 psi pressure, but still-drink categories will continue eroding closure volumes, tempering expansion of the North America plastic caps and closures market.
*Our forecasts treat driver/restraint impacts as directional, not additive. The impact forecasts reflect baseline growth, mix effects, and variable interactions.
Segment Analysis
By Material: PET Closures Gain as Mono-Material Mandates Tighten
Polyethylene terephthalate closures, although only 12% of 2025 shipments, are growing at 4.31% through 2031 as bottled-water producers convert to liner-free PET caps that improve recycling yields. Polypropylene still dominates with 46.47% share because its barrier properties keep oxygen ingress below 0.5 cc/day for carbonated drinks. California’s AB 793, which counts closures in recycled-content targets, has prompted Silgan to re-tool three Texas lines for recycled PET, adding 60 million units of annual capacity.
Converters that secure long-term contracts for food-grade recycled PET at USD 200-per-ton premiums are safeguarding supply. In contrast, Mexico remains 78% virgin PP, reflecting limited recycling infrastructure, although the 2025 National Recycling Strategy targets 30% recycled content by 2030. Material transitions therefore proceed unevenly across the North America plastic caps and closures market.


By Type: Child-Resistant Formats Outpace Threaded Standards
Threaded closures led with 48.83% of 2025 volume, vital for pressure retention in soft drinks. Child-resistant designs are advancing at 4.02%, aided by Health Canada’s torque threshold rules for cannabis edibles and U.S. e-pharmacy growth. Aptar’s squeeze-and-turn CRC raised adult-opening success to 92% without compromising child resistance, capturing early adopter interest.
Dispensing caps, 18% of shipments, are gaining popularity in sports beverages where flip-tops support one-hand use, particularly in Mexico, where single-serve sports drinks grow 14% annually. Unthreaded snap-on variants remain niche because leakage during e-commerce transit limits broader acceptance. These patterns underscore product-specific performance needs that sustain segment diversity within the North America plastic caps and closures market.
By End-User Industry: Pharmaceutical Closures Accelerate Past Beverage Baseline
Beverages accounted for 32.74% of 2025 units, but pharmaceutical and healthcare closures are rising by 3.86%, aided by a USD 92 billion U.S. online pharmacy sector. Bottled-water launches with electrolyte and adaptogenic claims lifted associated closure demand by 3.9% in 2025, whereas spirit brands are embedding NFC chips to deter counterfeits, expanding closure revenue per unit.
Food closures, 22% of volume, feel substitution pressure from flexible pouches. Cosmetics and toiletries account for 11% of shipments as airless pumps help preserve serum shelf life. Household chemicals lag at 2.8% CAGR due to concentrated formulas requiring fewer closures. The pharmaceutical upswing therefore offsets slower segments, stabilizing growth across the North America plastic caps and closures market.
By Manufacturing Process: Compression Molding Retains Speed Edge While 3-D Printing Scales Prototyping
Compression molding delivered 53.81% of 2025 output, favored for sub-3-second cycles that yield over 1,200 units per cavity per hour. Injection molding, 38% of volume, remains indispensable for complex child-resistant geometry. Hybrid systems that combine compression speed with injection versatility debuted in October 2025, targeting pharma converters that require dimensional accuracy under ISO 15378 certification.
Rapid prototyping via 3-D printing accounts for only 2% of shipments but is growing at 3.66% because design cycles have halved to 9 months. Brands accept the USD 2.50 prototype cost to avoid USD 100,000 steel-tool missteps. Mexican facilities stay 89% compression-molded, reflecting a focus on high-volume beverage caps for export. Process choice thus aligns with end-user demands within the North America plastic caps and closures market.
Geography Analysis
The United States generated 70.92% of 2025 shipments, underpinned by 44.7 gallons per capita beverage consumption and a USD 580 billion pharmaceutical sector. California converters produced 42% of their 2025 output with post-consumer resin, outpacing the 28% national average due to SB 1013 incentives. EPR fee mosaics inflate administrative overhead by up to USD 0.012 per unit. Nearshored Mexican imports delivered to Texas now undercut domestic prices by 8-12%, narrowing margins in the North America plastic caps and closures market.
Canada contributed 18% of regional volume and grew 3.5% in 2025, buoyed by child-resistant demand for cannabis edibles and British Columbia’s 75% collection mandate that lifted recycled-resin availability. Quebec achieved an 82% closure collection rate through deposit refunds, securing feedstock for local converters. Market concentration is higher than in the U.S.; the top four suppliers control 68% of Canadian volume versus 52% stateside.
Mexico, while only 11% of 2025 shipments, is expanding at 6.33% through 2031 on the back of USD 420 million in nearshoring investments. Silgan’s Monterrey plant opened in April 2025, adding 800 million units of beverage-closure capacity. Labor at USD 3.80 per hour enables landed prices 10–14% below U.S. production. Urban consumption in Mexico City, Guadalajara, and Monterrey is rising 9% annually, giving domestic demand a double-digit tailwind.
Competitive Landscape
Market concentration is moderate, the five largest suppliers-Silgan Holdings, Amcor, AptarGroup, Closure Systems International, and Berry Global-held a considerable share of the 2025 volume. Technology is the pivot point. Silgan invested in Texas PET reclamation to lock 25,000 tons of feedstock, while Amcor commercialized mono-material PP caps that maintain 3.8 volumes CO₂ for 12 months. AptarGroup filed 14 NFC-closure patents during 2024–2025, cementing smart-cap leadership.
White-space opportunities are emerging in senior-friendly child-resistant designs that balance ASTM D3475 compliance with arthritis-friendly ergonomics, a segment where incumbent suppliers have underinvested despite the US population aged 65-plus reaching 58 million in 2025. Mid-tier converters such as Phoenix Closures and Mold-Rite Plastics are adopting AI-enabled inspection to drive defect escape rates below 0.3%, winning zero-defect contracts from pharmaceutical buyers.
ISO 15378 has become table stakes; 62% of pharma bids required certification in 2025. Industry 4.0 upgrades costing USD 1.2–2.8 million per line are now differentiating suppliers by changeover speed and overall equipment effectiveness. These arms-race investments define the competitive tempo of the North America plastic caps and closures market.
North America Plastic Caps And Closures Industry Leaders
Silgan Holdings Inc.
Amcor PLC
Closure Systems International Inc.
AptarGroup Inc.
Trimas Corporation
- *Disclaimer: Major Players sorted in no particular order

Recent Industry Developments
- January 2026: Silgan Holdings completed a majority acquisition of a Monterrey compression-molding site, adding 1.2 billion units of annual beverage-closure capacity.
- December 2025: Amcor launched a mono-material PP closure for carbonated soft drinks that maintains carbonation above 3.8 volumes CO₂ for 12 months.
- November 2025: AptarGroup began a USD 45 million expansion of its Illinois plant, installing eight lines with inline NFC-chip insertion.
- October 2025: BERICAP opened a EUR 35 million (USD 38 million) Querétaro facility for tethered beverage closures.


North America Plastic Caps And Closures Market Report Scope
Plastic caps and closures are crucial in the packaging business. They are used to seal many containers, such as bottles, jars, and tubes. These closures serve various purposes, including keeping products fresh, avoiding leaking, ensuring tamper evidence, and making it easier for consumers to use the product. The study tracks the consumption trends of plastic-based caps and closures in North America. The study also considers the impact of various geopolitical scenarios on the market, key themes, and end-user industries-related demand cycles.
The North America Plastic Caps and Closures Market Report is Segmented by Material (Polyethylene, Polyethylene Terephthalate, Polypropylene, Other Materials), Type (Threaded, Dispensing, Unthreaded, Child-Resistant), End-user Industry (Beverage, Food, Pharmaceutical and Healthcare, Cosmetics and Toiletries, Household Chemicals, Other Industries), Manufacturing Process (Injection Molding, Compression Molding, 3-D Printing and Rapid Prototyping, Other Manufacturing Process), and Geography (United States, Canada, Mexico). The Market Forecasts are Provided in Terms of Volume (Units).
By Material
| Polyethylene (PE) |
| Polyethylene Terephthalate (PET) |
| Polypropylene (PP) |
| Other Materials |
By Type
| Threaded |
| Dispensing |
| Unthreaded |
| Child-Resistant |
By End-user Industry
| Beverage | Bottled Water |
| Soft Drinks | |
| Spirits | |
| Other Beverages | |
| Food | |
| Pharmaceutical and Healthcare | |
| Cosmetics and Toiletries | |
| Household Chemicals | |
| Other Industries |
By Manufacturing Process
| Injection Molding |
| Compression Molding |
| 3-D Printing / Rapid Prototyping |
| Other Manufacturing Process |
By Country
| United States |
| Canada |
| Mexico |
| By Material | Polyethylene (PE) | |
| Polyethylene Terephthalate (PET) | ||
| Polypropylene (PP) | ||
| Other Materials | ||
| By Type | Threaded | |
| Dispensing | ||
| Unthreaded | ||
| Child-Resistant | ||
| By End-user Industry | Beverage | Bottled Water |
| Soft Drinks | ||
| Spirits | ||
| Other Beverages | ||
| Food | ||
| Pharmaceutical and Healthcare | ||
| Cosmetics and Toiletries | ||
| Household Chemicals | ||
| Other Industries | ||
| By Manufacturing Process | Injection Molding | |
| Compression Molding | ||
| 3-D Printing / Rapid Prototyping | ||
| Other Manufacturing Process | ||
| By Country | United States | |
| Canada | ||
| Mexico | ||


Key Questions Answered in the Report
How large will unit shipments be by 2031 in the North America plastic caps and closures market?
Volume is forecast to reach 488.36 billion units by 2031, advancing at a 3.41% CAGR from 2026 to 2031.
Which closure material is growing the fastest?
Polyethylene terephthalate caps are expanding at 4.31% annually as brands adopt liner-free mono-material designs.
Why are child-resistant closures gaining share?
Online pharmacy and nutraceutical channels demand ASTM-compliant child-resistant designs, lifting the segment at 4.02% CAGR.
How are EPR fees affecting suppliers?
Virgin-resin fees of USD 0.02–0.04 per closure raise costs unless converters secure recycled feedstock, spurring material transitions to PP and PET recyclate.
Which country is the fastest-growing market in the region?
Mexico is posting a 6.33% CAGR through 2031, supported by nearshoring investments and rising urban beverage consumption.
What technologies are differentiating leading converters?
Investments in AI vision inspection, NFC-enabled smart caps, and hybrid compression-injection presses are setting suppliers apart on quality and compliance.oving responsiveness.
Page last updated on:


