
Oxygen Market Size and Share
Market Overview
| Study Period | 2021 - 2031 |
|---|---|
| Market Volume (2026) | 95.38 Million tons |
| Market Volume (2031) | 119.20 Million tons |
| Growth Rate (2026 - 2031) | 4.56 % |
| Fastest Growing Market | Asia-Pacific |
| Largest Market | Asia-Pacific |
| Market Concentration | Medium |
Major Players *Disclaimer: Major Players sorted in no particular order Image © Mordor Intelligence. Reuse requires attribution under CC BY 4.0. | |
Oxygen Market Analysis by Mordor Intelligence
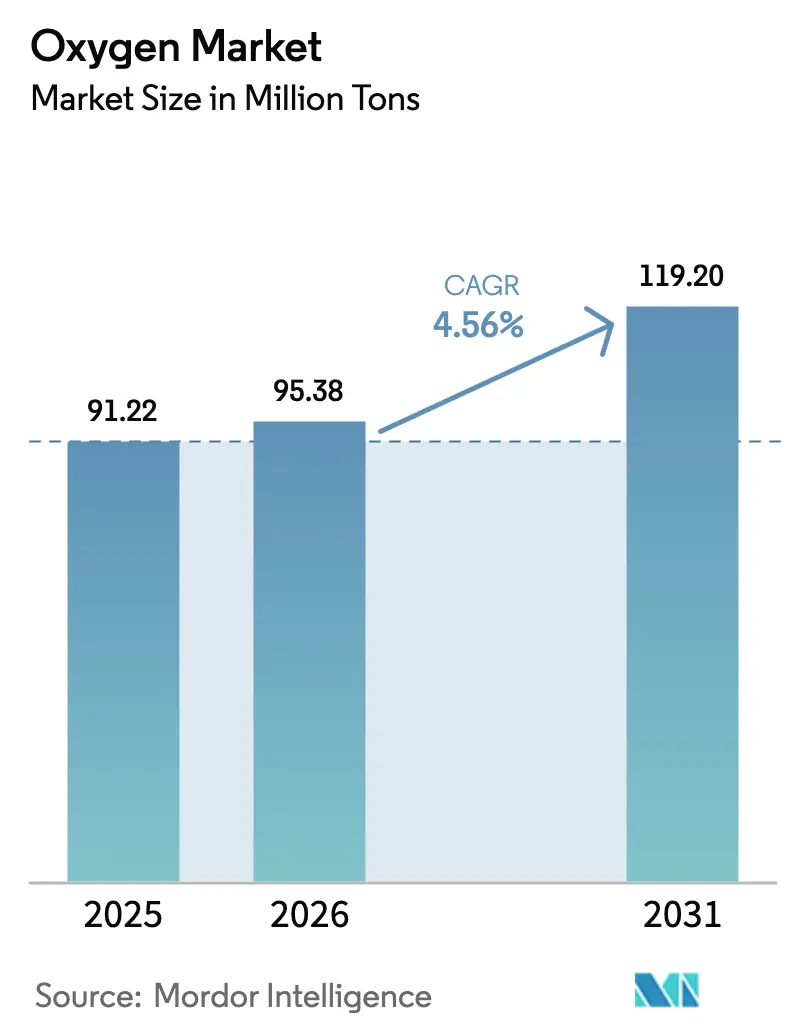
The Oxygen Market size is expected to increase from 91.22 Million tons in 2025 to 95.38 Million tons in 2026 and reach 119.20 Million tons by 2031, growing at a CAGR of 4.56% over 2026-2031. Rapid decarbonization mandates in heavy industry, widening gaps in medical-gas infrastructure, and the rising use of electrolysis by-product streams combine to set a clear growth trajectory for the global oxygen market. Asia-Pacific strengthens its role as both the largest producer and the fastest-growing consumer as China and India add blast furnaces, semiconductor fabs, and hospital PSA installations simultaneously. Gaseous supply anchored in long-haul pipelines remains dominant, yet liquid logistics are scaling the oxygen market wherever mines, LNG-to-power complexes, and other remote facilities require bulk deliveries. Ultra-high-purity demand from advanced-node chip plants is beginning to reshape merchant-price bands, while hospitals in emerging economies pivot to on-site generation to mitigate cylinder shortages and transport costs.
Key Report Takeaways
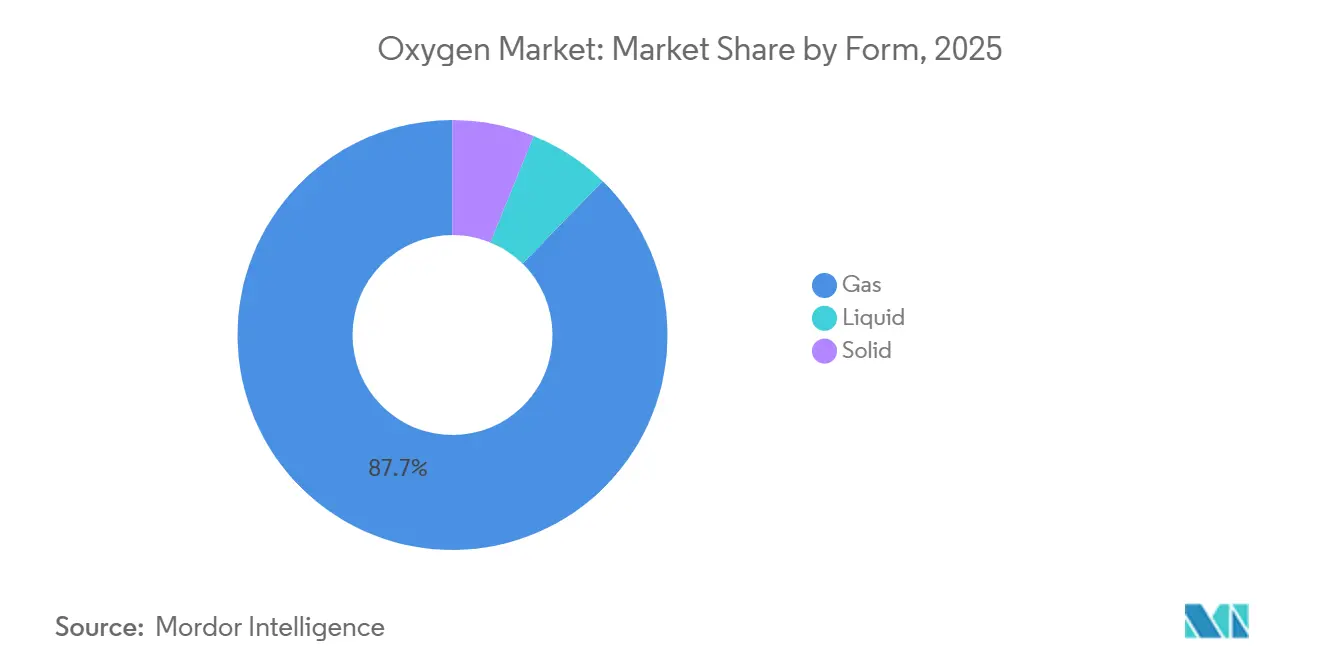
- By form, gas led with 87.68% of oxygen market share in 2025, while liquid is forecast to advance at a 4.55% CAGR to 2031.
- By type, industrial commanded 64.66% share of the oxygen market size in 2025, while medical is projected to expand at a 4.78% CAGR during 2026-2031.
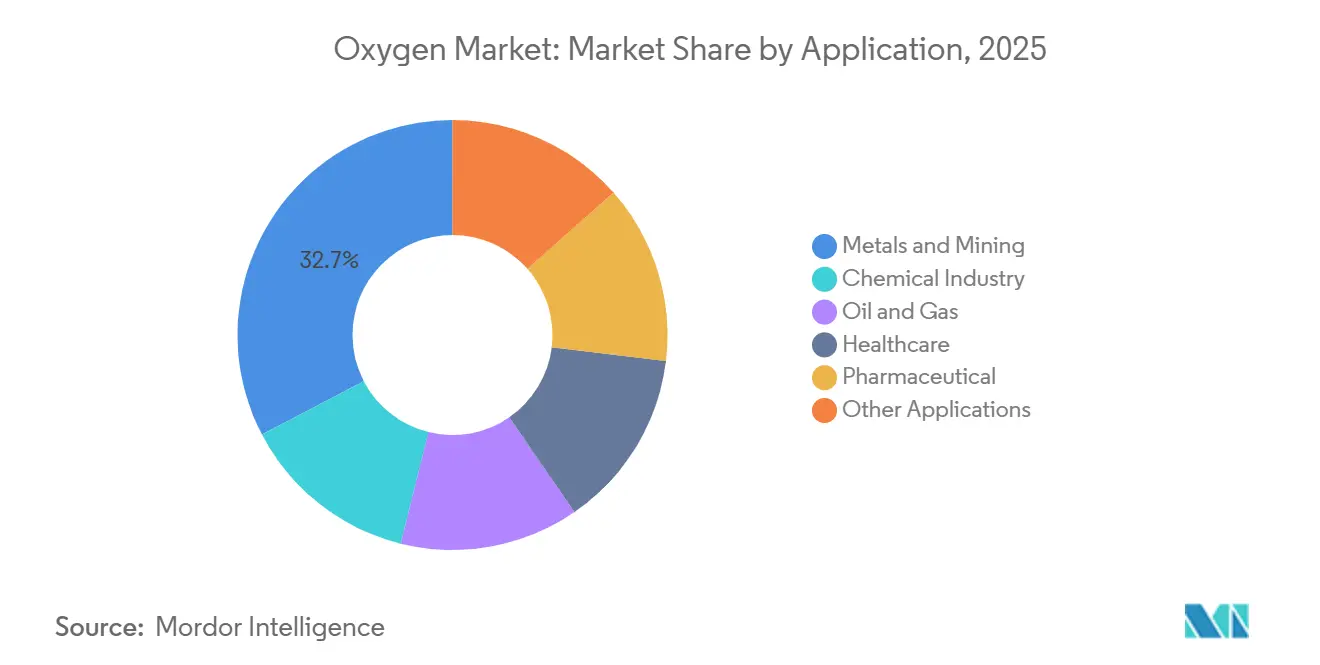
- By application, metals and mining captured 32.67% share of the oxygen market size in 2025, while pharmaceutical posts the fastest 4.98% CAGR through 2031.
- By geography, Asia-Pacific dominated with 41.52% oxygen market share in 2025 and also records the highest 5.45% CAGR out to 2031.
Note: Market size and forecast figures in this report are generated using Mordor Intelligence’s proprietary estimation framework, updated with the latest available data and insights as of 2026.
Global Oxygen Market Trends and Insights
Drivers Impact Analysis*
| Driver | (~) % Impact on CAGR Forecast | Geographic Relevance | Impact Timeline |
|---|---|---|---|
| Rising Incidence of Acute and Chronic Respiratory Disorders | +1.2% | Global, with acute demand in South Asia and Sub-Saharan Africa | Medium term (2-4 years) |
| Steel and Non-Ferrous Metal Production Growth in Asia | +1.5% | APAC core (China, India, ASEAN), spill-over to Middle East | Long term (≥4 years) |
| Expansion of On-Purpose Hydrogen and Oxy-Fuel Projects | +0.9% | North America, Europe, Middle East, Australia | Long term (≥4 years) |
| Hospital Shift to PSA Micro-Plants in Emerging Markets | +0.7% | South Asia, Southeast Asia, Sub-Saharan Africa | Short term (≤2 years) |
| Ultra-High-Purity O₂ Demand from Advanced-Node Semiconductors | +0.4% | East Asia (South Korea, Taiwan, Japan), North America (Arizona, Texas) | Medium term (2-4 years) |
| Source: Mordor Intelligence | |||
Rising Incidence of Acute and Chronic Respiratory Disorders
Global prevalence of chronic obstructive pulmonary disease and asthma reached 545 million in 2023, climbing 3.2% annually in low- and middle-income nations where air-quality deterioration and tobacco use persist[1]World Health Organization, “Global Respiratory Disease Burden 2023,” who.int . Disability-adjusted life years tied to respiratory illness rose to 7.8% of the total burden in South Asia, pushing hospitals in India, Bangladesh, and Pakistan to scale medical-gas systems quickly. Emergency departments in the United States logged an 18% jump in oxygen-dependent episodes between 2020 and 2024, a shift that triggered upgrades from cylinder bundles to bulk liquid storage in major urban centers. WHO’s updated treatment guidelines now require that every inpatient ward equipped for respiratory care maintain continuous high-flow oxygen availability, ensuring that procurement of pressure-swing-adsorption (PSA) plants and cylinder-filling hubs accelerates across lower-income regions. Collectively, these factors add direct volume and ensure recurring demand for the oxygen market across both public and private healthcare networks.
Steel and Non-Ferrous Metal Production Growth in Asia
China produced 1.02 billion tons of crude steel in 2024, capturing a 53% global share, while India’s output reached 144 million tons on a 7.4% year-on-year rise. Blast-furnace oxygen enrichment that lifts inlet concentration from 21% to 28% is trimming furnace coke consumption by 12% per ton of hot metal, lowering cost curves and tightening emission caps at Chinese mills. Indonesia and Vietnam commissioned nickel-pig-iron smelters that each consume up to 1.2 tons of oxygen per ton of product, generating steady offtake in Sulawesi and Quang Ngai. South Korea’s hydrogen direct-reduction pilot at Pohang signals a pivot to oxygen-intensive downstream melting, adding future strength to the oxygen market in East Asia. Robust ferrous and non-ferrous production therefore anchors long-run industrial gas demand well beyond the forecast window.
Expansion of On-Purpose Hydrogen and Oxy-Fuel Projects
The U.S. Department of Energy committed USD 7 billion to seven hydrogen hubs in 2023, targeting 10 GW of electrolyzers that will each generate roughly 80,000 tons of oxygen annually as a co-product. Air Products’ USD 15 billion Neom project in Saudi Arabia will generate 1.2 million tons per year by 2026, yet only 30% is slated for merchant sales, emphasizing latent upsides if new take-off agreements materialize. Mitsubishi Heavy Industries demonstrated a 500-MW oxy-fuel retrofit in Japan consuming 0.9 tons of oxygen per megawatt-hour, illustrating just how oxygen becomes the second-largest operating cost after fuel in some decarbonization pathways. IEA scenarios place oxy-combustion and chemical looping at 12% of global carbon-capture capacity by 2030, funneling additional demand into the oxygen market over the long term.
Hospital Shift to PSA Micro-Plants in Emerging Markets
Ethiopia installed 312 PSA units across district hospitals between 2021 and 2024, slashing cylinder stock-outs from 42% to 11% and cutting delivery costs by 68%. India mandated PSA systems for every district hospital above 50 beds by December 2024, deploying 1,800 units that displaced 22% of rural cylinder demand. PAHO’s oxygen-security framework, adopted by 18 Latin American countries, channels multilateral loans into micro-plants for facilities serving more than 20,000 people. Capital costs for a 50 m³/h PSA unit hover near USD 200,000 with paybacks as short as 18 months wherever delivered-cylinder prices exceed USD 0.40 per m³. Quick installation timelines and minimal maintenance make PSA technology a preferred strategy for governments intent on closing critical-care gaps, feeding structural growth in the oxygen market.
Restraints Impact Analysis*
| Restraint | (~) % Impact on CAGR Forecast | Geographic Relevance | Impact Timeline |
|---|---|---|---|
| Availability of Alternate Cutting/Fuel Gases (LPG, Acetylene) | -0.5% | Global, with higher substitution in cost-sensitive markets (South Asia, Latin America) | Medium term (2-4 years) |
| Global Shortage of Large-Bore Cryogenic Iso-Tankers | -0.3% | Secondary markets in Africa, Southeast Asia, inland South America | Short term (≤2 years) |
| Trace-Contaminant Limits for EU MDR Oxygen APIs | -0.2% | European Union, with compliance spillover to export-oriented suppliers in India and China | Medium term (2-4 years) |
| Source: Mordor Intelligence | |||
Availability of Alternate Cutting/Fuel Gases (LPG, Acetylene)
Liquefied petroleum gas and acetylene increasingly displace oxygen-fuel pairs in small-scale welding where portability outweighs pure flame temperature. A 2024 American Welding Society survey showed 38% of workshops in the United States and Mexico moved to LPG-air torches for steel up to 25 mm thick, saving USD 120 per month on cylinder rental. Propane-oxygen hybrids in Indian shipyards and construction sites reduce overall oxygen draw per cut by 15% while simplifying logistics. Plasma-arc systems based on compressed air or nitrogen capture 22% cutting share in Europe on falling equipment costs, nudging down oxygen market volumes in fabrication. Although these alternatives carry trade-offs in cut quality and speed, their lower handling risks and cost advantages slow oxygen penetration in selected user segments.
Trace-Contaminant Limits for EU MDR Oxygen APIs
Europe’s Medical Device Regulation raised the bar for pharmaceutical-grade oxygen, capping carbon monoxide, CO₂, and hydrocarbon traces well below former pharmacopoeia thresholds[2]European Medicines Agency, “MDR Oxygen API Standards 2025,” ema.europa.eu . Suppliers therefore retrofit plants with extra purification trains and inline analyzers, boosting capital costs and unit production expenses. Export-oriented manufacturers in India and China must comply to maintain access, elevating cost structures for those hubs. While high-margin medical channels can absorb part of the spend, industrial grades see pass-through price hikes that affect the broader oxygen market. Compliance timelines run to 2027, but early movers gain reputational advantages with hospitals and life-science firms that demand strict validation.
*Our forecasts treat driver/restraint impacts as directional, not additive. The impact forecasts reflect baseline growth, mix effects, and variable interactions.
Segment Analysis
By Form: Gaseous Dominance Anchored in Pipeline Networks, Liquid Growth Tied to Remote-Site Economics
Gaseous supply held 87.68% oxygen market share in 2025 as on-site air-separation units dispatch flows at 5-40 bar straight into steel furnaces, chemical reactors, and chip fabs. Liquid oxygen expands at a 4.55% CAGR because cryogenic trucks deliver steady volumes to Chile’s Atacama copper belt, Australia’s Pilbara mines, and LNG-to-power islands where pipelines prove uneconomical. The oxygen market size attributable to solid oxygen remains marginal because of limited aerospace and laboratory usage.
Emerging trends add electrolyzer-generated oxygen to existing networks, cutting blended costs by 8% in Germany’s Ruhr Valley pilot led by ThyssenKrupp and Air Liquide. LNG power complexes at ExxonMobil’s Baytown and Reliance Jamnagar now store liquid oxygen in cryogenic tanks to cushion plant upsets, illustrating how liquid logistics underpin resiliency. Regulatory frameworks—ISO 21969 for vessel design and ASME codes for high-pressure oxygen piping—tighten inspection intervals, favoring large suppliers that can bundle engineering and compliance into long-term contracts. Collectively, these mechanics reinforce gaseous leadership while carving a distinct growth lane for liquid in the oxygen market.



By Type: Industrial Applications Anchor Volume, Medical Segment Accelerates on Infrastructure Mandates
Industrial oxygen commanded a 64.66% share of the oxygen market size in 2025, delivering combustion efficiency, oxidation control, and material purity across metals, chemicals, and energy verticals. Medical oxygen is projected to rise faster at a 4.78% CAGR over 2026-2031 as aging populations and chronic respiratory diseases intensify hospital demand. Pandemic-era shortages drove on-site plants that continue to push baseline growth beyond pre-2020 trends. In medical segments, portable concentrators for home therapy claim 12% of medical volume and are rising due to rapidly aging nations such as Japan and Italy. Regulatory guardrails—FDA, EMA, and ISO 13485 quality systems—elevate entry barriers, ensuring that certified incumbents maintain prominent stakes in the oxygen market.
By Application: Metals and Mining Lead Volume, Pharmaceutical Segment Fastest on Biomanufacturing Scale-Up
Metals and mining accounted for 32.67% of global consumption in 2025, supported by basic-oxygen furnaces, flash smelters, and direct-reduction iron lines in China, India, Chile, and Australia. Chemicals are followed by oxygen-driven oxidation and gasification steps. Oil and gas demand is accelerating owing to refinery hydrogen production and EOR. Healthcare is spanning from acute hospital care to long-term home oxygen. Pharmaceutical remained a smaller share but claim the highest 4.98% CAGR through 2031 as monoclonal antibody and cell-therapy plants scale in the United States, Europe, and China.
Historical metals usage rose as India added EAF capacity. Biomanufacturing facilities like Lonza’s 100,000-L reactors in New Hampshire and WuXi Biologics’ mega plant in Jiangsu need ≥99.9% purity at flows up to 500 m³/h, driving specialized demand niches. Ancillary applications in water treatment, glass, and pulp together gain incremental footholds as regulators tighten environmental norms. Overall, the oxygen market continues to pivot around metals leadership while opening fresh high-value pockets in life sciences.
Geography Analysis
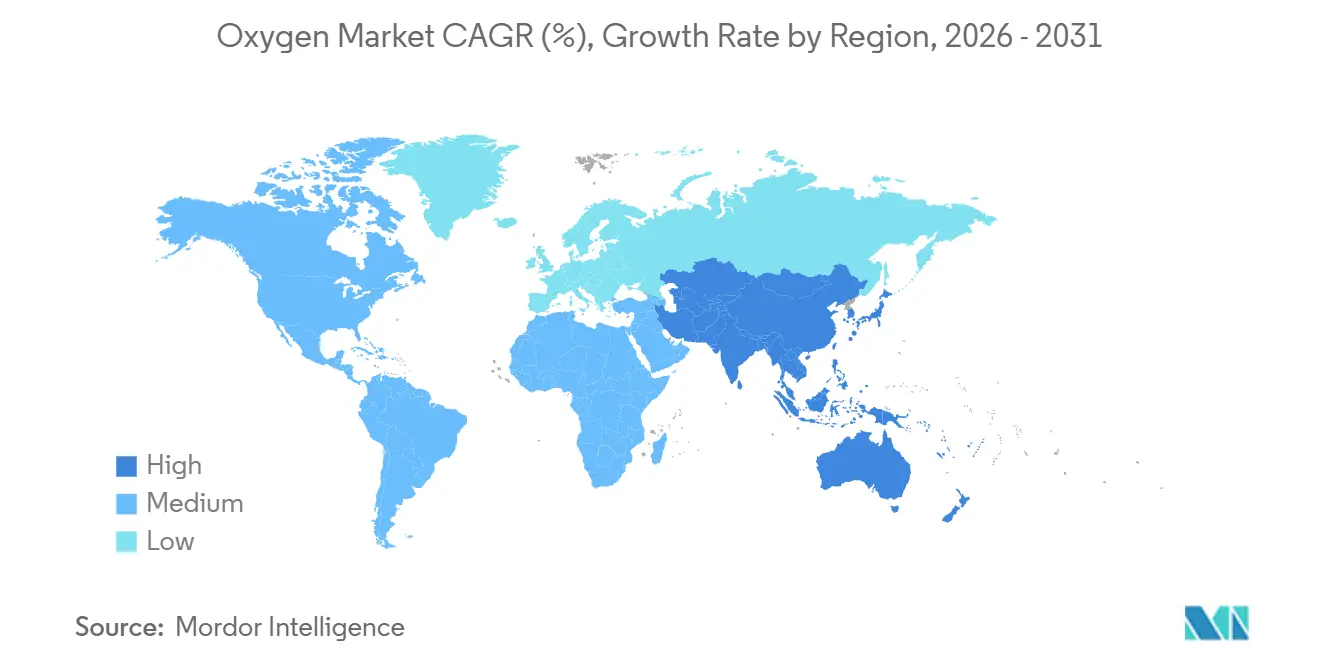
Asia-Pacific led with a 41.52% oxygen market share in 2025 and is on track for a 5.45% CAGR through 2031. China’s 1.02 billion-ton steel output and India’s 144 million tons anchor regional volume, while Indonesia’s nickel smelters and Vietnam’s electronics corridors add pockets of intensity. South Korea contributes high-purity spikes as Samsung and SK Hynix move to sub-3 nm nodes. ASEAN financing through the Asian Development Bank supported 420 PSA installations that shrink rural cylinder dependence in Indonesia, the Philippines, and Myanmar.
North America is anchored by hydrogen hubs, oxy-fuel retrofits, and hospital upgrades. Seven domestic hubs aim to yield 800,000 tons of co-product oxygen yearly once fully operational, with 40% already tied up in Gulf Coast petrochemical contracts. Canada pilots hydrogen iron-making in Ontario, and Mexico’s automotive corridor lifts welding demand in Monterrey and Guanajuato. In Europe, mixing carbon-capture incentives with stringent MDR purity rules raises capital intensity for medical suppliers.
South America and the Middle East and Africa collectively weigh in a smaller share but outpace mature economies. Brazil’s green-hydrogen pilots and EAF steel expansions shape demand, while Argentina’s lithium extraction relies on oxygenated leaching . Saudi Arabia’s Neom complex will internally absorb most of its 1.2 million-ton output, limiting merchant spillover yet signaling potential for future offtake if local networks mature. South Africa’s platinum smelters and PSA deployments respond to lessons from COVID-19-era shortages. National regulations, from Brazil’s ANVISA to South Africa’s Essential Medicines List, reinforce market access requirements that cement sustained oxygen market growth.

Value Chain Analysis
The oxygen value chain starts with power procurement and ambient air intake, then production through cryogenic air separation units (ASUs) for large-volume industrial and merchant supply. For lower-volume, distributed use, pressure swing adsorption (PSA) plants typically serve medical and selected industrial applications. Supply models split between captive or onsite units integrated with anchor customers (steel, refining, chemicals, semiconductors) and merchant networks supplying bulk liquid, cylinders, and packaged gases. Recent capacity commitments reflect this onsite model, including Air Liquide being selected in June 2024 to invest up to USD 850 million for four large modular ASUs in Baytown, Texas to support a low-carbon hydrogen project, and Linde signing October 2024 agreements tied to Tata Steel in India involving large ASU assets.
Distribution and storage rely on pipelines for the highest-volume clusters, while bulk liquid logistics use cryogenic tanks, ISO tankers, and trailers. Cylinder filling and manifold systems support hospitals and SMEs, and supply can tighten when cryogenic tankers and qualified drivers are constrained, or during planned maintenance cycles. Energy price volatility, particularly electricity, remains a key cost driver that influences contracting choices such as dual-sourcing, onsite generation, and bulk storage for resiliency. For downstream grades, validation and monitoring requirements for higher-purity medical and electronic oxygen increase the role of OEMs and service partners for analyzers, valves, and oxygen-clean piping, reinforcing the advantage of integrated suppliers that bundle engineering, compliance, and long-term supply contracts.
Competitive Landscape
The oxygen market demonstrates moderate concentration as Air Liquide, Linde, Air Products, Messer, and Nippon Sanso collectively hold about 75% global share through vertically integrated air-separation networks and 15- to 20-year take-or-pay contracts. Reliability, engineering depth, and regulatory compliance remain the prime competitive vectors as incumbent suppliers deploy 500-3,500 tpd units at captive steel and petrochemical complexes. Regional challengers like Yingde Gas in China, Steelman Gases in India, and Gulfcryo in the Gulf states erode incumbent footholds in tier-two cities by bundling PSA micro-plants, flexible cylinders, and shorter contract terms that better fit SME balance sheets.
White-space lies in monetizing electrolyzer-oxygen that today is often vented at green-hydrogen sites in the Middle East and Australia for lack of pipelines or liquefaction capacity. Containerized modular ASUs from firms such as Entropy and Molten Industries target 10-100 tpd niches for mining and offshore rigs where traditional assets cannot compete on logistics. Semiconductor-grade supply pushes technology boundaries as suppliers add real-time trace-detectors to meet sub-ppb spec windows. Air Liquide’s 2024 membrane-based separation patent hints at energy-cutting hybrids that could lower unit costs by 18% if commercialized broadly. Compliance regimes—ISO 9001, ASME, FDA cGMP, and EMA GMP—favor well-capitalized groups with internal regulatory teams, reinforcing existing barriers and shaping longer-term dynamics of the oxygen market.
Oxygen Industry Leaders
Linde PLC
Air Liquide
Air Products and Chemicals, Inc.
NIPPON SANSO HOLDINGS CORPORATION
Messer SE & Co. KGaA
- *Disclaimer: Major Players sorted in no particular order


Market Opportunities and Future Outlook
Onsite oxygen supply tied to low-carbon industrial projects is a clear opportunity, especially where hydrogen, ammonia, and steel investments co-locate along the U.S. Gulf Coast corridor. Air Liquide announced plans in June 2024 to invest up to USD 850 million in Baytown, Texas for four large modular ASUs supporting a low-carbon hydrogen project. In April 2026, it announced over USD 350 million for a new ASU in St. James Parish, Louisiana aligned with a Hyundai-POSCO steel facility. These projects support long-tenor take-or-pay contracting and can add adjacent merchant supply as ASU networks densify.
Another opportunity is monetizing electrolyzer co-product oxygen and improving regional reliability where bulk liquid logistics face constraints related to cryogenic equipment availability. Demand expansion also runs through the hospital segment in emerging markets as onsite PSA micro-plants gain traction. India’s mandate for PSA systems in district hospitals above 50 beds by December 2024 and PAHO-backed oxygen-security frameworks across Latin America support growth in packaged systems, operation-and-maintenance services, and cylinder-filling hubs. Higher-value niches are also tightening around ultra-high-purity oxygen for advanced-node semiconductor fabs and validated medical oxygen supply chains, where suppliers add purification and real-time trace monitoring to meet tighter customer specifications and regulatory quality requirements.
Recent Industry Developments
- June 2026: Nippon Sanso Holdings (via Matheson) started up a new air separation unit in Irwindale, California producing oxygen, nitrogen, and argon. The added local capacity strengthens supply reliability for the U.S. West Coast merchant market and reduces exposure to long-haul bulk liquid movements.
- December 2025: Air Liquide announced a EUR 25 million investment to upgrade and electrify its air separation unit in Yulin, Shaanxi Province, China. The upgrade includes a 10% increase in oxygen production capacity, supporting incremental demand from regional industry while lowering the plants emissions footprint through electrification.
- June 2024: Air Liquide announced plans to invest up to USD 850 million for four large modular air separation units in Baytown, Texas to support a low-carbon hydrogen project. The large-scale build anchors long-term onsite oxygen supply while expanding the industrial gas backbone around the U.S. Gulf Coast energy and petrochemical cluster.


Research Methodology Framework and Report Scope
Market Definition and Coverage
For this methodology, the market covers oxygen supplied and consumed across industrial and medical uses, counted as product volume delivered in tons across the covered geographies. We treat oxygen consistently across supply modes by converting reported output, deliveries, and consumption into comparable tonnage.
Scope exclusions: We exclude air separation equipment, cylinders and storage hardware, and oxygen therapy devices and accessories, unless oxygen volume is explicitly sold and counted as oxygen consumption.
Segmentation Overview
- By Form
- Gas
- Liquid
- Solid
- By Type
- Industrial
- Medical
- By Application
- Metals and Mining
- Chemical Industry
- Oil and Gas
- Healthcare
- Pharmaceutical
- Other Applications
- By Geography
- Asia-Pacific
- China
- India
- Japan
- South Korea
- ASEAN Countries
- Rest of Asia-Pacific
- North America
- United States
- Canada
- Mexico
- Europe
- Germany
- United Kingdom
- France
- Italy
- NORDIC Countries
- Rest of Europe
- South America
- Brazil
- Argentina
- Rest of South America
- Middle-East and Africa
- Saudi Arabia
- South Africa
- Rest of Middle-East and Africa
- Asia-Pacific
Data Sources, Market Sizing, and Validation
Desk Research
Desk work starts with building the physical demand pool and supply availability for oxygen, since this market is measured in tons and not in dollars. We pull foundational indicators from public sources such as the US Geological Survey, World Steel Association, International Energy Agency, and World Health Organization, which help anchor end use intensity in steelmaking, refining, chemicals, and hospital care.
We also review trade and production related data from sources such as UN Comtrade, national customs portals, and statistical agencies, followed by company annual reports, investor presentations, and reputable press for capacity additions and outages. Patent databases are checked to understand the direction of on site generation and purification methods, and an import export shipment level database is used selectively to sanity check cross border oxygen flows where trade is material. These sources are illustrative and not exhaustive, and many other public documents were used for data collection, cross checks, and clarifying assumptions.
Primary Interviews and Surveys
Primary work focuses on verifying how oxygen volumes move across merchant bulk, on site supply, and packaged distribution, and how demand intensity shifts by end user (steel and metals, chemicals, oil and gas, healthcare, and pharma). We speak with a mix of producers, distributors, large buyers, and domain experts across APAC, EMEA, and the Americas to close data gaps around utilization, purity requirements, and practical loss factors that desk sources do not show clearly.
Distribution of primary research fieldwork respondents
| Company type | Respondent position | Region |
|---|---|---|
| Top tier: 29% | CXOs: 17% | APAC: 46% |
| Mid tier: 54% | Functional/Unit leaders: 38% | EMEA: 29% |
| Smaller Players: 17% | Managers: 45% | Americas: 25% |
Market-Sizing & Forecasting
The core model uses a top-down build that reconstructs oxygen demand from end use activity and intensity factors, and then converts it into delivered tons by region. For example, steel output, refinery throughput, chemical production trends, and hospital oxygen consumption protocols are translated into oxygen tonnage using validated intensity ranges, before being adjusted for supply mode mix (merchant bulk versus on site generation) and typical distribution losses.
To keep the totals realistic, we corroborate them with selective bottom-up approximations, such as rolling up known capacities of large plants, checking utilization ranges, and using sampled volume per contract structure where buyers disclosed it. Where a country has limited visibility, we fill gaps using proxy indicators like steel and chemicals output growth, urban hospital bed capacity changes, and import patterns, and then we stress test the result in expert calls.
For forecasting, we rely mainly on scenario analysis that links oxygen tonnage to a small set of drivers that stakeholders can validate, including crude steel production outlook, industrial output growth, healthcare oxygen readiness programs, and the pace of new air separation capacity commissioning. Our assumptions are kept consistent across regions through a common conversion logic, and then localized using regional supply constraints and end use mixes shared by interviewees.
Data Validation & Update Cycle
Validation happens in layers, starting with unit consistency checks so that production, trade, and consumption are all aligned to tons, and then moving to variance checks versus independent signals like steel output trends and reported medical oxygen utilization patterns. We review anomalies country by country, and when a number moves outside an expected band, the driver assumption is revisited and, where needed, experts are re contacted to confirm what changed.
Before sign off, the model is reviewed by another analyst to confirm that the conversion factors, growth drivers, and regional rollups match the stated scope and do not double count on site volumes. Reports are refreshed annually, and interim updates are made when material events occur, such as major plant outages, policy shifts in medical oxygen provisioning, or large capacity additions. Right before delivery, we perform a fresh pass to incorporate the latest public releases and any new confirmation from recent calls.
Mordor Intelligence's Oxygen Market Estimate Compared With Other Published Estimates
Published market sizes for oxygen can look far apart because the starting unit is not always the same, and because adjacent categories get mixed in during conversions to dollars. Differences also come from how on site generation is treated, how medical oxygen is separated from broader healthcare equipment, and how quickly assumptions are refreshed when steel cycles and hospital demand shift.
The table shows a wide spread mainly because some estimates convert tons into USD using blended prices that move sharply by purity, delivery mode, and contract length, and they may also bundle other industrial gases or equipment revenue into the same total. The table also highlights a scope choice, where in Mordor Intelligence's model the market is sized in physical volume (million tons) across industrial and medical oxygen, which avoids inflation from price assumptions that vary by region and supply mode.
Benchmark comparison
| Source | Market Size | Gaps in Research Methodology |
|---|---|---|
| Mordor Intelligence | USD 95.38 M (2026) | |
| Trade Journal A | USD 46.90 B (2024) | Uses a revenue view of industrial oxygen and applies broad pricing assumptions that can overstate value when merchant bulk prices are extrapolated to on site volumes, and it does not clearly separate oxygen only from adjacent industrial gas revenue. |
| Industry Publisher B | USD 41.54 B (2025) | Reports a value based estimate with limited clarity on whether medical oxygen and cylinder related services are included, and year to year currency timing and price progression rules are not fully traceable. |
When the units and boundaries are aligned, the spread becomes easier to explain, since volume based sizing and value based sizing answer different questions. Our approach stays traceable because each step ties back to observable activity drivers and practical conversion factors, and then the totals are cross checked with supply capacity and utilization signals before finalizing.


Key Questions Answered in the Report
How large will global oxygen demand be by 2031?
Oxygen market size is forecast to reach 119.20 million tons by 2031, expanding at a 4.56% CAGR from 2026-2031.
Which region grows fastest in volume terms?
Asia-Pacific records the highest 5.45% CAGR thanks to simultaneous growth in steel, semiconductors, and hospital PSA plants.
Why is Asia–Pacific so dominant for oxygen demand?
The region concentrates steelmaking, semiconductor fabrication, and expanding hospital networks, giving it 41.45% market share in 2025 and the swiftest 5.41% CAGR.
What segment holds the largest share?
Gaseous form retains the lead at 87.68% of oxygen market share because of extensive pipeline networks and on-site units.
Why is medical oxygen demand accelerating?
Rising chronic respiratory disease and mandated on-site PSA installations lift medical oxygen volume at a 4.78% CAGR.
Page last updated on:


 Your data is secure and never sold or shared.


