Market Overview
| Study Period | 2020 - 2031 |
|---|---|
| Forecast Data Period | 2026 - 2031 |
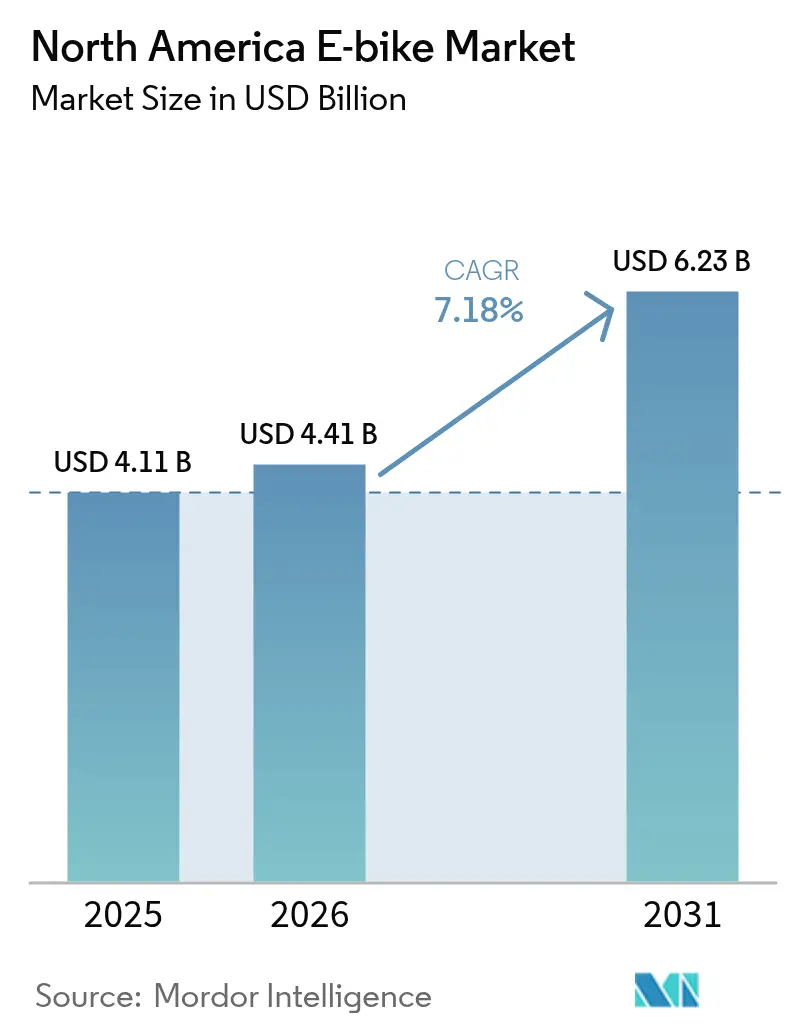
| Base Year Market Size (2025) | USD 4.11 Billion |
| Market Size (2026) | USD 4.41 Billion |
| Market Size (2031) | USD 6.23 Billion |
| Growth Rate (2026 - 2031) | 7.18% CAGR |
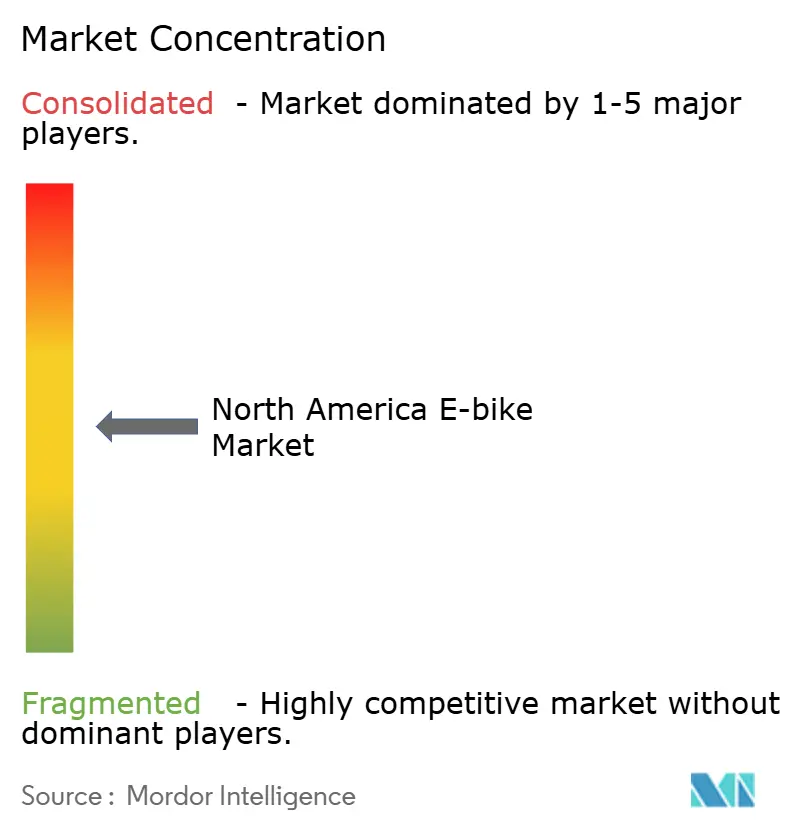
| Market Concentration | Medium |
Major Players*Disclaimer: Major Players sorted in no particular order Image © Mordor Intelligence. Reuse requires attribution under CC BY 4.0. |
|
North America E-bike Market Analysis by Mordor Intelligence
The North America E-bike market size was valued at USD 4.11 billion in 2025 and estimated to grow from USD 4.41 billion in 2026 to reach USD 6.23 billion by 2031, at a CAGR of 7.18% during the forecast period (2026-2031). The combination of federal purchase incentives, growing urban cycling infrastructure, and changing commuter preferences keeps demand on a steady upward trajectory. Rapid rollout of protected bike lanes and employer-sponsored micromobility programs is widening the addressable customer base beyond core recreational cyclists. Federal and state fiscal measures that lower upfront prices have already shortened payback periods relative to public transit passes.
Key Report Takeaways
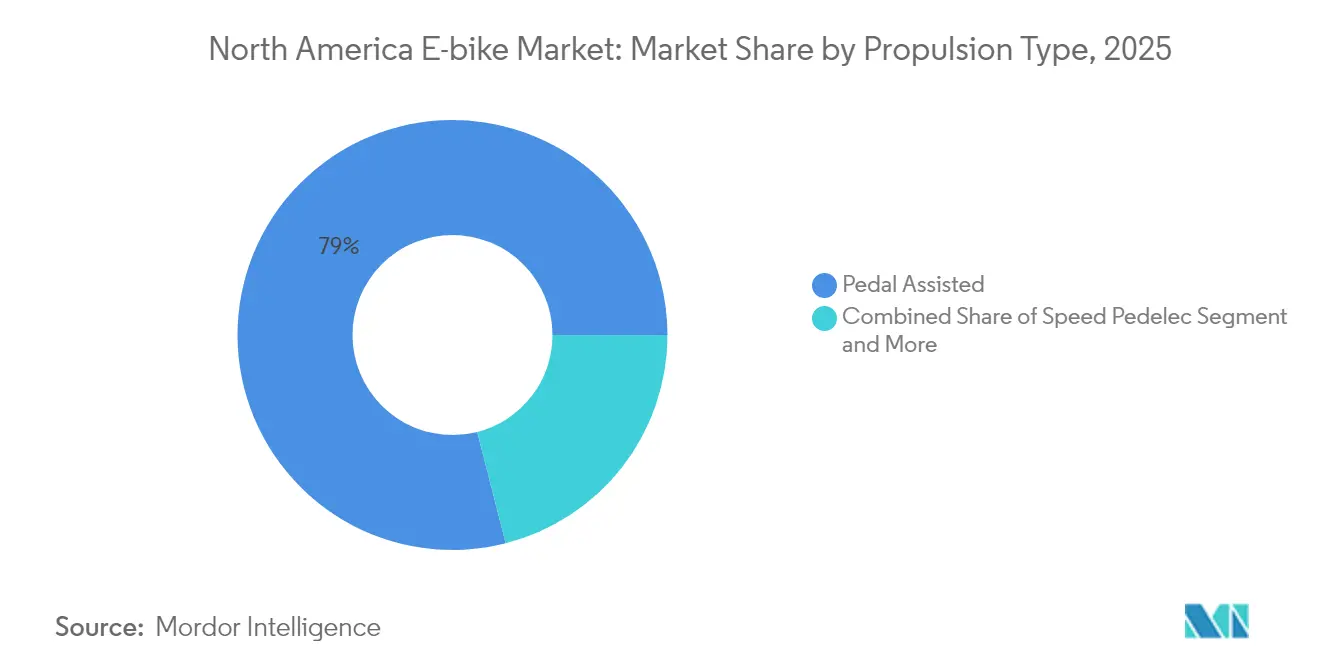
- By propulsion type, pedal-assisted systems held 78.98% of the North America e-bike market share in 2025, while speed pedelecs are projected to grow at an 17.54% CAGR through 2031.
- By application type, city/urban e-bikes dominated with an 81.10% share, whereas the cargo/utility segment is forecast to expand at a 20.98% CAGR through 2031.
- In terms of battery type, lithium-ion models accounted for 92.10% of market sales, with the category expected to advance at a 15.98% CAGR during the same period.
- By motor placement, hub-motor systems represented 67.55% of the market share in 2025, while mid-drive configurations are set to grow at a 18.79% CAGR to 2031.
- Across drive systems, chain-drive e-bikes led with 80.45% share, as belt-drive variants are anticipated to rise at a 21.38% CAGR.
- By motor power, the 251 to 350 W range captured 35.06% of the market, with the 501 to 600 W category expected to witness 23.05% CAGR growth.
- In terms of pricing, models priced between USD 1,500 to 2,499 contributed 31.45%, while the USD 3,500 to 5,999 segment is projected to increase at a 16.78% CAGR.
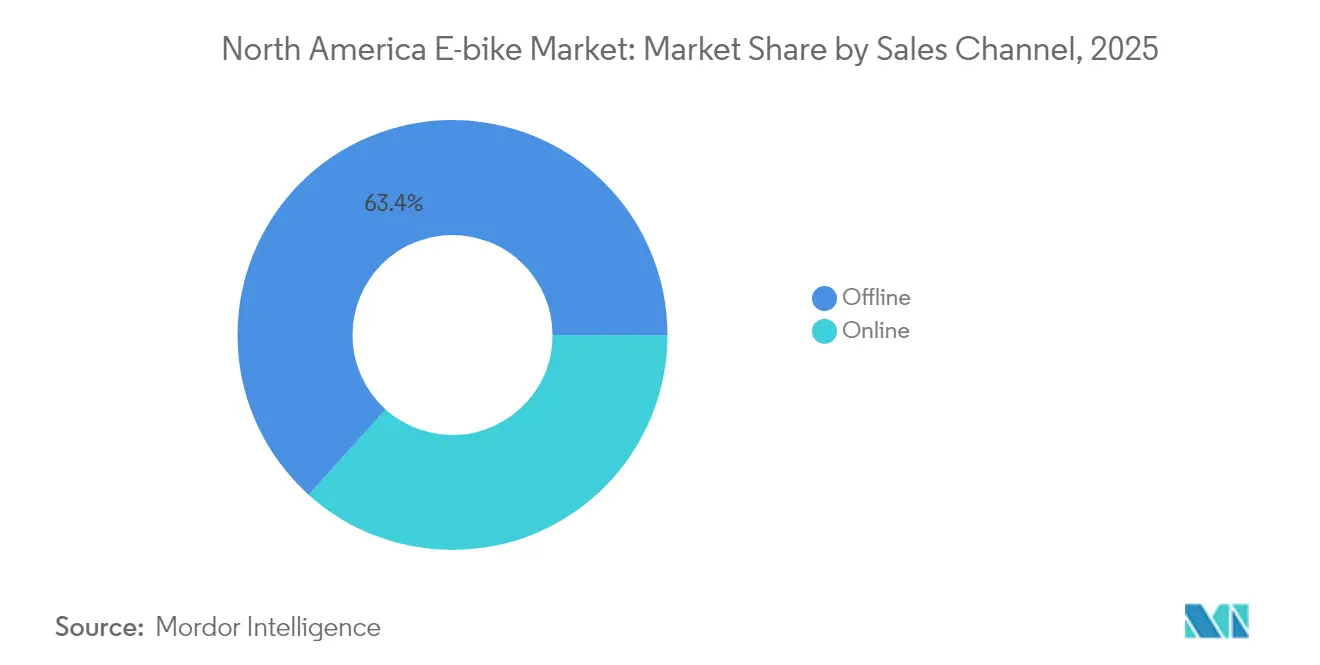
- By sales channel, offline retail accounted for 63.35%, with online platforms growing at a 19.06% CAGR through 2031.
- By end use, personal and family e-bikes represented 54.62% of the market share, whereas commercial delivery fleets are forecast to grow at 22.34% CAGR.
- By country, the United States dominated with 77.65% of the market share, while Mexico is expected to expand at an 18.28% CAGR through 2031.
Note: Market size and forecast figures in this report are generated using Mordor Intelligence’s proprietary estimation framework, updated with the latest available data and insights as of 2026.
North America E-bike Market Trends and Insights
Drivers Impact Analysis*
| Driver | (~) % Impact on CAGR Forecast | Geographic Relevance | Impact Timeline |
|---|---|---|---|
| Federal Tax Credits | +1.8% | United States, with spillover to Canada | Medium term (2–4 years) |
| Corporate Micromobility Fleets | +1.2% | North America urban centers, concentrated in US West Coast | Short term (≤ 2 years) |
| Integration of Connected Telematics | +0.9% | Global, with early adoption in North America | Long term (≥ 4 years) |
| Class 3 E-Bike Regulations | +0.8% | United States state-level, gradual Canada adoption | Medium term (2–4 years) |
| Growth of Rail-Trail Tourism | +0.7% | North America rural-urban interfaces | Long term (≥ 4 years) |
| Battery-as-a-Service | +0.5% | North America commercial segments | Long term (≥ 4 years) |
| Source: Mordor Intelligence | |||
Federal Tax Credits for Light Electric Vehicles
Federal tax credit expansion under the E-BIKE Act framework creates direct consumer incentives worth up to USD 1,500 per qualifying electric bicycle purchase, fundamentally altering price elasticity calculations for middle-income households. This policy mechanism mirrors successful electric vehicle adoption strategies, where upfront cost reduction accelerates market penetration beyond early adopter segments. The credit structure particularly benefits pedal-assisted models under 750W, aligning with existing federal motor vehicle definitions while avoiding regulatory complexity associated with higher-powered variants. Implementation timing coincides with state-level incentive programs in California, Colorado, and Vermont, creating cumulative savings that position e-bikes competitively against public transportation monthly passes.
Rising Corporate Micromobility Fleets
Corporate fleet adoption accelerates as companies recognize e-bikes as solutions for employee commuting, campus transportation, and last-mile delivery operations, with deployment costs significantly lower than traditional vehicle fleets. Major corporations, including Amazon, UPS, and DHL, expanded e-cargo bike programs throughout 2024, driven by urban delivery restrictions and carbon neutrality commitments. Fleet operators report 40-60% cost reductions compared to van-based delivery systems in dense urban environments, while achieving superior delivery times during peak traffic periods. This corporate adoption creates bulk purchasing dynamics that influence manufacturer production planning and technology development priorities, particularly for commercial-grade components and fleet management software integration.
Integration of Connected Telematics and OTA Updates
Connected e-bike systems enable real-time performance optimization, predictive maintenance scheduling, and user behavior analytics that transform traditional bicycle ownership into service-oriented relationships. Over-the-air update capabilities allow manufacturers to enhance motor efficiency algorithms, battery management protocols, and safety features post-purchase, extending product lifecycles while creating recurring revenue opportunities. This technological convergence particularly benefits commercial fleet operators who require centralized monitoring, route optimization, and maintenance scheduling across distributed vehicle inventories. Integration with smartphone ecosystems and urban mobility platforms positions e-bikes as nodes within broader transportation-as-a-service frameworks, appealing to consumers who prioritize seamless multimodal connectivity.
Expansion of Class 3 (28 mph) E-Bike Regulations
Regulatory harmonization across state jurisdictions enables Class 3 e-bike operation on previously restricted infrastructure, expanding addressable market segments for speed-oriented commuting applications. Twenty-eight states adopted Class 3 regulations by 2024, creating interstate compatibility that benefits touring and long-distance commuting use cases. This regulatory evolution particularly impacts speed pedelec adoption, where higher velocity capabilities justify premium pricing while addressing range anxiety concerns for suburban commuters. Standardized classification systems reduce manufacturer compliance complexity and enable economies of scale in component sourcing, particularly for motor controllers and battery management systems optimized for sustained higher-speed operation[1]"National Electric Bicycle Law and Policy Overview," peopleforbikes.org..
Restraints Impact Analysis*
| Restraint | (~) % Impact on CAGR Forecast | Geographic Relevance | Impact Timeline |
|---|---|---|---|
| Lithium-Ion Cell Supply | −1.4% | North America manufacturing, with Mexico assembly impact | Short term (≤ 2 years) |
| Insurance Premium Hikes | −0.8% | North America commercial segments, urban concentrated | Medium term (2–4 years) |
| Municipal Speed-Limit Caps | −0.6% | United States and Canada urban cores | Short term (≤ 2 years) |
| Perception of Fire-Hazard Risk | −0.5% | North America residential and commercial buyers | Medium term (2–4 years) |
| Source: Mordor Intelligence | |||
Tightening Lithium-Ion Cell Supply in NAFTA Region
Lithium-ion cell supply constraints within NAFTA territories create cost pressures and delivery delays that disproportionately impact e-bike manufacturers without established Asian supply relationships. Trade policy shifts toward regional content requirements conflict with current battery cell production capacity, as North American facilities primarily serve automotive applications with limited availability for micromobility segments. This supply-demand imbalance forces manufacturers to choose between higher-cost regional sourcing and potential tariff exposure on imported cells, creating margin compression that may limit product portfolio expansion. Cell shortage particularly affects mid-range price segments where cost optimization remains critical for mass market adoption, while premium manufacturers maintain flexibility through diversified sourcing strategies.
Insurance Premium Hikes for Commercial E-Cargo Fleets
Commercial insurance costs for e-cargo bike fleets increased 25-40% during 2024 as insurers reassess risk profiles following higher-than-expected accident rates and theft incidents in urban environments. Premium increases particularly impact small and medium-sized delivery companies that lack scale advantages for self-insurance options, creating barriers to fleet expansion and operational cost pressures that may slow commercial adoption. Risk assessment challenges stem from limited actuarial data on e-bike commercial applications, leading to conservative underwriting approaches that penalize early adopters. This insurance cost inflation contrasts with traditional delivery vehicle coverage, where established risk models enable more competitive pricing structures for equivalent transportation capacity[2]"The Commercial Insurance Market," Insurance Information Institute, iii.org..
*Our forecasts treat driver/restraint impacts as directional, not additive. The impact forecasts reflect baseline growth, mix effects, and variable interactions.
Segment Analysis
By Propulsion Type: Speed Pedelecs Challenge Pedal-Assisted Dominance
Pedal-assisted systems maintain a 78.98% market share in 2025, reflecting consumer preference for natural cycling experiences enhanced by motor assistance rather than replaced by it. Speed pedelecs emerge as the fastest-growing segment at 17.54% CAGR through 2031, driven by expanding Class 3 regulations and suburban commuter adoption seeking car-replacement solutions. Throttle-assisted variants occupy a specialized niche, primarily serving accessibility applications and commercial delivery scenarios where instant power delivery provides operational advantages. The propulsion type evolution reflects broader transportation electrification trends, where user control and energy efficiency considerations favor pedal-integrated systems over purely throttle-based alternatives.
Regulatory frameworks increasingly distinguish between propulsion types, with pedal-assisted models receiving preferential treatment in bike lane access and parking regulations across North American jurisdictions. Speed pedelec growth correlates with infrastructure improvements on dedicated cycling corridors, where higher speeds become practical and safe for longer-distance commuting applications.


By Application Type: Cargo Utility Disrupts Urban Mobility Assumptions
City/urban applications dominate with 81.10% market share in 2025, yet cargo/utility variants accelerate at 20.98% CAGR as e-commerce delivery economics reshape last-mile logistics calculations. Urban models benefit from established cycling infrastructure and consumer familiarity, while cargo configurations unlock new use cases previously dominated by motorized vehicles. Trekking/mountain segments serve recreational markets with specialized terrain capabilities, though growth remains constrained by seasonal usage patterns and niche consumer bases. This application segmentation reflects transportation mode substitution rather than simple cycling market expansion, indicating fundamental shifts in urban mobility preferences.
Commercial cargo adoption particularly accelerates in dense urban environments where parking restrictions and congestion charges create cost advantages for e-bike delivery systems. Trekking applications gain traction through rail-trail tourism development and outdoor recreation infrastructure investments, though seasonal demand patterns limit year-round growth potential.
By Battery Type: Lithium-Ion Supremacy Reinforces Technology Convergence
Lithium-ion batteries command 92.10% market share in 2025 while maintaining 15.98% CAGR through 2031, reflecting technology maturation and supply chain optimization that eliminates alternative chemistry considerations for most applications. Lead-acid alternatives persist in price-sensitive segments, though declining cost differentials and performance advantages favor lithium-ion adoption across all market tiers. Battery chemistry standardization enables component interoperability and service network development, creating ecosystem effects that reinforce lithium-ion dominance despite supply chain vulnerabilities.
Energy density improvements and charging speed enhancements drive continued lithium-ion investment, with manufacturers focusing on cell chemistry optimization rather than alternative technologies. Battery management system integration becomes increasingly sophisticated, enabling predictive maintenance and performance optimization that extends operational lifecycles while reducing total cost of ownership.
By Motor Placement: Mid-Drive Systems Gain Performance-Oriented Adoption
Hub motors maintain 67.55% market share in 2025 due to cost advantages and installation simplicity, while mid-drive systems accelerate at 18.79% CAGR as performance-conscious consumers prioritize natural riding dynamics and hill-climbing capabilities. Hub motor dominance reflects manufacturing cost optimization and maintenance simplicity, particularly for urban commuting applications with moderate terrain variations. Mid-drive configurations appeal to recreational and performance-oriented segments where motor placement affects weight distribution and pedaling efficiency, justifying premium pricing through enhanced riding experiences.
Motor placement preferences correlate with application types, as cargo and utility variants increasingly adopt mid-drive systems for improved load-carrying performance and component longevity. Hub motor technology advances through direct-drive efficiency improvements and regenerative braking integration, maintaining competitiveness in cost-sensitive segments.

By Drive Systems: Belt Drive Innovation Challenges Chain Dominance
Chain drive systems dominate with 80.45% market share in 2025, leveraging established manufacturing infrastructure and component availability that minimize production costs and service complexity. Belt drive alternatives surge at 21.38% CAGR through 2031, driven by maintenance advantages and noise reduction benefits that appeal to urban commuters and premium market segments. Belt systems particularly gain adoption in enclosed or weather-protected applications where traditional chain maintenance becomes impractical, such as cargo bikes and fleet operations requiring minimal service intervention.
Drive system evolution reflects broader transportation electrification trends toward reduced maintenance requirements and improved user experiences. Belt drive adoption correlates with mid-drive motor configurations, where system integration enables optimized power transfer and component longevity.
By Motor Power: Higher Wattage Segments Reflect Performance Escalation
The 251 to 350W segment captures 35.06% market share in 2025, representing an optimal balance between performance capabilities and regulatory compliance across North American jurisdictions. Higher-power 501 to 600W variants accelerate at 23.05% CAGR as consumers seek enhanced performance for challenging terrain and cargo applications, despite regulatory limitations in some jurisdictions. Lower-power segments below 250W serve specific regulatory requirements and cost-sensitive applications, while ultra-high-power variants above 600W remain niche due to classification and infrastructure access restrictions.
Motor power segmentation reflects regulatory framework evolution, where federal and state classifications create market boundaries that influence manufacturer product development strategies. Higher-wattage adoption particularly accelerates in commercial applications where performance requirements justify regulatory complexity and potential infrastructure access limitations.
By Price Band: Premium Segments Signal Market Maturation
The USD 1,500 to 2,499 price band commands 31.45% market share in 2025, representing the sweet spot where performance capabilities meet mass market affordability expectations. Premium USD 3,500 to 5,999 segments accelerate at 16.78% CAGR as consumers increasingly view e-bikes as car replacement solutions rather than recreational purchases, justifying higher investments through transportation cost savings. Entry-level segments below USD 1,000 serve price-sensitive consumers and specific use cases, while ultra-premium segments above USD 6,000 cater to enthusiast and specialized commercial applications.
Price band evolution reflects market maturation beyond early adopter segments, where mainstream consumers evaluate e-bikes against alternative transportation options rather than traditional bicycles. Premium segment growth correlates with feature sophistication, including connected systems, advanced battery management, and integrated accessories that enhance utility and user experience.
By Sales Channel: Online Growth Challenges Traditional Retail Models
Offline channels maintain 63.35% market share in 2025, reflecting consumer preference for physical product evaluation and professional assembly services that ensure safety and performance optimization. Online sales accelerate at 19.06% CAGR through 2031, driven by direct-to-consumer brand strategies and improved logistics capabilities for large-format product delivery. Digital channels particularly benefit from detailed product information availability and customer review systems that address purchase decision complexity for high-involvement products.
Sales channel evolution reflects broader retail transformation trends, where omnichannel strategies combine online research with offline experience and service capabilities. Online growth particularly accelerates in established cycling markets where consumers possess technical knowledge and confidence in remote purchasing decisions.
By End Use: Commercial Delivery Transforms Transportation Economics
Personal and family use maintains 54.62% market share in 2025, reflecting broad consumer adoption for recreational and commuting applications across diverse demographic segments. Commercial delivery applications surge at 22.34% CAGR as e-commerce growth and urban delivery restrictions create compelling economics for e-bike logistics solutions. Service provider and institutional segments serve specialized applications, including maintenance, security, and campus transportation, where operational efficiency and environmental considerations drive adoption decisions.
End use segmentation reflects transportation mode substitution rather than simple market expansion, where e-bikes compete directly with motorized alternatives across multiple application categories. Commercial growth particularly accelerates in dense urban environments where parking limitations and congestion charges create cost advantages for e-bike delivery systems.
Geography Analysis
The United States dominates North American e-bike adoption with 77.65% market share in 2025, leveraging established cycling infrastructure, favorable regulatory frameworks, and consumer purchasing power that enables premium product adoption. Federal tax credit implementation and state-level incentive programs create cumulative cost advantages that accelerate mainstream market penetration beyond traditional cycling demographics. California, Colorado, and New York lead state-level adoption through comprehensive infrastructure investments and regulatory frameworks that accommodate diverse e-bike applications, from recreational use to commercial delivery operations.
Mexico is the fastest-growing geography at 18.28% CAGR through 2031, driven by urbanization trends, traffic congestion challenges, and government initiatives promoting sustainable transportation alternatives in major metropolitan areas. Manufacturing capacity development in Mexico creates cost advantages for regional distribution while supporting NAFTA content requirements that benefit from trade agreement provisions. Mexican market growth particularly accelerates in Mexico City, Guadalajara, and Monterrey, where air quality concerns and traffic congestion create compelling use cases for electric mobility solutions.
Canada maintains steady market development through provincial incentive programs and infrastructure investments that support winter-capable e-bike adoption in challenging climate conditions. British Columbia and Ontario lead provincial adoption through comprehensive cycling infrastructure and rebate programs that reduce purchase barriers for middle-income households. Canadian market characteristics emphasize durability and weather resistance requirements that influence product specifications and pricing structures compared to southern markets.
Competitive Landscape
The North America e-bike market exhibits moderate concentration with established bicycle manufacturers leveraging distribution networks. At the same time, direct-to-consumer brands disrupt traditional retail models through online sales and vertical integration strategies. Market leaders, including Trek, Specialized, and Giant, maintain competitive advantages through dealer networks and brand recognition, while emerging players like Rad Power Bikes and Lectric eBikes capture market share through aggressive pricing and direct sales approaches.
Competitive intensity increases as automotive companies, including General Motors and Ford, explore e-bike market entry through acquisition and partnership strategies, bringing capital resources and manufacturing capabilities that could reshape industry dynamics. Technology differentiation focuses on battery management systems, motor integration, and connected features rather than fundamental propulsion technologies, creating opportunities for software-driven competitive advantages and recurring revenue models.
Patent activity concentrates on battery management, motor control algorithms, and integrated system designs. Major component suppliers, including Bosch, Shimano, and Brose, maintain technology leadership through R&D investments and manufacturing scale advantages. White-space opportunities emerge in commercial fleet management, subscription service models, and integrated mobility platforms that position e-bikes within broader transportation ecosystems rather than standalone products.
North America E-bike Industry Leaders
-
Giant Manufacturing Co.
-
Trek Bicycle Corporation
-
VanMoof
-
Yamaha Bicycles
-
Cycling Sports Group, Inc. (Cannondale)
- *Disclaimer: Major Players sorted in no particular order

Recent Industry Developments
- October 2025: Velotric, one of the fastest-growing e-bike brands in the United States, has officially surpassed 1,200 dealer partners nationwide. The company’s retail network now spans 49 states, underscoring its rapid expansion and strong market momentum.
- January 2025: Pedego Electric Bikes and Vvolt have entered into a strategic collaboration, in which Pedego’s extensive dealer network will now offer Vvolt’s lightweight, belt-drive e-bikes across more than 150 retail locations in the U.S.


North America E-bike Market Report Scope
Pedal Assisted, Speed Pedelec, Throttle Assisted are covered as segments by Propulsion Type. Cargo/Utility, City/Urban, Trekking are covered as segments by Application Type. Lead Acid Battery, Lithium-ion Battery, Others are covered as segments by Battery Type. Canada, Mexico, US, Rest-of-North America are covered as segments by Country.
By Propulsion Type
| Pedal Assisted |
| Speed Pedelec |
| Throttle Assisted |
By Application Type
| Cargo/Utility |
| City/Urban |
| Trekking/Mountain |
By Battery Type
| Lead Acid Battery |
| Lithium-ion Battery |
| Others |
By Motor Placement
| Hub (front/rear) |
| Mid-drive |
By Drive Systems
| Chain Drive |
| Belt Drive |
By Motor Power
| Less than 250 W |
| 251 to 350 W |
| 351 to 500 W |
| 501 to 600 W |
| More than 600 W |
By Price Band (USD)
| Up to 1,000 |
| 1,000 to 1,499 |
| 1,500 to 2,499 |
| 2,500 to 3,499 |
| 3,500 to 5,999 |
| Above 6,000 |
By Sales Channel
| Online |
| Offline |
By End Use
| Commercial Delivery | Retail and Goods Delivery |
| Food and Beverage Delivery | |
| Service Providers | |
| Personal and Family Use | |
| Institutional | |
| Others |
By Country
| United States |
| Canada |
| Mexico |
| By Propulsion Type | Pedal Assisted | |
| Speed Pedelec | ||
| Throttle Assisted | ||
| By Application Type | Cargo/Utility | |
| City/Urban | ||
| Trekking/Mountain | ||
| By Battery Type | Lead Acid Battery | |
| Lithium-ion Battery | ||
| Others | ||
| By Motor Placement | Hub (front/rear) | |
| Mid-drive | ||
| By Drive Systems | Chain Drive | |
| Belt Drive | ||
| By Motor Power | Less than 250 W | |
| 251 to 350 W | ||
| 351 to 500 W | ||
| 501 to 600 W | ||
| More than 600 W | ||
| By Price Band (USD) | Up to 1,000 | |
| 1,000 to 1,499 | ||
| 1,500 to 2,499 | ||
| 2,500 to 3,499 | ||
| 3,500 to 5,999 | ||
| Above 6,000 | ||
| By Sales Channel | Online | |
| Offline | ||
| By End Use | Commercial Delivery | Retail and Goods Delivery |
| Food and Beverage Delivery | ||
| Service Providers | ||
| Personal and Family Use | ||
| Institutional | ||
| Others | ||
| By Country | United States | |
| Canada | ||
| Mexico | ||


Market Definition
- By Application Type - E-bikes considered under this segment include city/urban, trekking, and cargo/utility e-bikes. The common types of e-bikes under these three categories include off-road/hybrid, kids, ladies/gents, cross, MTB, folding, fat tire, and sports e-bike.
- By Battery Type - This segment includes lithium-ion batteries, lead-acid batteries, and other battery types. The other battery type category includes nickel-metal hydroxide (NiMH), silicon, and lithium-polymer batteries.
- By Propulsion Type - E-bikes considered under this segment include pedal-assisted e-bikes, throttle-assisted e-bikes, and speed pedelec. While the speed limit of pedal and throttle-assisted e-bikes is usually 25 km/h, the speed limit of speed pedelec is generally 45 km/h (28 mph).
| Keyword | Definition |
|---|---|
| Pedal Assisted | Pedal-assist or pedelec category refers to the electric bikes that provide limited power assistance through torque-assist system and do not have throttle for varying the speed. The power from the motor gets activated upon pedaling in these bikes and reduces human efforts. |
| Throttle Assisted | Throttle-based e-bikes are equipped with the throttle assistance grip, installed on the handlebar, similarly to motorbikes. The speed can be controlled by twisting the throttle directly without the need to pedal. The throttle response directly provides power to the motor installed in the bicycles and speeds up the vehicle without paddling. |
| Speed Pedelec | Speed pedelec is e-bikes similar to pedal-assist e-bikes as they do not have throttle functionality. However, these e-bikes are integrated with an electric motor which delivers power of approximately 500 W and more. The speed limit of such e-bikes is generally 45 km/h (28 mph) in most of the countries. |
| City/Urban | The city or urban e-bikes are designed with daily commuting standards and functions to be operated within the city and urban areas. The bicycles include various features and specifications such as comfortable seats, sit upright riding posture, tires for easy grip and comfortable ride, etc. |
| Trekking | Trekking and mountain bikes are special types of e-bikes that are designed for special purposes considering the robust and rough usage of the vehicles. These bicycles include a strong frame, and wide tires for better and advanced grip and are also equipped with various gear mechanisms which can be used while riding in different terrains, rough grounded, and tough mountainous roads. |
| Cargo/Utility | The e-cargo or utility e-bikes are designed to carry various types of cargo and packages for shorter distances such as within urban areas. These bikes are usually owned by local businesses and delivery partners to deliver packages and parcels at very low operational costs. |
| Lithium-ion Battery | A Li-ion battery is a rechargeable battery, which uses lithium and carbon as its constituent materials. The Li-Ion batteries have a higher density and lesser weight than sealed lead acid batteries and provide the rider with more range per charge than other types of batteries. |
| Lead Acid Battery | A lead acid battery refers to sealed lead acid battery having a very low energy-to-weight and energy-to-volume ratio. The battery can produce high surge currents, owing to its relatively high power-to-weight ratio as compared to other rechargeable batteries. |
| Other Batteries | This includes electric bikes using nickel–metal hydroxide (NiMH), silicon, and lithium-polymer batteries. |
| Business-to-Business (B2B) | The sales of e-bikes to business customers such as urban fleet and logistics company, rental/sharing operators, last-mile fleet operators, and corporate fleet operators are considered under this category. |
| Business-to-Customers (B2C) | The sales of electric scooters and motorcycles to direct consumers is considered under this category. The consumers acquire these vehicles either directly from manufacturers or from other distributers and dealers through online and offline channel. |
| Unorganized Local OEMs | These players are small local manufacturers and assemblers of e-bikes. Most of these manufacturers import the components from China and Taiwan and assemble them locally. They offer the product at low cost in this price sensitive market which give them advantage over organized manufacturers. |
| Battery-as-a-Service | A business model in which the battery of an EV can be rented from a service provider or swapped with another battery when it runs out of charge |
| Dockless e-Bikes | Electric bikes that have self-locking mechanisms and a GPS tracking facility with an average top speed of around 15mph. These are mainly used by bike-sharing companies such as Bird, Lime, and Spin. |
| Electric Vehicle | A vehicle which uses one or more electric motors for propulsion. Includes cars, scooters, buses, trucks, motorcycles, and boats. This term includes all-electric vehicles and hybrid electric vehicles |
| Plug-in EV | An electric vehicle that can be externally charged and generally includes all-electric vehicles as well as plug-in hybrids. In this report we use the term for all-electric vehicles to differentiate them from plug-in hybrid electric vehicles. |
| Lithium-Sulphur Battery | A rechargeable battery that replaces the liquid or polymer electrolyte found in current lithium-ion batteries with sulfur. They have more capacity than Li-ion batteries. |
| Micromobility | Micromobility is one of the many modes of transport involving very-light-duty vehicles to travel short distances. These means of transportation include bikes, e-scooters, e-bikes, mopeds, and scooters. Such vehicles are used on a sharing basis for covering short distances, usually five miles or less. |
| Low Speed Electric Vehicls (LSEVs) | They are low speed (usually less than 25 kmph) light vehicles that do not have an internal combustion engine, and solely use electric energy for propulsion. |


Research Methodology
Mordor Intelligence follows a four-step methodology in all its reports.
- Step-1: Identify Key Variables: To build a robust forecasting methodology, the variables and factors identified in Step-1 are tested against available historical market numbers. Through an iterative process, the variables required for market forecast are set and the model is built based on these variables.
- Step-2: Build a Market Model: Market-size estimations for the historical and forecast years have been provided in revenue and volume terms. Market revenue is calculated by multiplying the volume demand with volume-weighted average battery pack price (per kWh). Battery pack price estimation and forecast takes into account various factors affecting ASP, such as inflation rates, market demand shifts, production costs, technological developments, and consumer preferences, providing estimations for both historical data and future trends.
- Step-3: Validate and Finalize: In this important step, all market numbers, variables, and analyst calls are validated through an extensive network of primary research experts from the market studied. The respondents are selected across levels and functions to generate a holistic picture of the market studied.
- Step-4: Research Outputs: Syndicated Reports, Custom Consulting Assignments, Databases & Subscription Platforms


