Market Overview
| Study Period | 2019 - 2031 |
|---|---|
| Forecast Data Period | 2026 - 2031 |
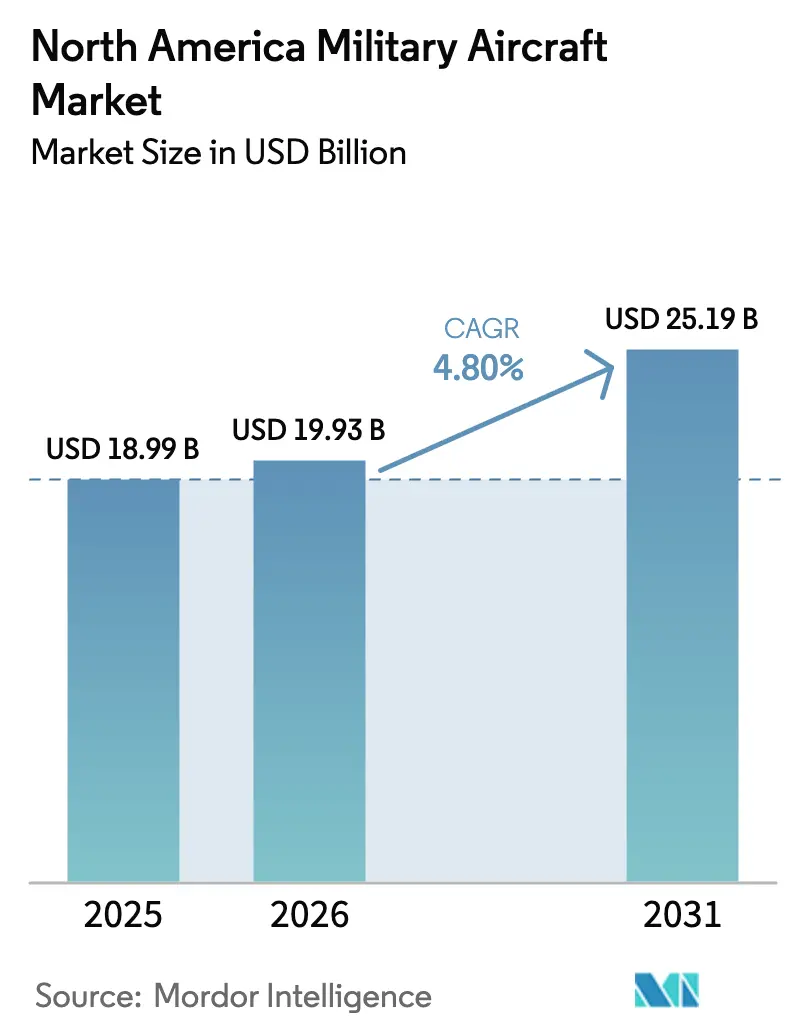
| Base Year Market Size (2025) | USD 18.99 Billion |
| Market Size (2026) | USD 19.93 Billion |
| Market Size (2031) | USD 25.19 Billion |
| Growth Rate (2026 - 2031) | 4.80% CAGR |
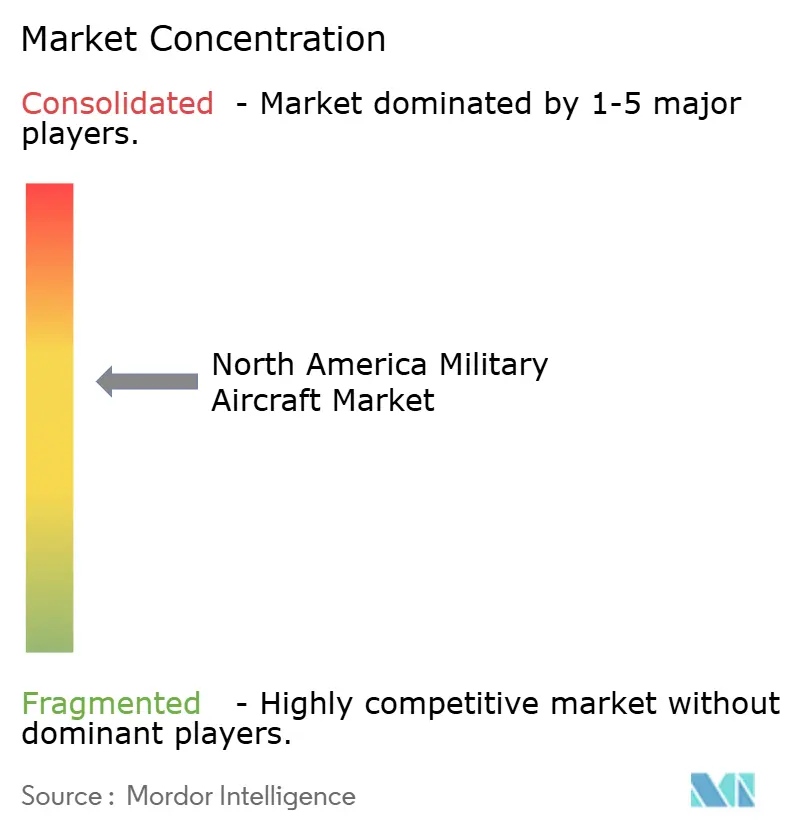
| Market Concentration | Medium |
Major Players *Disclaimer: Major Players sorted in no particular order Image © Mordor Intelligence. Reuse requires attribution under CC BY 4.0. | |
North America Military Aircraft Market Analysis by Mordor Intelligence
The North America military aircraft market size is expected to grow from USD 18.99 billion in 2025 to USD 19.93 billion in 2026 and is forecasted to reach USD 25.19 billion by 2031 at a 4.80% CAGR over 2026-2031. Sustained fleet modernization, recapitalization of aging aircraft, and steady adoption of advanced avionics, propulsion, and autonomy continue to shape how defense departments allocate procurement and sustainment budgets across the region. Production and delivery milestones on flagship programs, such as record F-35 output in 2025 and an accelerated B-21 capacity plan signed in early 2026, reinforce a dependable pipeline of new-build platforms that anchor demand. At the same time, an expanding installed base of fifth-generation fighters is shifting spending toward high-intensity aftermarket and mission-readiness activities, rewarding suppliers with repair, overhaul, and logistics capacity at scale. The US accounts for the dominant share of regional demand in 2025, with Canada’s fighter recapitalization and Mexico’s targeted helicopter and airlift buys broadening the scope of near-term opportunities.
Key Report Takeaways
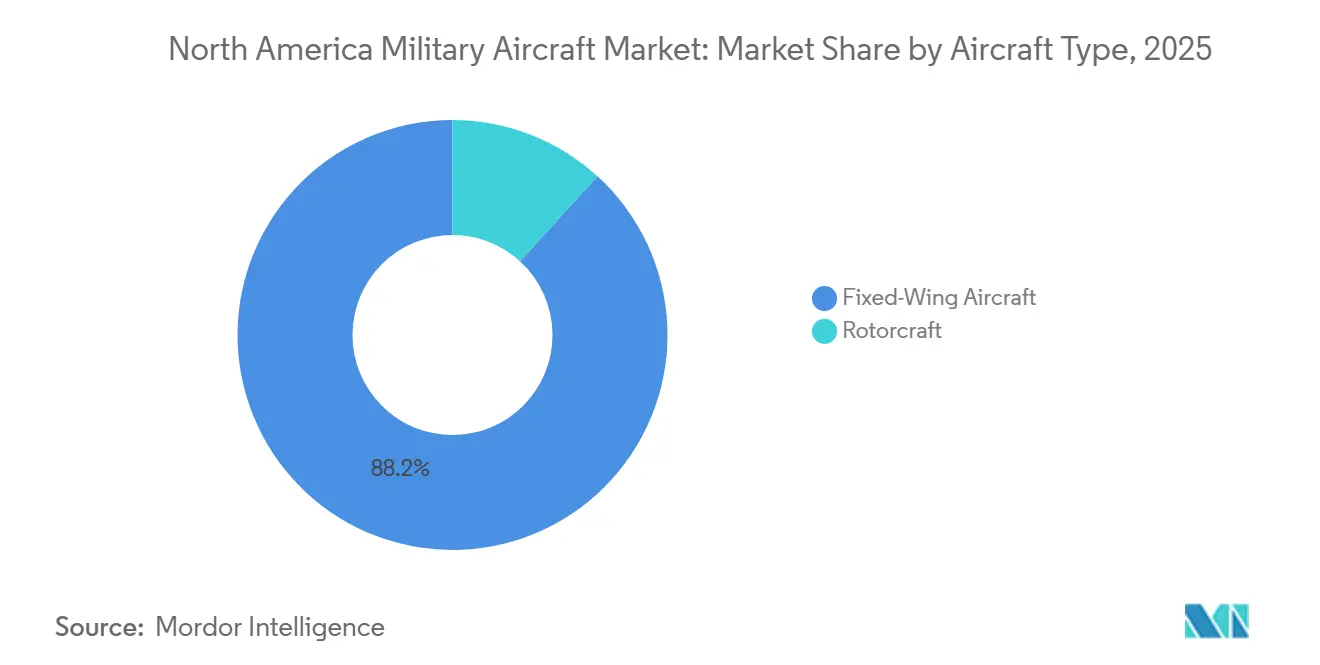
- By aircraft type, fixed-wing platforms led the North America military aircraft market with 88.21% market share in 2025, and it is expected to grow with a CAGR of 5.67% through 2031, supported by F-35 and B-21 activity.
- By end user, the Air Force held a 66.54% share in 2025, and is set to expand the North America military aircraft market at a 7.21% CAGR during 2026 to 2031.
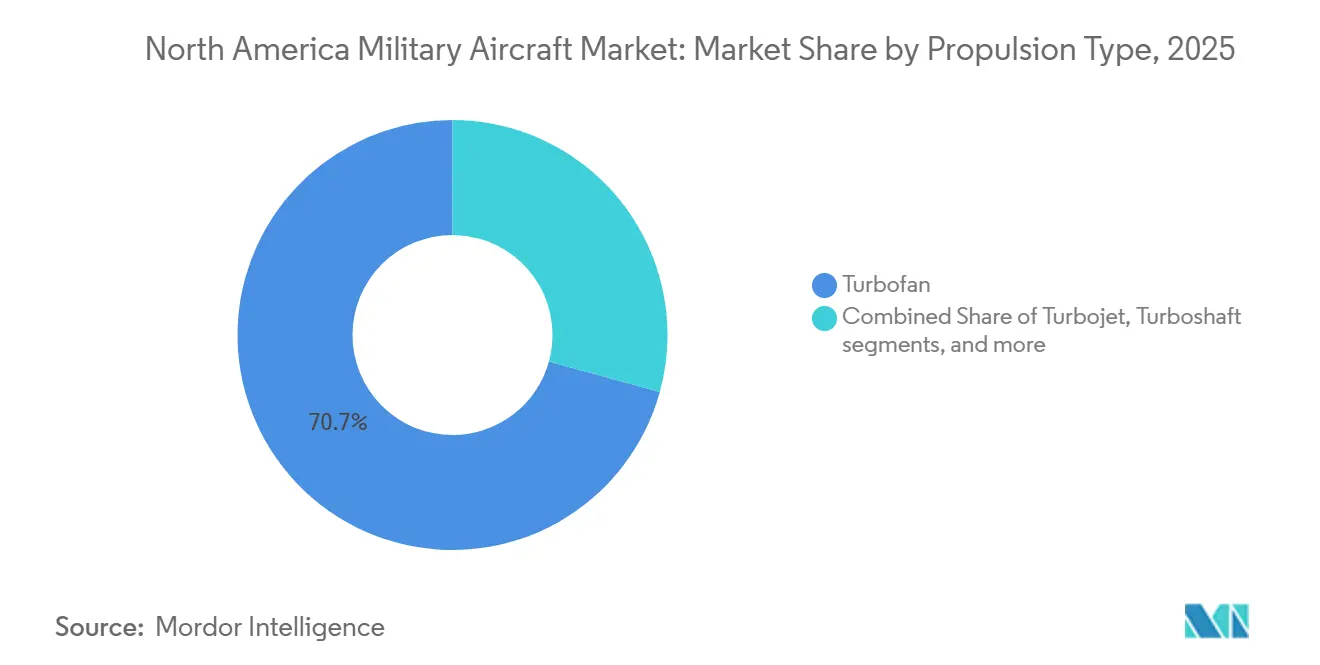
- By propulsion, turbofan engines commanded a 70.73% share of the North America military aircraft market in 2025, while fully electric and hybrid-electric systems are projected to be the fastest-growing at a 6.56% CAGR through 2031.
- By geography, the US held a 94.43% share in 2025, while the US outlook projects a 5.55% CAGR to 2031, as procurement remains focused on stealth platforms, tankers, and training fleets.
Note: Market size and forecast figures in this report are generated using Mordor Intelligence’s proprietary estimation framework, updated with the latest available data and insights as of January 2026.
North America Military Aircraft Market Trends and Insights
Drivers Impact Analysis*
| Driver | (~) % Impact on CAGR Forecast | Geographic Relevance | Impact Timeline |
|---|---|---|---|
| Sustainment-heavy F-35 program drives aftermarket demand | +1.2% | Global, with North America core US, Canada | Medium term (2-4 years) |
| The US National Defense Strategy boosts next-gen bomber and tanker budgets | +0.9% | United States primary, allied interoperability spill-over to Canada | Long term (≥ 4 years) |
| Canada’s Future Fighter Capability Project (FFCP) procurement | +0.4% | Canada, with ripple effects in US supply chain via industrial participation | Medium term (2-4 years) |
| Shift toward optionally-manned combat aircraft (loyal wingmen) | +0.8% | United States, expanding to Joint or NATO exercises | Short to Medium term (≤ 4 years) |
| Additive manufacturing of legacy parts cuts AOG time | +0.5% | North America-wide, particularly at MRO hubs Ogden, Oklahoma City, Warner Robins | Short term (≤ 2 years) |
| Modular open-systems avionics mandate accelerates retrofit cycles | +0.6% | United States USAF or USN mandates, Canada adopting via F-35 or CP-140 upgrades | Medium term (2-4 years) |
| Source: Mordor Intelligence | |||


Sustainment-Heavy F-35 Program Drives Aftermarket Demand
F-35 deliveries reached a program record in 2025, and the installed base is now pivoting regional spending toward sustainment, spares, and depot capacity, which is altering the revenue mix for primes and Tier 2 or 3 suppliers. The US Navy awarded a logistics support modification in late 2025 that covers global supply chains and fleet readiness through the early 2030s, a marker of the platform’s aftermarket intensity in the North America military aircraft market. Canada’s 88 F-35A acquisition embeds industrial participation in domestic sustainment work, extending to training devices and component overhaul, strengthening a cross-border MRO footprint. US Air Force mission-capable rates lagged service goals in FY2024, which heightened attention on technical data access, parts availability, and maintainer throughput to reduce aircraft-on-ground time and improve sortie generation. The scale of sustainment contracts and stockpiled spares initiatives underscores that aftermarket growth is now a central driver of the North America military aircraft market, even as production ramps continue.
The US National Defense Strategy Boosts Next-Gen Bomber and Tanker Budgets
Strategic deterrence priorities keep the KC-46 tanker and B-21 bomber at the forefront of US aircraft procurement, with the tanker program recording its 100th delivery in 2025 and securing additional lots despite earlier loss charges. The US Air Force signed a USD 4.5 billion agreement in early 2026 to expand B-21 production capacity, compressing schedules toward 2027 operational fielding and providing long-term visibility for suppliers in coatings, composites, and mission systems. Continued investment in adaptive propulsion and fuel-efficiency improvements for future platforms also supports lifecycle cost control while enabling range and payload advantages for next-generation missions. Taken together, these commitments underpin the demand outlook for the North America military aircraft market across long-cycle bomber and tanker fleets while reinforcing allied interoperability benefits for Canada.
Canada’s Future Fighter Capability Project Procurement
Canada’s fighter recapitalization plan brings 88 F-35As into service with training, infrastructure, and sustainment packages that extend into the 2030s, deepening integration with North America air defense architectures.[1]Staff Report, “Future Fighter Capability Project,” Government of Canada, canada.ca The program’s industrial participation creates durable work for Canadian suppliers in areas such as airframe sustainment, mission simulators, and electronic systems, which ties Canadian firms into broader F-35 logistics across the North America military aircraft market. Federal leadership articulated a defense industrial strategy focused on security, prosperity, and strategic autonomy, supporting policy continuity for fighter recapitalization and related sustainment. These dynamics feed the North America military aircraft market through a combination of direct procurement, allied interoperability, and long-term sustainment commitments linked to the F-35 enterprise.
Shift Toward Optionally-Manned Combat Aircraft Loyal Wingmen
The US planning has moved decisively toward teaming crewed fighters with lower-cost autonomous aircraft to augment strike, sensing, and electronic warfare in contested theaters. The Air Force’s Collaborative Combat Aircraft effort aligns with sixth-generation fighter development and is designed to improve survivability and capacity while distributing risk across expendable platforms. Propulsion suppliers are already shifting their portfolios toward smaller turbofans suited to attritable designs, with test campaigns in 2025 demonstrating performance improvements tailored to this class. The approach compresses sustainment tails relative to fourth and fifth-generation jets and elevates software and mission-system updates as the primary levers of capability refresh. As these programs transition from prototypes to early production, they create a new demand lane within the North America military aircraft market while reshaping how primes and suppliers align investments across hardware and software.
Restraints Impact Analysis*
| Restraint | (~) % Impact on CAGR Forecast | Geographic Relevance | Impact Timeline |
|---|---|---|---|
| Supply-chain titanium and composite shortages constrain ramp-ups | -0.7% | North America manufacturing hubs Seattle, Fort Worth, Palmdale, Montreal | Short to Medium term (≤ 4 years) |
| Congressional CRs delay long-lead funding releases | -0.6% | United States federal contracting, indirect impact on Canadian FMS timelines | Short term (≤ 2 years) |
| Skilled military aviation technician shortage | -0.5% | North America-wide, acute in USAF bases and Navy depot-level facilities | Medium term (2-4 years) |
| Noise and emissions caps near bases restrict flight-hour allocations | -0.3% | US bases near urban centers Whidbey Island, Westfield-Barnes, Fort Smith, limited Canada impact | Long term (≥ 4 years) |
| Source: Mordor Intelligence | |||
Supply-Chain Titanium and Composite Shortages Constrain Ramp-Ups
Titanium and advanced composite supply disruptions that peaked during 2025 lengthened lead times and raised costs, affecting production stability for transport, fighter, and rotorcraft lines. The KC-46 tanker incurred an additional loss charge in early 2026, which management linked to supply chain pressures, highlighting the margin sensitivity of fixed-price development and production contracts under material stress. Program managers increased reliance on digital manufacturing and additive strategies to reduce part counts and diversify materials, including 3D-printed fuel nozzles that use cobalt-chrome alloys in place of harder-to-source metals. While large primes can deploy vertical integration to mitigate risk, smaller suppliers face liquidity and working capital strains that can delay deliveries and stall ramp rates. These pressures temper top-line momentum in the North America military aircraft market and focus attention on supplier development and multi-year agreements to stabilize input costs.
Congressional CRs Delay Long-Lead Funding Releases
In fiscal year 2025, operations were conducted under a continuing resolution, which delayed obligations and deferred new-start programs, reducing program offices' ability to place long-lead orders and protect learning curves on key lines. Funding uncertainty also elevates second-order costs, as contractors either hold excess inventory or underutilize capacity, both of which erode unit economics. In this environment, multi-year procurement efficiencies are harder to achieve, which increases program costs and can stretch delivery schedules for tankers, fighters, and rotorcraft. These dynamics weigh on the pace of modernization inside the North America military aircraft market and amplify the value of steady appropriations that enable firm-fixed contracts and orderly supplier commitments. Training and maintenance programs also face disruption under CRs, putting more pressure on readiness and depot throughput in subsequent budget cycles.
*Our forecasts treat driver/restraint impacts as directional, not additive. The impact forecasts reflect baseline growth, mix effects, and variable interactions.
Segment Analysis
By Aircraft Type: Fixed-Wing Primacy Masks Rotorcraft Modernization Wave
Fixed-wing platforms accounted for 88.21% of the North America military aircraft market share in 2025 and are expected to grow at a CAGR of 5.67% through 2031, with year-end F-35 deliveries setting a record and low-rate B-21 production advancing, reinforcing the leadership of stealth and multi-role fleets. The market is further supported by life-extension programs for legacy jets that reduce recapitalization risk while adding connectivity and survivability upgrades. Service Life Modification programs extend fleet lives and sustain depot workload, and a large transport fleet centered on the C-130J secures intra-theater mobility demand across active and reserve components. Training aircraft procurement supports throughput for new pilots and instructor cadres, adding a steady tranche of orders that help maintain production continuity at key facilities.
Rotorcraft investment grows from a smaller base and is oriented toward heavy-lift, attack, and special-mission variants that backfill aircraft with high flight-hour intensity. Apache and Chinook orders in 2025 and 2026 sustained lines and funded block improvements, while Army future vertical-lift efforts position tiltrotors to shape long-term force design choices. Modernization paths that add range, payload, and network integration underpin program justification and support lifecycle upgrades that cascade into the sustainment ecosystem of the North America military aircraft market. Missionized derivatives for special operations, medical evacuation, and combat search and rescue retain premium configurations and reinforce rotorcraft’s role in distributed operations doctrines.


By End User Service: Air Force Dominates the Market
The Air Force held a 66.54% share of procurement in 2025 in the North America military aircraft market, and it is expected to grow at a CAGR of 7.21% during 2026-2031, reflecting the scale of its fighter, bomber, tanker, and training fleets aligned with Title 10 responsibilities. Budget plans in 2026 prioritize stealth bombers, tankers, training systems, and munitions that enable distributed operations and stand-in effects, stabilizing backlogs and supporting supplier visibility. The Navy and Marine Corps sustain carrier and amphibious aviation with new and remanufactured platforms, while heavy-lift rotorcraft provide a step-change in payload for expeditionary basing. Army aviation programs maintain utility and heavy-lift capacity alongside future lift programs that will improve speed and range.
Joint or Special Operations users showcase moderate growth, reflecting widespread adoption of teaming concepts, missionized rotorcraft, and long-endurance ISR. Investments in collaborative aircraft architectures allow manned fighters and bombers to extend reach and survivability by distributing risk across attritable platforms. Growth in this user segment reshapes the supplier mix in the North America military aircraft industry, creating opportunities for smaller propulsion, mission system, and autonomy providers.
By Propulsion Type: Turbofan Dominance Gives Way to Hybrid-Electric Pioneers
Turbofan engines captured a 70.73% share in 2025, as fighters, bombers, and tankers rely on this class for performance and survivability, anchoring the propulsion segment of the North America military aircraft market. Adaptive and hybrid-electric propulsion investments continued in 2025 and 2026, with major ground-test milestones targeting higher efficiency and more flexible thermal management, helping future airframes expand range and payload envelopes. Pratt & Whitney validated significant thrust gains on small-engine families for unmanned applications, indicating that attritable platforms are driving a shift in propulsion requirements. Turboprops remain central to tactical airlift and are valued for resilience at austere fields, preserving utility across humanitarian relief and defense logistics missions.
Fully electric and hybrid-electric propulsion is the fastest-growing category, with a 6.56% CAGR in the North America military aircraft market during 2026 to 2031, supported by Army-sponsored studies and collaborations on megawatt-class demonstrators. Investment from large aerospace firms into hybrid-electric architectures and turbogenerators signals potential crossover from regional and urban air mobility into military logistics and surveillance roles. Adoption timelines are governed by airworthiness and environmental qualification paths, which will pace near-term fielding. As certification matures, early movers in hybrid-electric technologies will gain an advantage in payload, range, and maintenance economics, adding new propulsion options to the North America military aircraft industry.
Geography Analysis
The US accounted for 94.43% of spending in 2025, driven by bomber, fighter, tanker, rotorcraft, training, and special mission portfolios. Procurement priorities in 2026 sustain funding for stealth platforms, tankers, and munitions while supporting training and sustainment to protect mission-capable rates. The US is also projected to grow at a 5.55% CAGR through 2031 as modernization persists and long-cycle platforms like the B-21 and KC-46 anchor the pipeline.
Canada’s fighter recapitalization delivers 88 F-35As, with training, basing, and sustainment activities phased over the decade, reinforcing binational integration under shared air defense frameworks. Industrial participation arrangements direct work to Canadian suppliers in simulation, MRO, and electronics, providing durable sustainment capacity. The government’s defense industrial strategy emphasizes both capability and economic security, which underwrites partner commitments while growing domestic aerospace participation.
Mexico resumed targeted modernization with new helicopters, a C-130J airlifter, and strategic UAVs, which strengthen civil support and security missions while restoring critical airlift and surveillance capacity.[2]Gastón Dubois, “Fuerza Aérea Mexicana anuncia la compra de 10 helicópteros,” Aviacionline, aviacionline.com The planned C-130J deliveries enhance disaster relief and humanitarian operations and create pathways for deeper interoperability with US and Canadian units during joint exercises.
Competitive Landscape
The North America military aircraft market reflects moderate consolidation at the prime level, with five large contractors accounting for a significant share of major awards in 2025, while competitive intensity remains high due to single-award structures. Lockheed Martin scaled F-35 deliveries through 2025 and secured large production lots, extending visibility for its fighter franchise and streamlining learning curves across final assembly and check-out. Northrop Grumman advanced the B-21 Raider with a USD 4.5 billion production capacity agreement in February 2026, securing long-lead investments in stealth manufacturing and coatings integration.[3]Greg Hadley, “Air Force Announces B-21 Production Deal,” Air & Space Forces Magazine, airandspaceforces.com Boeing balanced tanker deliveries with new awards for attack helicopters and service-life upgrades on carrier-based fighters, helping stabilize its defense backlog.
Strategy patterns show primes deepening vertical integration and digital engineering to compress schedules and improve manufacturability. Autonomy-focused firms are emphasizing software-first autonomy and open architectures that integrate rapidly with mission systems. Bell’s military unit reported higher revenue in 2025 as the Army’s next-generation lift program progressed toward early milestones. Engine and system suppliers are aligning with hybrid-electric roadmaps and small-thrust engines for loyal wingmen, while advancing megawatt-class demonstrators that can scale into logistics roles.
Recent awards highlight the long-term nature of bomber, tanker, and heavy-lift programs in the North America military aircraft market. Boeing’s dual awards for KC-46 tankers and AH-64E Apaches in late 2025, and Lockheed Martin’s expanded C-130J contract, sustain multiple production centers. The NGAD award to Boeing in March 2025 illustrates the importance of diversified portfolios across airframes, systems, and sustainment. Compliance with ITAR and DFARS, as well as cybersecurity maturity requirements, remains critical for contract execution and export opportunities.
North America Military Aircraft Industry Leaders
Airbus SE
Lockheed Martin Corporation
Northrop Grumman Corporation
Textron Inc.
The Boeing Company
- *Disclaimer: Major Players sorted in no particular order

Recent Industry Developments
- February 2026: Northrop Grumman Corporation and the US Air Force finalized a USD 4.5 billion agreement to expand B-21 Raider production capacity by 25%, to expedite delivery schedules and achieve operational deployment at Ellsworth Air Force Base, South Dakota, by 2027.
- December 2025: Lockheed Martin secured a USD 10 billion expansion to its C-130J Super Hercules contract with the US Air Force, raising the total program value for development, engineering, integration, and delivery through the 2030s.
- October 2025: In a deal valued at more than USD 173 million, the US Air Force awarded Boeing a contract to produce 8 additional MH-139A Grey Wolf helicopters and to provide training and sustainment support services.
- September 2025: Lockheed Martin and the F-35 Joint Program Office (JPO) finalized an agreement for lots 18-19, covering the production and delivery of up to 296 F-35 aircraft to expand the global fleet.


North America Military Aircraft Market Report Scope
A military aircraft is any aircraft that is operated by a nation’s armed forces for defense, combat, support, or training purposes. Unlike civilian aircraft (used for passengers or cargo), military aircraft are designed for missions such as combat, troop transport, intelligence gathering, or logistical support.
The North America military aircraft market is segmented by aircraft type, end user service, propulsion type, and geography. By aircraft type, the market is segmented into fixed-wing and rotorcraft. By end-user service, the market is classified into air force, army aviation, naval/marine corps aviation, joint/special operations, and paramilitary and coast guard. By propulsion type, the market is segmented into turbofan, turbojet, turboprop, turboshaft, and fully electric/hybrid-electric. The report also covers the market sizes and forecasts for the three countries for the North America military aircraft market across the region. For each segment, the market size is provided in terms of value (USD).
By Aircraft Type
| Fixed-Wing Aircraft | Multi-role Aircraft |
| Training Aircraft | |
| Transport Aircraft | |
| Other Aircraft | |
| Rotorcraft | Multi-Mission Helicopter |
| Transport Helicopter | |
| Other Helicopter |
By End-User Service
| Air Force |
| Army Aviation |
| Naval/Marine Corps Aviation |
| Joint/Special Operations |
| Paramilitary and Coast Guard |
By Propulsion Type
| Turbofan |
| Turbojet |
| Turboprop |
| Turboshaft |
| Fully Electric/Hybrid-Electric |
By Geography
| United States |
| Canada |
| Mexico |
| By Aircraft Type | Fixed-Wing Aircraft | Multi-role Aircraft |
| Training Aircraft | ||
| Transport Aircraft | ||
| Other Aircraft | ||
| Rotorcraft | Multi-Mission Helicopter | |
| Transport Helicopter | ||
| Other Helicopter | ||
| By End-User Service | Air Force | |
| Army Aviation | ||
| Naval/Marine Corps Aviation | ||
| Joint/Special Operations | ||
| Paramilitary and Coast Guard | ||
| By Propulsion Type | Turbofan | |
| Turbojet | ||
| Turboprop | ||
| Turboshaft | ||
| Fully Electric/Hybrid-Electric | ||
| By Geography | United States | |
| Canada | ||
| Mexico | ||


Market Definition
- Aircraft Type - All the military aircraft and rotorcraft which are used for various applications are included in this study.
- Sub-Aircraft Type - For this study, sub-aircraft types such as fixed-wing aircraft and rotorcraft based on their application are considered.
- Body Type - Multi-Role Aircraft, Transport, Training Aircraft, Bombers, Reconnaissance Aircraft, Multi-Mission Helicopters, Transport Helicopters and various other aircraft and rotorcraft are considered in this study.
| Keyword | Definition |
|---|---|
| IATA | IATA stands for the International Air Transport Association, a trade organization composed of airlines around the world that has an influence over the commercial aspects of flight. |
| ICAO | ICAO stands for International Civil Aviation Organization, a specialized agency of the United Nations that supports aviation and navigation around the globe. |
| Air Operator Certificate (AOC) | A certificate granted by a National Aviation Authority permitting the conduct of commercial flying activities. |
| Certificate Of Airworthiness (CoA) | A Certificate Of Airworthiness (CoA) is issued for an aircraft by the civil aviation authority in the state in which the aircraft is registered. |
| Gross Domestic Product (GDP) | Gross domestic product (GDP) is a monetary measure of the market value of all the final goods and services produced in a specific time period by countries. |
| RPK (Revenue Passenger Kilometres) | The RPK of an airline is the sum of the products obtained by multiplying the number of revenue passengers carried on each flight stage by the stage distance - it is the total number of kilometers traveled by all revenue passengers. |
| Load Factor | The load factor is a metric used in the airline industry that measures the percentage of available seating capacity that has been filled with passengers. |
| Original Equipment Manufacturer (OEM) | An original equipment manufacturer (OEM) traditionally is defined as a company whose goods are used as components in the products of another company, which then sells the finished item to users. |
| International Transportation Safety Association (ITSA) | International Transportation Safety Association (ITSA) is an international network of heads of independent safety investigation authorities (SIA). |
| Available Seats Kilometre (ASK) | This metric is calculated by multiplying Available Seats (AS) in one flight, defined above, multiplied by the distance flown. |
| Gross Weight | The fully-loaded weight of an aircraft, also known as “takeoff weight,” which includes the combined weight of passengers, cargo, and fuel. |
| Airworthiness | The ability of an aircraft, or other airborne equipment or system, to operate in flight and on the ground without significant hazard to aircrew, ground crew, passengers or to other third parties. |
| Airworthiness Standards | Detailed and comprehensive design and safety criteria applicable to the category of aeronautical product (aircraft, engine or propeller). |
| Fixed Base Operator (FBO) | A business or organization that operates at an airport. An FBO provides aircraft operating services like maintenance, fueling, flight training, charter services, hangaring, and parking. |
| High Net worth Individuals (HNWIs) | High Net worth Individuals (HNWIs) are individuals with over USD 1 million in liquid financial assets. |
| Ultra High Net worth Individuals (UHNWIs) | Ultra High Net worth Individuals (UHNWIs) are individuals with over USD 30 million in liquid financial assets. |
| Federal Aviation Administration (FAA) | The division of the Department of Transportation is concerned with aviation. It operates Air Traffic Control and regulates everything from aircraft manufacturing to pilot training to airport operations in the United States. |
| EASA (European Aviation Safety Agency) | The European Aviation Safety Agency is a European Union agency established in 2002 with the task of overseeing civil aviation safety and regulation. |
| Airborne Warning and Control System (AW&C) aircraft | Airborne Warning and Control System (AEW&C) aircraft is equipped with a powerful radar and on-board command and control center to direct the armed forces. |
| The North Atlantic Treaty Organization (NATO) | The North Atlantic Treaty Organization (NATO), also called the North Atlantic Alliance, is an intergovernmental military alliance between 30 member states – 28 European and two North American. |
| Joint Strike Fighter (JSF) | Joint Strike Fighter (JSF) is a development and acquisition program intended to replace a wide range of existing fighter, strike, and ground attack aircraft for the United States, the United Kingdom, Italy, Canada, Australia, the Netherlands, Denmark, Norway, and formerly Turkey. |
| Light Combat Aircraft (LCA) | A light combat aircraft (LCA) is a light, multirole jet/turboprop military aircraft, commonly derived from advanced trainer designs, designed for engaging in light combat. |
| Stockholm International Peace Research Institute (SIPRI) | Stockholm International Peace Research Institute (SIPRI) is an international institute that provides data, analysis, and recommendations for armed conflict, military expenditure, and arms trade as well as disarmament and arms control. |
| Maritime Patrol Aircraft (MPA) | A maritime patrol aircraft (MPA), also known as maritime reconnaissance aircraft is a fixed-wing aircraft designed to operate for long durations over water in maritime patrol roles, in particular, anti-submarine warfare (ASW), anti-ship warfare (AShW), and search and rescue (SAR). |
| Mach Number | The Mach number is defined as the ratio of true airspeed to the speed of sound at the altitude of a given aircraft. |
| Stealth Aircraft | Stealth is a Common term applied to low observable (LO) technology and doctrine, that makes an aircraft near invisible to radar, infrared or visual detection. |


Research Methodology
Mordor Intelligence follows a four-step methodology in all our reports.
- Step-1: Identify Key Variables: In order to build a robust forecasting methodology, the variables and factors identified in Step-1 are tested against available historical market numbers. Through an iterative process, the variables required for market forecast are set and the model is built on the basis of these variables.
- Step-2: Build a Market Model: Market-size estimations for the historical and forecast years have been provided in revenue and volume terms. For sales conversion to volume, the average selling price (ASP) is kept constant throughout the forecast period for each country, and inflation is not a part of the pricing.
- Step-3: Validate and Finalize: In this important step, all market numbers, variables and analyst calls are validated through an extensive network of primary research experts from the market studied. The respondents are selected across levels and functions to generate a holistic picture of the market studied.
- Step-4: Research Outputs: Syndicated Reports, Custom Consulting Assignments, Databases & Subscription Platforms


