Market Overview
| Study Period | 2020 - 2031 |
|---|---|
| Forecast Data Period | 2026 - 2031 |
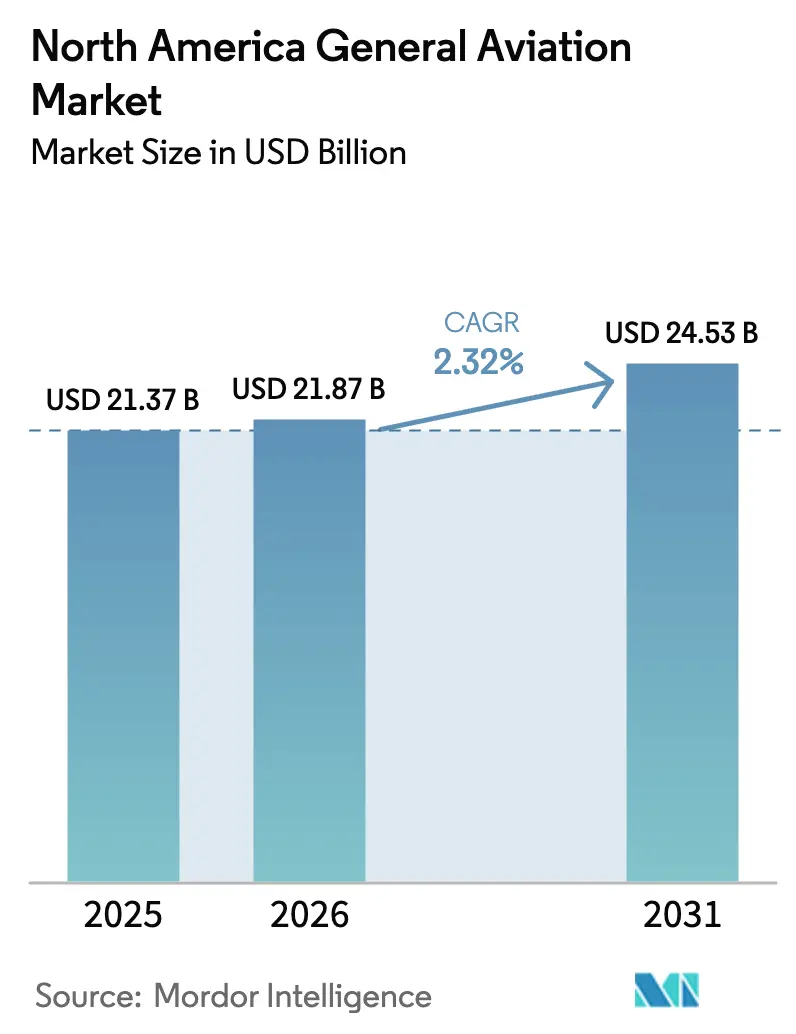
| Base Year Market Size (2025) | USD 21.37 Billion |
| Market Size (2026) | USD 21.87 Billion |
| Market Size (2031) | USD 24.53 Billion |
| Growth Rate (2026 - 2031) | 2.32% CAGR |
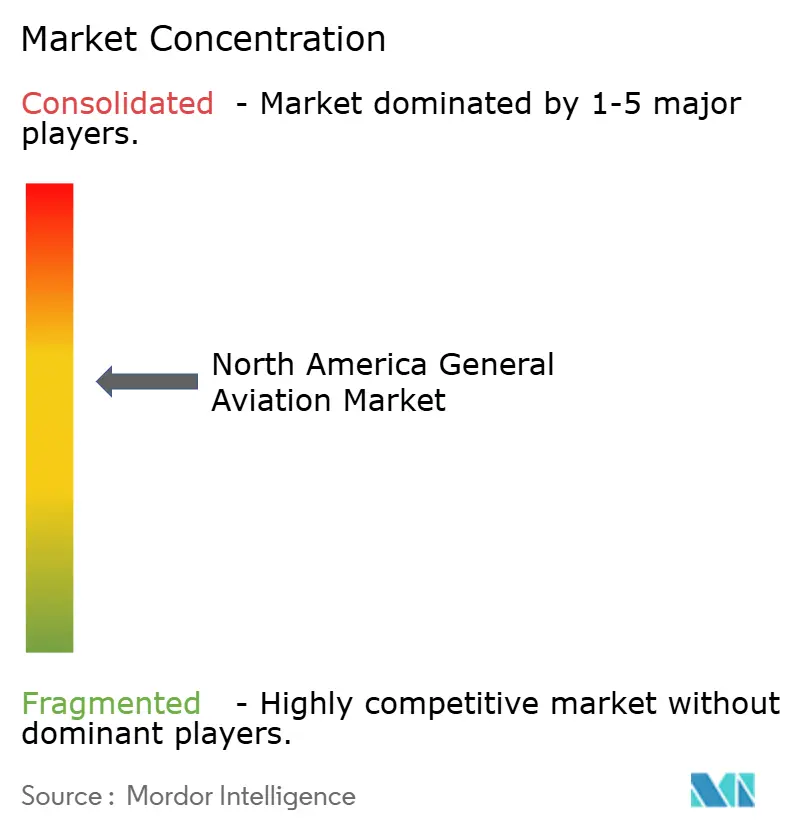
| Market Concentration | Medium |
Major Players *Disclaimer: Major Players sorted in no particular order Image © Mordor Intelligence. Reuse requires attribution under CC BY 4.0. | |
North America General Aviation Market Analysis by Mordor Intelligence
The North America General Aviation market size is expected to grow from USD 21.37 billion in 2025 to USD 21.87 billion in 2026 and is forecast to reach USD 24.53 billion by 2031 at 2.32% CAGR over 2026-2031.
Current momentum stems from steady high-net-worth individual demand, corporate emphasis on time-saving travel, and selective fleet upgrades rather than broad volume expansion. Piston fixed-wing aircraft remain foundational for training and personal use, yet advanced air mobility (AAM) programs have introduced a new growth pocket as certification frameworks solidify. Meanwhile, conventional piston and turbine propulsion keep a commanding lead in installed base, although electric and hybrid systems are steadily gaining traction. Overall, the North American general aviation market benefits from a resilient user base, backlog-driven production schedules, and emerging asset-light service models that keep utilization rates high while tempering new-build volumes.
Key Report Takeaways
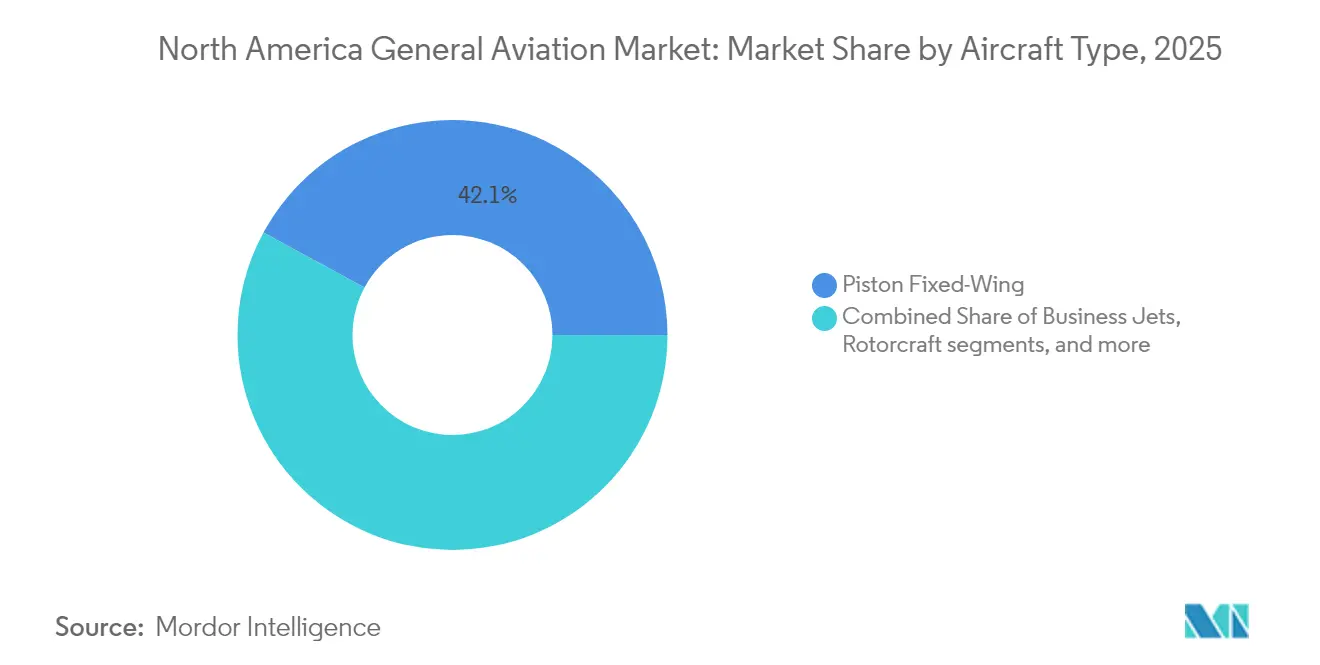
- By aircraft type, piston fixed-wing captured 42.10% of the North America general aviation market share in 2025; AAM eVTOLs are forecasted to grow at a 5.26% CAGR to 2031.
- By propulsion type, conventional piston and turbine systems accounted for 91.10% share of the North America general aviation market size in 2025, but all-electric propulsion is advancing at a 5.05% CAGR through 2031.
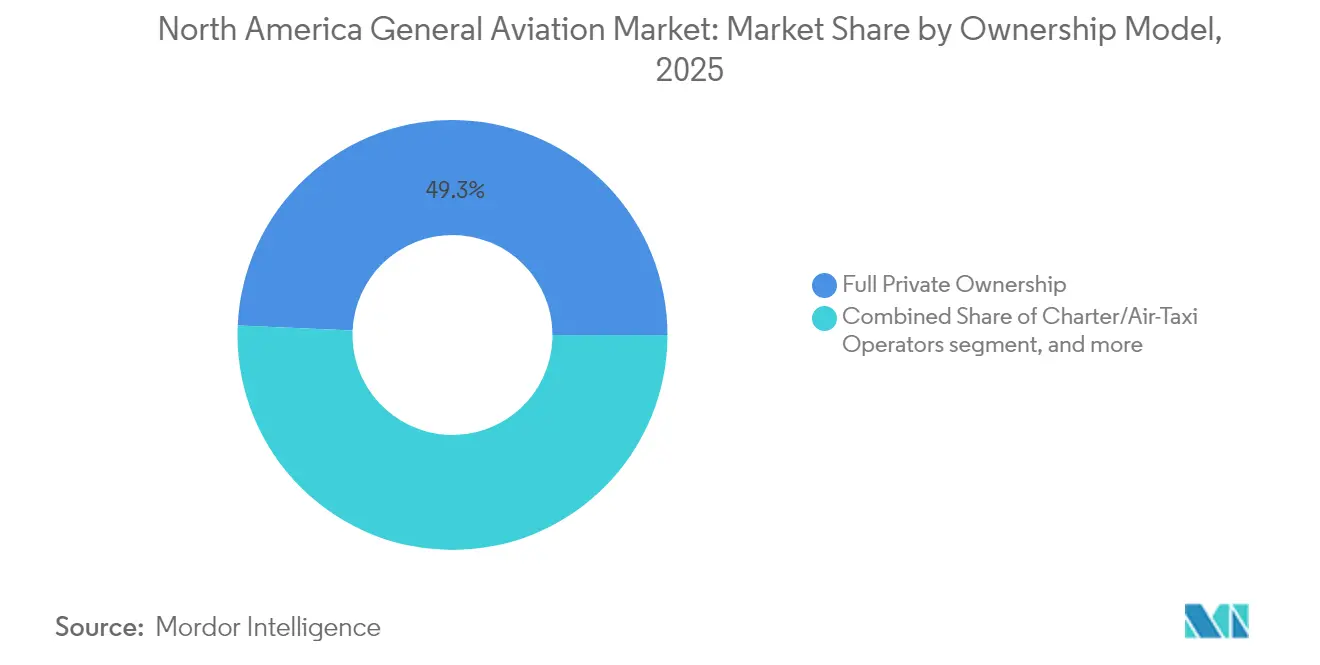
- By ownership model, full private ownership held 49.30% of the North America general aviation market in 2025, while charter and air-taxi operators are poised for a 6.65% CAGR between 2026 and 2031.
- By end-user application, business and corporate transport recorded 41.90% leadership in 2025, yet emergency medical and air-ambulance services are on track for a 5.74% CAGR through 2031.
- By geography, the United States led with 70.65% revenue share in 2025, while Mexico is projected to expand at a 4.19% CAGR through 2031.
Note: Market size and forecast figures in this report are generated using Mordor Intelligence’s proprietary estimation framework, updated with the latest available data and insights as of 2026.
North America General Aviation Market Trends and Insights
Driver Impact Analysis*
| Driver | (~) % Impact on CAGR Forecast | Geographic Relevance | Impact Timeline |
|---|---|---|---|
| Rising HNWI populace and corporate profits | +0.8% | United States and Canada, spillover to Mexico | Medium term (2-4 years) |
| Fleet modernization and replacement cycles | +0.6% | North America-wide, concentrated in the US | Long term (≥ 4 years) |
| Rise of charter and fractional ownership models | +0.4% | United States primarily, expanding to Canada | Medium term (2-4 years) |
| Regulatory support for advanced air mobility (AAM) | +0.3% | United States and Canada, early adoption phases | Long term (≥ 4 years) |
| Growing demand for special-mission ISR and wildfire surveillance | +0.2% | Western US and Canada, seasonal variations | Short term (≤ 2 years) |
| Expansion of sustainable aviation-fuel infrastructure | +0.1% | Major US airports, limited Canadian presence | Long term (≥ 4 years) |
| Source: Mordor Intelligence | |||


Rising HNWI Populace and Corporate Profits
Asset appreciation in technology and financial services continues to swell the pool of ultra-high-net-worth buyers, sustaining demand for large-cabin jets even as macroeconomic indicators cool. Corporate flight departments logged 15% higher aircraft utilization in 2024 versus pre-pandemic levels, a shift attributed to urgent senior-executive travel and the inadequacy of commercial schedules for regional city pairs.[1]Business Aviation Insider, “Corporate Aviation Utilization Reaches New Heights in 2024,” BusinessAviationInsider.com Private-equity and investment-banking firms expanded aviation budgets by 22% over 2023, accelerating fleet replacement decisions favoring connectivity-rich, fuel-efficient models. The resulting premium-aircraft demand cushions production rates for major OEMs and supports aftermarket retrofits that upgrade older platforms with in-flight connectivity and performance packages. Consequently, the North American general aviation market gains a steady replacement-driven revenue stream despite its maturity phase.
Fleet Modernization and Replacement Cycles
The average North American general aviation aircraft is 28.5 years old, making avionics obsolescence and mandated equipment upgrades central catalysts for new purchases.[2]Aircraft Owners and Pilots Association, “General Aviation Fleet Modernization Trends,” AOPA.org Operators eyeing NextGen compliance find retrofit costs can exceed 40% of hull value, pushing them toward factory-new aircraft that integrate glass cockpits, flight-management systems, and ADS-B Out as standard. Backlogs for popular turboprops and light jets now stretch 18-24 months, underscoring the depth of replacement demand even amid elevated sticker prices. Financing institutions have responded with longer amortization schedules, smoothing cash-flow hurdles for owner-operators. This modernization wave not only enlarges the installed base of technically advanced aircraft but also bolsters service revenues as sophisticated avionics require OEM-authorized maintenance capabilities across the region.
Rise of Charter and Fractional Ownership Models
Fractional operators posted 28% membership growth in 2024, validating the asset-light value proposition for companies unwilling to shoulder full ownership costs.[3]Fractional Ownership Report, “North American Fractional Growth Analysis 2024,” FractionalOwnershipReport.com Charter platforms recorded 35% higher booking volumes as digital apps reduced search frictions and delivered transparent pricing to first-time users. Flight hours per airframe in these fleets average 800 annually, quadrupling the utilization typical of private owners, reinforcing recurring maintenance, fuel, and crewing demand. Simultaneously, OEMs benefit from higher cycle counts that shorten replacement timelines, feeding a virtuous demand loop for newer, more efficient aircraft. The trend reshapes the North America general aviation market by emphasizing service access over asset accumulation, ensuring that utilization-driven economics, rather than sheer fleet count, guide expansion strategies.
Regulatory Support for AAM
Publication of the Special Federal Aviation Regulation for powered-lift aircraft in October 2024 created a credible certification roadmap that unlocked significant investor capital for eVTOL programs.[4]Federal Aviation Administration, “Special Federal Aviation Regulation for Powered-Lift Aircraft,” FAA.gov Manufacturers such as Joby and Archer attracted over USD 800 million in fresh funding after the rulemaking, accelerating prototyping and proving-ground flights in Los Angeles and Miami corridors. The regulation’s alignment with existing pilot-licensing pathways limits the training barrier, supporting early commercial launch scenarios that integrate with present-day heliport and GA airport infrastructure. Municipalities now evaluate vertiport zoning and noise standards, signaling municipal-level buy-in critical for public acceptance. While revenue contribution remains modest, the framework de-risks first-mover investments and positions advanced air mobility as a medium-term booster for the North America general aviation market.
Restraint Impact Analysis*
| Restraint | (~) % Impact on CAGR Forecast | Geographic Relevance | Impact Timeline |
|---|---|---|---|
| High acquisition and operating costs | -0.5% | North America-wide, acute in Canada | Short term (≤ 2 years) |
| Stringent noise and emission regulations | -0.4% | United States and Canada, urban airports most affected | Medium term (2-4 years) |
| Pilot and maintenance-technician shortages | -0.3% | United States and Canada, rural areas most affected | Medium term (2-4 years) |
| ATC modernization delays for low-altitude corridors | -0.2% | United States primarily, urban air mobility zones | Long term (≥ 4 years) |
| Source: Mordor Intelligence | |||
High Acquisition and Operating Costs
Supply-chain pressures lifted new turboprop sticker prices above USD 4 million and business jets above USD 8 million by 2024, adding a cost hurdle for owner-operators. Fuel, insurance, and hangar fees also rose faster than consumer inflation; major-city hangar rentals climbed 25%, while insurance premiums increased due to higher hull values and liability considerations. Training schools felt the squeeze most acutely, as higher lease costs ripple through tuition and threaten pilot-pipeline sustainability. Corporate buyers can absorb price escalations, but individual cost sensitivity has tempered entry-level piston aircraft orders. Therefore, the North American general aviation market faces a near-term affordability drag that most affects grassroots utilization and instructional activity.
Pilot and Maintenance-technician Shortages
The FAA projects a deficit of 18,000 general-aviation pilots by 2030, magnified by retirements and airlines courting experienced aviators with premium pay. Maintenance skill gaps mirror the pilot shortfall; advanced avionics and composite structures demand specialized training that many vocational programs do not yet offer. Charter operators now report trip refusals due to crew unavailability, and corporate departments compete on signing bonuses and flexible schedules to retain talent. Technician scarcity lengthens downtime and raises labor rates for maintenance shops, inflating direct operating costs for fleet owners. Unless apprenticeship pipelines expand, the shortage poses a structural restraint to flight-hour growth in the North American general aviation market.
*Our forecasts treat driver/restraint impacts as directional, not additive. The impact forecasts reflect baseline growth, mix effects, and variable interactions.
Segment Analysis
By Aircraft Type: eVTOL Emergence Adds a Disruptive Tier
The piston fixed-wing category retained 42.10% leadership in 2025, underscoring its cost-effective role in flight training and personal transportation. The AAM eVTOL segment is scaling at a 5.26% CAGR as certification progresses and urban operators refine route economics. The North America general aviation market size for eVTOL platforms is still modest. Yet, momentum has redirected venture funding from traditional rotorcraft toward tiltrotor and compound designs that promise lower direct operating costs per mile. Rotorcraft applications diversify into wildfire surveillance and emergency medical missions, where vertical lift excels. Business jets continue anchoring corporate-travel demand, even though fractional and charter models temper unit deliveries. Turboprop performance on regional sectors benefits from compatibility with sustainable aviation fuel, sustaining relevance amid environmental scrutiny.


By Propulsion Type: Electric Transition Gains Momentum
Conventional piston and turbine powerplants commanded 91.10% share in 2025, a testament to mature supply chains, wide-area fuel availability, and well-known maintenance regimes. All-electric configurations, though small in absolute terms, register the fastest 5.05% CAGR as improved battery energy density aligns with short-range mission profiles. Hybrid-electric architectures have emerged as a technical bridge, delivering incremental fuel-burn savings without sacrificing range, appealing to charter fleets that prize both economy and dispatch reliability. The North America general aviation market size for fully electric trainers grows as schools seek quieter operations and lower per-hour operating costs, particularly in dense suburban areas where noise abatement is critical.
By Ownership Model: Service-based Access Overtakes Asset Emphasis
Full private ownership still accounts for 49.30% of the share, reflecting legacy perceptions of flexibility and status. Yet charter and air-taxi operators are scaling at 6.65% CAGR as digital aggregators normalize on-demand bookings and corporations avoid balance-sheet asset exposure. Fractional programs draw midsize enterprises that require predictable access at transparent hourly rates, whereas training and academic institutions maintain stable though capital-constrained fleets. Government and special-mission agencies preserve dedicated aircraft for law enforcement and disaster response, functions ill-suited to commercial models.
By End-User Application: Emergency Services Outpace Corporate Baseline
Business and corporate transport secured a 41.90% share in 2025, underlining enduring executive-travel priorities that favor flexibility and time savings. However, emergency medical and air-ambulance operations exhibit a 5.74% CAGR as aging populations and rural hospital closures elevate the need for rapid patient transfer. ISR and wildfire surveillance flights grow with climate-driven disaster frequency, whereas personal leisure flying contracts marginally due to cost pressures and pilot-training complexities. Pilot-training activity remains a vital pipeline but experiences consolidation as schools merge or partner with airlines for cadet pathways.
Geography Analysis
The US commands 70.65% of total activity, thanks to its dense airport network, supportive regulatory environment, and concentration of corporate wealth. Corporate shuttle routes, fractional-fleet bases, and the majority of eVTOL test corridors all reside within the US borders, giving domestic OEMs and operators scale advantages. Canada maintains a steady demand anchored by resource-sector logistics, air-ambulance services for remote communities, and harsh-weather testing facilities that attract OEM cold-soak campaigns. Mexico, though smaller in absolute volume, records the fastest 4.19% CAGR, propelled by multinational manufacturing investments that require reliable executive travel and by a burgeoning high-net-worth cohort in Mexico City and Monterrey.
Infrastructure differentials shape growth trajectories. The US airports benefit from well-capitalized FBO chains and extensive MRO networks, compressing turnaround times and enabling higher aircraft utilization. Canada’s vast geography necessitates STOL-capable aircraft and creates natural markets for turboprops and helicopters that thrive in austere conditions. Conversely, Mexico’s expansion focuses on upgrading business-aviation terminals at major hubs and streamlining customs processes to attract cross-border charter traffic. Regulatory harmonization edges forward under USMCA frameworks, yet maintenance licensing and pilot certification disparities continue to inhibit fleet interoperability.
AAM initiatives further accentuate geographic nuances. The US metropolitan areas, such as Los Angeles and Miami, advance vertiport planning and community-noise studies, positioning for early commercial eVTOL operations once initial airframes achieve type certification. Canadian authorities explore UAM applications for remote communities, prioritizing cargo and medical outreach over urban commuting. Mexican regulators observe these developments and assess adaptation timelines that align with national air-traffic-management modernization. As such, geographic segmentation introduces differentiated opportunity sets that diversify revenue streams within the North America general aviation market.
Competitive Landscape
The market features moderate concentration: Textron, Bombardier, and Embraer collectively span most fixed-wing segments, while Gulfstream and Dassault occupy the ultra-long-range niche. Helicopter supply remains more fragmented among Bell, Sikorsky, and Robinson, and eVTOL entrants such as Joby and Archer introduce fresh competitive vectors. Established OEMs leverage vertical integration, expanding parts distribution and maintenance programs to secure aftermarket annuities and counterbalance cyclical aircraft sales. For instance, Textron’s 2025 expansion of its Wichita plant aims to reduce Cessna Citation backlogs by 15%, reinforcing its midsize-jet dominance.
Strategic partnerships highlight overlapping ambitions. Embraer’s tie-in with Eve Air Mobility targets UAM service deployment, reflecting how traditional manufacturers hedge against disruptive entrants. Bombardier’s 2024 acquisition of Learjet service assets enlarges its aftermarket footprint, complementing its flagship Global series. Boeing’s earlier takeover of Aurora Flight Sciences and Lockheed Martin’s surveillance-aircraft ventures illustrate how aerospace primes view general aviation-adjacent technologies as capability multipliers. Meanwhile, charter platforms negotiate bulk purchase agreements that secure delivery slots and volume discounts, reshaping OEM order books toward service providers rather than individual buyers.
Technology insertion accelerates competitive turnover. Cabin IoT suites, ultra-high-speed satcom, and flight-deck automation distinguish next-generation models, pressuring older fleets’ residual values. Sustainability credentials also emerge as competitive factors; OEMs publicize SAF compatibility percentages and hybrid-propulsion roadmaps to court environmentally conscious buyers. Against this backdrop, the North American general aviation market encourages simultaneous incremental upgrades among incumbents and bold leaps by newcomers, fostering a dynamic yet moderately concentrated competitive field.
North America General Aviation Industry Leaders
Bombardier Inc.
Textron Inc.
Cirrus Design Corporation (Aviation Industry Corporation of China)
Gulfstream Aerospace Corporation (General Dynamics Corporation)
Embraer S.A.
- *Disclaimer: Major Players sorted in no particular order

Recent Industry Developments
- October 2025: During a partial federal government shutdown, the US Department of Homeland Security (DHS) awarded a contract worth approximately USD 172 million to procure two Gulfstream G700 business jets. This decision has faced criticism from lawmakers, raising concerns about the government's spending priorities.
- March 2025: Metro Aviation, a prominent player in the emergency medical services (EMS) sector, signed an agreement with Airbus Helicopters to acquire up to 36 H140 helicopters. Metro Aviation is among the first customers for the newly launched H140 helicopter, which was introduced at the VERTICON vertical lift industry exhibition in Dallas, Texas.
- June 2023: Gulfstream Aerospace Corp. announced the expansion of its completions and outfitting operations at St. Louis Downtown Airport. With this expansion, Gulfstream is expected to increase completion operations at the site while modernizing its existing spaces by adding new, state-of-the-art equipment and tooling, representing a total capital investment of USD 28.5 million.


North America General Aviation Market Report Scope
By Aircraft Type
| Business Jets | Large Jet |
| Mid-Size Jet | |
| Light/Very-Light Jet | |
| Turboprop Fixed-Wing | |
| Piston Fixed-Wing | |
| Rotorcraft | |
| Advanced Air Mobility eVTOLs |
By Propulsion Type
| Conventional Piston/Turbine |
| Hybrid-Electric |
| All-Electric |
By Ownership Model
| Full Private Ownership |
| Fractional Ownership |
| Charter/Air-Taxi Operators |
| Training and Academic Institutions |
| Government and Special-Mission Operators |
By End-User Application
| Business/Corporate Transport |
| Personal and Leisure Flying |
| Special Mission (ISR, Surveillance, Law Enforcement) |
| Emergency Medical/Air-Ambulance |
| Pilot Training |
By Geography
| United States |
| Canada |
| Mexico |
| By Aircraft Type | Business Jets | Large Jet |
| Mid-Size Jet | ||
| Light/Very-Light Jet | ||
| Turboprop Fixed-Wing | ||
| Piston Fixed-Wing | ||
| Rotorcraft | ||
| Advanced Air Mobility eVTOLs | ||
| By Propulsion Type | Conventional Piston/Turbine | |
| Hybrid-Electric | ||
| All-Electric | ||
| By Ownership Model | Full Private Ownership | |
| Fractional Ownership | ||
| Charter/Air-Taxi Operators | ||
| Training and Academic Institutions | ||
| Government and Special-Mission Operators | ||
| By End-User Application | Business/Corporate Transport | |
| Personal and Leisure Flying | ||
| Special Mission (ISR, Surveillance, Law Enforcement) | ||
| Emergency Medical/Air-Ambulance | ||
| Pilot Training | ||
| By Geography | United States | |
| Canada | ||
| Mexico |


Market Definition
- Aircraft Type - General Aviation includes aircraft used for corporate aviation, business aviation and other aerial works.
- Sub-Aircraft Type - Business Jets, Piston Fixed-Wing Aircraft, and helicopters and turboprop aircraft are taken into consideration.
- Body Type - Light Jets, Mid-Size Jets, and Large Jets according to their ability to carry passengers and flying distance ranges have been included under this study.
| Keyword | Definition |
|---|---|
| IATA | IATA stands for the International Air Transport Association, a trade organization composed of airlines around the world that has an influence over the commercial aspects of flight. |
| ICAO | ICAO stands for International Civil Aviation Organization, a specialized agency of the United Nations that supports aviation and navigation around the globe. |
| Air Operator Certificate (AOC) | A certificate granted by a National Aviation Authority permitting the conduct of commercial flying activities. |
| Certificate Of Airworthiness (CoA) | A Certificate Of Airworthiness (CoA) is issued for an aircraft by the civil aviation authority in the state in which the aircraft is registered. |
| Gross Domestic Product (GDP) | Gross domestic product (GDP) is a monetary measure of the market value of all the final goods and services produced in a specific time period by countries. |
| RPK (Revenue Passenger Kilometres) | The RPK of an airline is the sum of the products obtained by multiplying the number of revenue passengers carried on each flight stage by the stage distance - it is the total number of kilometers traveled by all revenue passengers. |
| Load Factor | The load factor is a metric used in the airline industry that measures the percentage of available seating capacity that has been filled with passengers. |
| Original Equipment Manufacturer (OEM) | An original equipment manufacturer (OEM) traditionally is defined as a company whose goods are used as components in the products of another company, which then sells the finished item to users. |
| International Transportation Safety Association (ITSA) | International Transportation Safety Association (ITSA) is an international network of heads of independent safety investigation authorities (SIA). |
| Available Seats Kilometre (ASK) | This metric is calculated by multiplying Available Seats (AS) in one flight, defined above, multiplied by the distance flown. |
| Gross Weight | The fully-loaded weight of an aircraft, also known as “takeoff weight,” which includes the combined weight of passengers, cargo, and fuel. |
| Airworthiness | The ability of an aircraft, or other airborne equipment or system, to operate in flight and on the ground without significant hazard to aircrew, ground crew, passengers or to other third parties. |
| Airworthiness Standards | Detailed and comprehensive design and safety criteria applicable to the category of aeronautical product (aircraft, engine or propeller). |
| Fixed Base Operator (FBO) | A business or organization that operates at an airport. An FBO provides aircraft operating services like maintenance, fueling, flight training, charter services, hangaring, and parking. |
| High Net worth Individuals (HNWIs) | High Net worth Individuals (HNWIs) are individuals with over USD 1 million in liquid financial assets. |
| Ultra High Net worth Individuals (UHNWIs) | Ultra High Net worth Individuals (UHNWIs) are individuals with over USD 30 million in liquid financial assets. |
| Federal Aviation Administration (FAA) | The division of the Department of Transportation is concerned with aviation. It operates Air Traffic Control and regulates everything from aircraft manufacturing to pilot training to airport operations in the United States. |
| EASA (European Aviation Safety Agency) | The European Aviation Safety Agency is a European Union agency established in 2002 with the task of overseeing civil aviation safety and regulation. |
| Airborne Warning and Control System (AW&C) aircraft | Airborne Warning and Control System (AEW&C) aircraft is equipped with a powerful radar and on-board command and control center to direct the armed forces. |
| The North Atlantic Treaty Organization (NATO) | The North Atlantic Treaty Organization (NATO), also called the North Atlantic Alliance, is an intergovernmental military alliance between 30 member states – 28 European and two North American. |
| Joint Strike Fighter (JSF) | Joint Strike Fighter (JSF) is a development and acquisition program intended to replace a wide range of existing fighter, strike, and ground attack aircraft for the United States, the United Kingdom, Italy, Canada, Australia, the Netherlands, Denmark, Norway, and formerly Turkey. |
| Light Combat Aircraft (LCA) | A light combat aircraft (LCA) is a light, multirole jet/turboprop military aircraft, commonly derived from advanced trainer designs, designed for engaging in light combat. |
| Stockholm International Peace Research Institute (SIPRI) | Stockholm International Peace Research Institute (SIPRI) is an international institute that provides data, analysis, and recommendations for armed conflict, military expenditure, and arms trade as well as disarmament and arms control. |
| Maritime Patrol Aircraft (MPA) | A maritime patrol aircraft (MPA), also known as maritime reconnaissance aircraft is a fixed-wing aircraft designed to operate for long durations over water in maritime patrol roles, in particular, anti-submarine warfare (ASW), anti-ship warfare (AShW), and search and rescue (SAR). |
| Mach Number | The Mach number is defined as the ratio of true airspeed to the speed of sound at the altitude of a given aircraft. |
| Stealth Aircraft | Stealth is a Common term applied to low observable (LO) technology and doctrine, that makes an aircraft near invisible to radar, infrared or visual detection. |


Research Methodology
Mordor Intelligence follows a four-step methodology in all our reports.
- Step-1: Identify Key Variables: In order to build a robust forecasting methodology, the variables and factors identified in Step-1 are tested against available historical market numbers. Through an iterative process, the variables required for market forecast are set and the model is built on the basis of these variables.
- Step-2: Build a Market Model: Market-size estimations for the historical and forecast years have been provided in revenue and volume terms. For sales conversion to volume, the average selling price (ASP) is kept constant throughout the forecast period for each country, and inflation is not a part of the pricing.
- Step-3: Validate and Finalize: In this important step, all market numbers, variables and analyst calls are validated through an extensive network of primary research experts from the market studied. The respondents are selected across levels and functions to generate a holistic picture of the market studied.
- Step-4: Research Outputs: Syndicated Reports, Custom Consulting Assignments, Databases & Subscription Platforms


