
Market Overview
| Study Period | 2020 - 2031 |
|---|---|
| Forecast Data Period | 2026 - 2031 |
| Base Year Market Size (2025) | USD 1.17 Billion |
| Market Size (2026) | USD 1.39 Billion |
| Market Size (2031) | USD 3.35 Billion |
| Growth Rate (2026 - 2031) | 19.18 % |
| Market Concentration | Medium |
Major Players *Disclaimer: Major Players sorted in no particular order Image © Mordor Intelligence. Reuse requires attribution under CC BY 4.0. | |
North America LiDAR Market Analysis by Mordor Intelligence
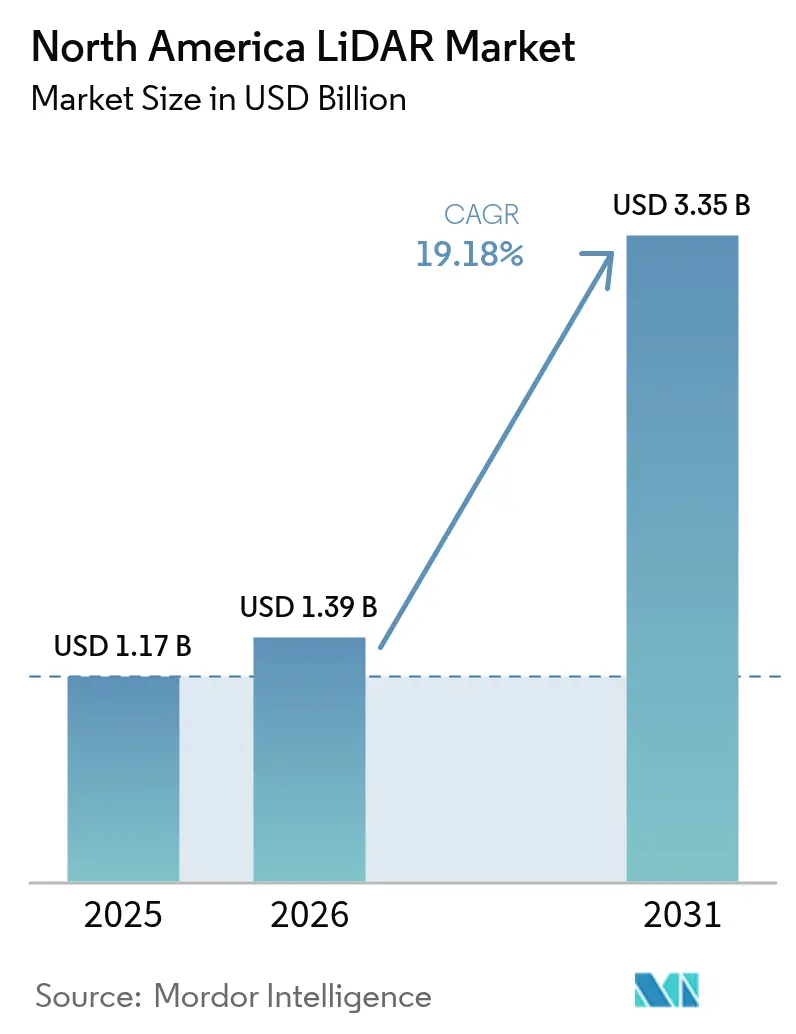
North America LiDAR market size in 2026 is estimated at USD 1.39 billion, growing from 2025 value of USD 1.17 billion with 2031 projections showing USD 3.35 billion, growing at 19.18% CAGR over 2026-2031. Demand accelerates as solid-state breakthroughs shrink sensor size and cost, federal infrastructure programs mandate precise asset data, and BVLOS drone corridors expand aerial mapping. Automotive OEMs are locking LiDAR into Level 3 autonomy packages, while forestry and utility agencies adopt the technology for wildfire-risk modelling and grid inspections. Price declines, sensor-fusion innovation, and rising environmental monitoring needs collectively sustain double-digit growth. Competitive intensity rises as consolidated suppliers’ pair bespoke software with chip-level hardware to protect margins amid falling average selling prices. [1]U.S. White House, “Infrastructure Investment and Jobs Act Funding Dashboard,” whitehouse.gov
Key Report Takeaways
- By application, automotive led with 37.20% revenue share in 2025; government agencies are projected to grow at a 23.1% CAGR through 2031.
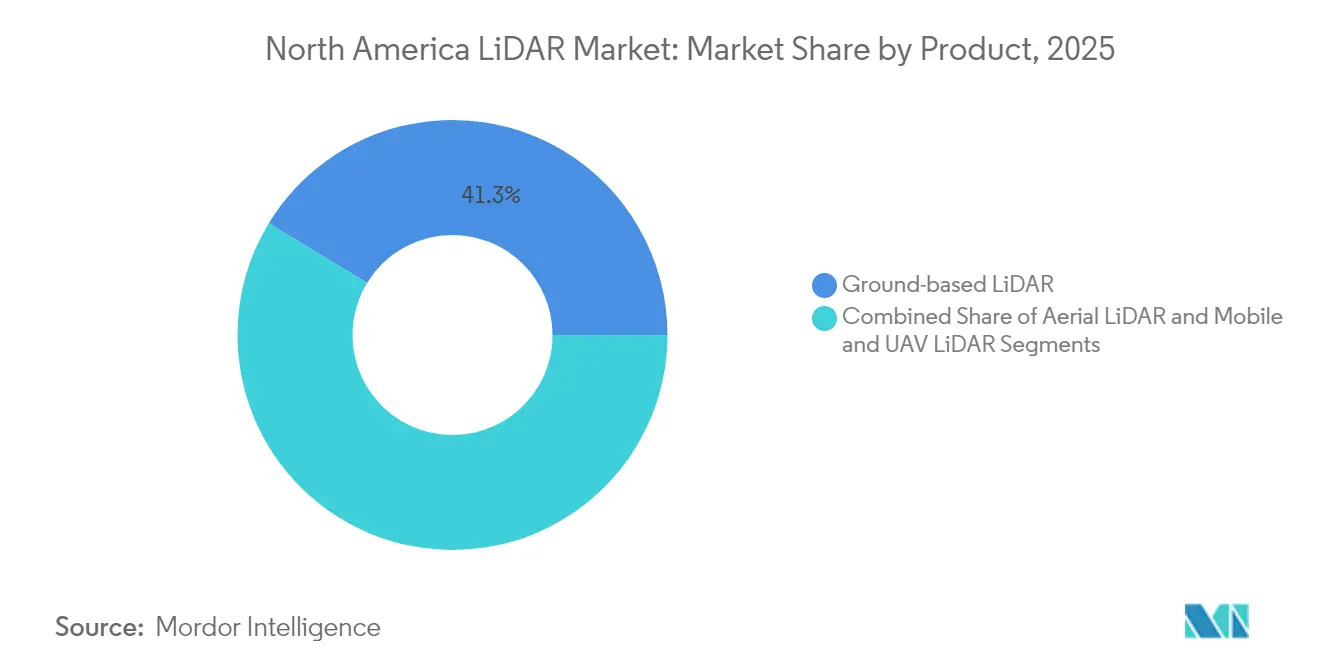
- By product, ground-based systems captured 41.30% of North America LiDAR market share in 2025, whereas mobile and UAV platforms are poised for a 24.2% CAGR to 2031.
- By type, mechanical units held 62.10% share of the North America LiDAR market size in 2025, while solid-state sensors are set to expand at 21.2% CAGR between 2026-2031.
- By range, medium-range units accounted for 47.40% share of the North America LiDAR market size in 2025; short-range devices are growing fastest at 26.1% CAGR.
- By component, laser scanners commanded 45.30% share in 2025, yet inertial measurement units will register the highest 21% CAGR through 2031.
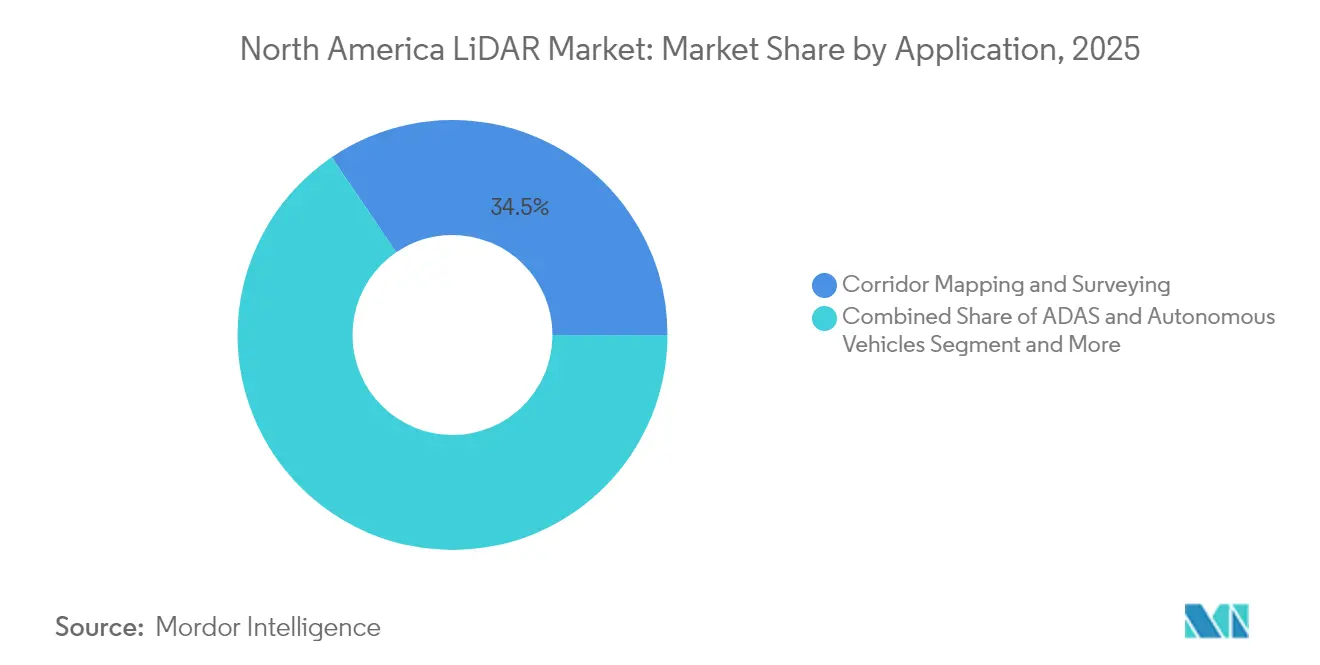
- By application, corridor mapping and surveying held 34.50% share in 2025; ADAS and autonomous driving use cases are rising at 22.2% CAGR.
- By geography, the United States contributed 80.50% of 2025 revenue, whereas Mexico is forecast to post the highest 20.3% CAGR to 2031.
Note: Market size and forecast figures in this report are generated using Mordor Intelligence’s proprietary estimation framework, updated with the latest available data and insights as of 2026.
North America LiDAR Market Trends and Insights
Drivers Impact Analysis*
| Driver | (~) % Impact on CAGR Forecast | Geographic Relevance | Impact Timeline |
|---|---|---|---|
| Rapid integration of solid-state LiDAR in Level-3 autonomous vehicle programs by U.S. OEMs | 4.20% | United States, with spillover to Canada and Mexico | Medium term (2-4 years) |
| FAA BVLOS waivers accelerating commercial drone corridor mapping demand in Canada | 2.80% | Canada, with cross-border applications to U.S. | Short term (≤ 2 years) |
| Surging investments in digital-twin projects for aging U.S. transportation infrastructure | 3.10% | United States, concentrated in major metropolitan areas | Long term (≥ 4 years) |
| LiDAR-enriched Smart-Corridor initiatives under U.S. IIJA funding (2024-2028) | 3.50% | United States, with demonstration projects in multiple states | Medium term (2-4 years) |
| Early-mover adoption of LiDAR-embedded ADAS by electric-truck makers to meet stricter FMCSA safety mandates | 2.90% | United States and Canada, with Mexico following | Medium term (2-4 years) |
| North-American forestry & environmental agencies pivoting to LiDAR for wildfire-risk modelling post-2023 mega-fires | 2.00% | Western United States and Canada, with expansion eastward | Long term (≥ 4 years) |
| Source: Mordor Intelligence | |||
Solid-State LiDAR Integration Accelerates Automotive Production Programs
Solid-state sensors are moving from limited pilots into mainstream production programs. Luminar’s series supply on Volvo’s EX90 confirms OEM confidence in higher reliability and reduced mechanical complexity. BMW’s i7 and Volkswagen’s ID.Buzz integrate Innoviz units for Level 3 capability, while Toyota reports chip-level cost reductions that open mid-segment adoption. Hesai’s 37% global automotive share underscores how scale economics force price competition. As unit economics improve, the North America LiDAR market embeds sensors in electric pickups to satisfy forthcoming FMCSA automatic emergency braking rules for heavy vehicles. [2]Volvo Cars, “EX90 to Feature Standard Luminar LiDAR,” volvocars.com
BVLOS Drone Operations Transform Infrastructure Monitoring
Transport Canada’s 2025 RPAS regulations authorize medium-sized drones for beyond-visual-line-of-sight operations, enabling cost-effective LiDAR corridor mapping in remote provinces. FAA Part 107 waivers mirror this flexibility south of the border, accelerating utility and rail inspections. NOAA’s high-altitude BVLOS campaigns demonstrate operational maturity, while commercial operators deploy lightweight scanners on eVTOL craft to survey thousands of kilometres per flight. Resulting data reduces manual inspection costs and fuels cloud-based digital twins for asset managers. [3]Federal Aviation Administration, “Part 107 BVLOS Waiver Approvals,” faa.gov
Digital Twin Infrastructure Projects Drive Long-Term Demand
The IIJA allocates USD 54 million to SMART grants that embed LiDAR into digital construction management workflows. Eight state DOTs deploy scan-to-BIM processes for bridges and pavements, leveraging USGS 3D Elevation Program baselines. AI-augmented twins combine LiDAR point clouds with traffic telemetry to predict structural fatigue and optimize maintenance budgets. Universities partner with city agencies to refine twin fidelity, ensuring sustained sensor procurement through 2030.
Smart-Corridor Initiatives Leverage Federal Infrastructure Funding
SMART recipients across 23 states use USD 130 million to connect V2X roadside units with vehicle on-board sensors. Arizona’s USD 19.6 million grant links 750 roadside units to 400 trucks, relying on LiDAR fusion for lane-level accuracy. Similar deployments in Ohio and Michigan create contiguous testbeds that standardize interfaces, accelerating scale manufacturing. Vendors supplying corridor projects secure multi-year revenue visibility, supporting aggressive capacity expansions.
Restraints Impact Analysis*
| Restraint | (~) % Impact on CAGR Forecast | Geographic Relevance | Impact Timeline |
|---|---|---|---|
| Persistent price-premium vs. radar/vision in mass-produced L2+ vehicles | -2.80% | North America-wide, particularly affecting mass-market automotive | Medium term (2-4 years) |
| Skilled-talent scarcity in LiDAR data processing delaying state-DOT projects | -1.90% | United States and Canada, concentrated in technical centers | Long term (≥ 4 years) |
| Export-control restrictions on high-performance lasers limiting Canadian aerospace suppliers | -1.50% | Canada, with spillover effects to cross-border supply chains | Medium term (2-4 years) |
| Post-merger procurement uncertainty after Velodyne-Ouster consolidation | -1.20% | North America-wide, affecting enterprise and government procurement | Short term (≤ 2 years) |
| Source: Mordor Intelligence | |||
Cost Competitiveness Challenges Limit Mass-Market Penetration
LiDAR units still cost three to five times more than radar alternatives, deterring inclusion in sub-USD 30,000 vehicles. Luminar’s Halo roadmap targets a 50% price cut, yet mainstream parity remains elusive before 2028. Chinese suppliers such as Hesai pressure margins through lower labour costs and vertically integrated optics. North American factories respond with automation, but depreciation schedules constrain rapid price movements in the North America LiDAR market. [4]National Highway Traffic Safety Administration, “Preliminary Cost Assessment of Active Safety Sensors,” nhtsa.gov
Workforce Development Gaps Constrain Project Execution
Advanced point-cloud classification demands software skills that remain scarce. FARO’s restructuring cited talent hurdles, and state DOTs outsource processing at premium rates, inflating project budgets. Semiconductor labour studies forecast a 10% shortfall in photonics engineers by 2027. Universities expand geomatics programs, yet slow graduation pipelines extend capacity gaps, delaying revenue realization in the North America LiDAR market.
*Our forecasts treat driver/restraint impacts as directional, not additive. The impact forecasts reflect baseline growth, mix effects, and variable interactions.
Segment Analysis
By Product: Mobile Solutions Drive Innovation Beyond Traditional Ground-Based Systems
Ground-based systems held 41.30% of 2025 revenue in the North America LiDAR market. Continued demand for high-accuracy construction staking anchors sales, yet the segment’s growth lags at low-double-digit rates. Contractors value tripod-mounted units for repeatable benchmarks during highway widening and bridge retrofits. However, rental models from ClearSkies Geomatics reduce ownership barriers, trimming manufacturer margins but enlarging the installed base.
Mobile and UAV platforms grow at 24.2% CAGR as agencies digitize linear assets. RIEGL-based VTOL drones cover transmission lines 10 times faster than terrestrial teams, supporting utilities facing wildfire liability. Phase One’s integrated camera-laser pods cut flight hours 40%, enhancing ROI. As survey firms embed robust IMUs to stabilize data, fleet operators win multi-year inspection contracts, feeding sustained sensor orders. This migration boosts share for agile suppliers and elevate service revenues across the North America LiDAR market.



By Type: Solid-State Technology Reshapes Manufacturing Economics
Mechanical architectures still command 62.10% share of the North America LiDAR market size in 2025 thanks to proven range and established supply chains. Rotating mirror designs service highway mapping vans and airborne bathymetric surveys where 360-degree coverage outweighs durability concerns. Yet maintenance intervals and assembly complexity inflate lifecycle costs.
Solid-state variants post 21.2% CAGR as wafer-level optics deliver fewer moving parts. Kyocera’s fusion sensor merges camera and LiDAR layers for parallax-free perception, attractive to OEMs demanding slimmer housings. Hexagon’s single-photon module pushes 14 million points per second, enabling fast corridor scans from mid-altitude aircraft. As volume scales, per-unit cost is projected to reach parity with mechanical peers by 2028, shifting design wins toward chip-integrated suppliers within the North America LiDAR market.
By Range: Short-Range Applications Accelerate Through Industrial Automation
Medium-range units between 100-300 m deliver 47.40% of 2025 sales, underpinning highway autonomy and rail monitoring. Their balance of cost and detection distance suits autonomous shuttles navigating suburban arterials. Adaptive optics adjust focus as speed varies, conserving power.
Short-range sensors under 100 m advance at 26.1% CAGR, led by warehouse automation and last-mile robotics. MicroVision’s MOVIA module addresses logistics tugs that require centimetre-level depth in confined aisles. Manufacturing integrators deploy ring-mounted arrays on robotic arms to streamline pick-and-place, propelling new revenue for component vendors. Conversely, long-range units above 300 m stay niche for defense surveillance and atmospheric research, where high-power lasers justify premium pricing in the North America LiDAR market.
By Component: Sensor Fusion Drives IMU Growth Beyond Traditional Laser Dominance
Laser scanners made up 45.30% of 2025 component revenue. Performance improvements in pulse repetition and eye-safety maintain dominance, yet price pressure persists. Suppliers now bundle onboard DSP to offload edge computing for autonomous platforms.
IMUs expand fastest at 21% CAGR as precise orientation becomes critical for mobile mapping. VIAVI’s USD 150 million purchase of Inertial Labs signals strategic value in merging photonics and inertial technologies. Integrated packages pairing GNSS, camera, and LiDAR streamline calibration, trimming survey cycle times. Growth in mixed-modal systems fortifies component sales as buyers seek turnkey kits across the North America LiDAR market.
By Application: ADAS Development Outpaces Traditional Surveying Markets
Corridor mapping led with a 34.50% share in 2025, driven by interstate rehabilitation and utility rights-of-way audits. DOTs mandate centimetre-grade deliverables, sustaining demand for high-density scanners. Engineering firms integrate point clouds with BIM to prioritize bridge deck repairs, extending asset life.
ADAS and autonomous driving grow 22.2% CAGR on stronger safety regulations. Heavy truck makers standardize roof-line units to comply with proposed automatic braking mandates, while passenger EVs integrate low-profile sensors behind windshields. Caterpillar’s Command haulage solution adopts Luminar sensors to automate mines, illustrating diversification beyond on-road transport. Cross-sector knowledge transfer fuels software advances, broadening addressable use cases inside the North America LiDAR market.
By End-User: Government Agencies Accelerate Adoption Through Infrastructure Investments
Automotive customers commanded 37.20% of 2025 revenue as OEMs raced for Level 3 certification. Procurement contracts span entire model cycles, ensuring predictable volumes. Tier-1 suppliers lock multiyear deals with Innoviz and Luminar, embedding sensors into wiring harnesses during assembly.
Government agencies post the fastest 23.1% CAGR. SMART grants finance statewide point-cloud capture, while NASA’s selection of Ouster’s OS-1-64 underscores trust in commercial hardware. Forestry services deploy airborne scanners for wildfire fuels analysis, and municipal planners adopt tripod units for smart-city design. Public spending underpins baseline demand, cushioning cyclical swings in private construction and stabilizing the North America LiDAR market.
Geography Analysis
The United States produced 80.50% of 2025 revenue for the North America LiDAR market, anchored by automotive R&D clusters and USD 432 billion in IIJA transportation funding. Federal proposals requiring automatic emergency braking on heavy trucks catalyze sensor retrofits, while state DOTs digitize highways using construction management software that depends on dense point-clouds. Domestic production ramps as Luminar scales its Florida fab to meet Volvo and Mercedes contracts, reducing reliance on Asian optics.
Canada contributes smaller volume today yet benefits from Transport Canada’s 2025 BVLOS regulations that unlock long-distance drone mapping. Forestry ministries contract fixed-wing platforms to monitor biomass, and energy utilities survey Arctic pipelines where manned flights prove risky. Export controls on certain high-performance lasers add procurement complexity, but public safety exemptions support wildfire response programs, sustaining sensor shipments inside the North America LiDAR market.
Mexico records a 20.3% CAGR through 2031 as near-shoring reshapes automotive supply chains. Luminar’s Nuevo León facility supplies global Volvo lines, leveraging USMCA rules to avoid tariffs. Federal highway concessions invest in LiDAR-based pavement management to extend concession lifecycles, while state universities partner with U.S. labs on autonomous bus pilots. Accelerated industrial investment shifts regional component sourcing southward, broadening market access for cost-sensitive buyers.
Regulatory Landscape
In the United States, LiDAR adoption for automated driving is shaped by NHTSA and USDOT oversight, with safety transparency and data access requirements tightening as ADS deployments expand. In January 2025, NHTSA proposed the AV STEP (ADS-equipped Vehicle Safety, Transparency, and Evaluation Program) through the Federal Register, indicating a more formal national framework for ADS-equipped vehicle evaluation and the availability of safety-related information.
Regulatory alignment also runs through international standards activity, as NHTSA opened a January 2026 notice and request for comment related to a proposed United Nations Global Technical Regulation for Automated Driving Systems under UNECE WP.29/GRVA. On the trade and security side, LiDAR has been incorporated into U.S. trade tools such as Section 301 tariffs (notably referenced at 25% in past actions for LiDAR under HTS 9015.80.20). Separately, 2026 legislative activity, for example S. 4000, the Securing Infrastructure from Adversaries Act of 2026, points to additional compliance scrutiny for federal procurement and contracting tied to LiDAR origin and supplier eligibility.
Value Chain Analysis
The North America LiDAR value chain spans laser sources, optics and receivers, scanning and packaging architectures (mechanical and solid-state), embedded compute and firmware, and point-cloud software stacks that turn raw returns into usable perception or mapping outputs. In automotive-grade programs, requirements for functional safety, cybersecurity, and quality systems push manufacturers to standardize modules (laser scanners, IMUs, GNSS, cameras) into calibrated sensor-fusion kits and to deepen relationships with Tier-1s and platform partners.
Manufacturing and fulfillment increasingly combine in-house design with contract electronics manufacturing and multi-site capacity strategies to manage cost, quality, and delivery timelines. This shift is visible in June 2026, when Ouster expanded its long-term manufacturing partnership with Benchmark Electronics to support high-volume production of its Rev8 digital LiDAR family. Downstream, integrators and service providers (survey, corridor mapping, utilities, warehousing, and robotics) connect LiDAR hardware to cloud processing and digital-twin workflows, while design wins and mass-production nominations for global OEM platforms shape order visibility and component sourcing for North American operations.
Competitive Landscape
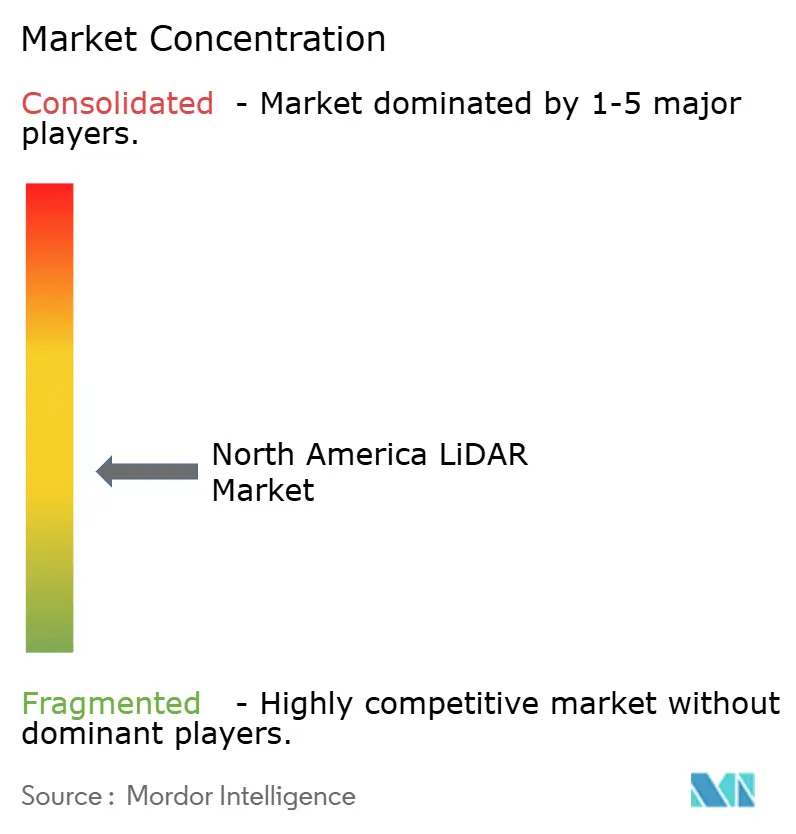
The North America LiDAR market shows moderate fragmentation with technology, cost, and integration strategies dividing players. Ouster’s consolidation of Velodyne boosts economies of scale, yet luminaries like Luminar differentiate through long-range solid-state performance. Hesai leverages Shenzhen production efficiency, claiming 37% global automotive share, putting price pressure on incumbents. Tier-1 suppliers including Continental embed NVIDIA compute for turnkey autonomous stacks, bundling LiDAR within larger contracts.
Acquisition activity signals maturation. VIAVI’s purchase of Inertial Labs merges photonics and inertial expertise, while Kraken Robotics’ buyout of 3D at Depth opens subsea niches. Chip-level disruptors such as Lidwave secure venture capital to shrink bill-of-materials and push software-defined capabilities. Ecosystem partnerships grow: Aurora taps Continental and NVIDIA to mass-produce driverless trucks by 2027, evidencing system-level competition rather than sensor-only contests within the North America LiDAR market.
North America LiDAR Industry Leaders
Ouster Inc.
Teledyne Optech
Trimble Inc.
Leica Geosystems AG
Innoviz Technologies
- *Disclaimer: Major Players sorted in no particular order

Market Opportunities and Future Outlook
Infrastructure digitization and smart-corridor deployments under active U.S. IIJA programs, including SMART grants in the 2024-2028 window, create a sustained procurement pathway for LiDAR across state DOTs, contractors, and software partners building scan-to-BIM and digital-twin workflows. This setting supports opportunities for bundled offerings that combine mobile and UAV capture, calibrated sensor-fusion kits (LiDAR plus IMU/GNSS/cameras), and managed point-cloud processing aimed at the skilled-talent bottleneck that slows project execution.
In mobility and industrial automation, whitespace is extending beyond passenger ADAS into heavy equipment, mining, and logistics, where ROI is tied to uptime and safety rather than consumer price points. The evidence in the market includes Luminar integrating LiDAR into Caterpillar Command hauling systems (March 2025) and Ouster signing a multimillion-dollar deal to supply 3D LiDAR for Komatsu autonomous mining equipment (January 2025), reinforcing off-highway autonomy as an actionable demand pool. On the regulatory and standards track, NHTSA activity on ADS (including AV STEP proposed in January 2025 and follow-on rulemaking and research updates in 2026) and Transport Canada RPAS BVLOS regulations (2025) also support adoption through mapped corridors, fleet automation pilots, and drone-enabled inspection programs that require repeatable, high-density 3D data products.
Recent Industry Developments
- June 2026: Ouster expanded its long-term manufacturing partnership with Benchmark Electronics to support high-volume production of the Rev8 digital LiDAR sensor family. The move strengthens supply availability for industrial, robotics, and automotive programs and highlights contract manufacturing's role in scaling automotive-grade quality and throughput.
- December 2025: Daimler Truck and Torc Robotics selected InnovizTwo Short-Range LiDAR for series production of Level 4 autonomous Class 8 trucks. The selection supports a commercialization path for LiDAR in autonomous freight platforms and increases the focus on automotive-qualified short-range sensing for redundancy and near-field perception.
- January 2024: Ouster completed its acquisition of Velodyne, combining product portfolios and installed bases under one supplier. The consolidation reshaped North American competitive dynamics by increasing scale in digital and mechanical LiDAR offerings while also influencing enterprise and government procurement decisions.


Research Methodology Framework and Report Scope
Market Definition and Coverage
For this study, the North America LiDAR market covers revenue earned from LiDAR sensors and related system components that enable distance measurement and 3D sensing, sold into commercial and public-sector applications across the United States, Canada, and Mexico.
Scope exclusions: We exclude downstream services that mainly relate to data processing and analytics when they are priced and contracted as standalone service work rather than bundled with LiDAR hardware.
Segmentation Overview
- By Product
- Aerial LiDAR
- Ground-based LiDAR
- Mobile and UAV LiDAR
- By Type
- Mechanical LiDAR
- Solid-state LiDAR
- By Range
- Short-range (<100 m)
- Medium-range (100-300 m)
- Long-range (>300 m)
- By Component
- Laser Scanners
- GPS/GNSS Receiver
- Inertial Measurement Unit (IMU)
- Camera and Other Sensors
- By Application
- Corridor Mapping and Surveying
- ADAS and Autonomous Vehicles
- Engineering and Construction
- Environmental and Forestry
- Security and Law Enforcement
- By End-User
- Automotive
- Engineering and Construction Firms
- Industrial and Utilities
- Aerospace and Defense
- Federal and State Government Agencies
- By Country
- United States
- Canada
- Mexico
Data Sources, Market Sizing, and Validation
Desk Research
Desk work starts by building a clean fact base on where LiDAR demand is coming from across North America, and how quickly key use cases are scaling. Public sources such as US Census trade statistics, USGS and NOAA geospatial publications, FAA materials on aerial operations, NHTSA safety and ADAS references, and IEEE or other peer-reviewed optics and sensing journals are used to anchor context on deployments and technical adoption.
We also review company filings, earnings decks, product literature, patent records, and reputable press coverage to identify pricing direction, typical shipment patterns by end use, and the timing of platform refreshes. Where needed, we rely on paid subscriptions for company financials and intelligence, patent lookups, and shipment-level import and export signals to sanity-check volumes and average selling prices. The desk research sources listed above are illustrative only, since many other public and paid references were also used to collect data and resolve smaller data gaps.
Primary Interviews and Surveys
Primary work is used to pressure-test the desk assumptions, then turn them into workable model inputs for North America, especially where disclosures are limited. We speak with a mix of LiDAR ecosystem participants and buyers, including product leaders, engineering and operations roles, and procurement or program owners tied to key end uses in the region. The conversations help us align on realistic pricing bands, adoption timing by application, and the share of demand that is truly LiDAR-driven versus adjacent sensing spend.
Distribution of primary research fieldwork respondents
| Company type | Respondent position |
|---|---|
| Top tier: 34% | CXOs: 16% |
| Mid tier: 47% | Functional/Unit leaders: 39% |
| Smaller Players: 19% | Managers: 45% |
Market-Sizing & Forecasting
Sizing is built using a top-down and bottom-up workflow, with the main structure coming from reconstructing the addressable demand pool by application and translating it into LiDAR spending. For North America, we start with deployment indicators such as active vehicle programs using LiDAR, aerial and mapping activity, robotics and industrial automation adoption, and the mix of solid-state versus mechanical units, since that tends to shift pricing.
Those signals are then converted into value using a simple volume and ASP logic, and totals are checked with selective bottom-up approximations such as sampled supplier revenue splits, channel feedback on unit ranges, and observed price steps across product generations. Key inputs we track include average selling price progression by form factor, unit range and resolution needs by end use, attach rates in vehicle platforms, replacement and calibration cycles, and public spending patterns for surveying and mapping. When a bottom-up cross-check has gaps, we do not force a full roll-up, and instead we scale using conservative penetration assumptions supported by interview feedback.
For forecasting, scenario analysis is used so that changes in adoption pace can be expressed clearly, and the scenario paths are tied to a small set of drivers that experts can validate, including autonomous program timing, industrial automation investment, and the speed at which solid-state products reduce cost per unit of performance.
Data Validation & Update Cycle
Before finalizing results, we compare outputs against independent signals such as import and export direction, patenting intensity, public procurement activity for mapping, and the implied ASP trend from product launches. If a segment moves too sharply versus these checks, we revisit the assumptions, and then re-contact sources when the variance cannot be explained by a known event.
A multi-step internal review follows, so model math, unit consistency, and country allocation are checked before sign-off. The report is refreshed annually, with interim updates when there are material shifts such as policy changes, large program ramps, or meaningful price resets. Right before delivery, a final analyst pass is completed so clients receive the most current view that can be supported by the latest inputs.
Mordor Intelligence's North America Lidar Market Size Measured Against Other Published Estimates
Published LiDAR market numbers for North America often do not match because each study makes its own choices on what to count, which year to anchor on, and how to treat fast-changing pricing. Differences also show up when one publisher emphasizes automotive and another leans more into mapping, industrial, or robotics demand.
Some external figures lean into broader spending that can include adjacent sensing or extra service layers, and they may also assume faster unit growth with a steeper price curve. In contrast, Mordor Intelligence counts LiDAR revenue only when it is tied to LiDAR hardware and defined system components sold into North America, and it keeps standalone data services outside the total so the model tracks a cleaner demand pool.
Benchmark comparison
| Source | Market Size | Gaps in Research Methodology |
|---|---|---|
| Mordor Intelligence | USD 1.17 B (2025) | |
| Industry Publisher A | USD 1.33 B (2024) | Uses a different base year and can blend faster adoption expectations into the starting point, and the scope description is less explicit on separating hardware revenue from standalone mapping and analytics services. |
| Research House B | USD 0.80 B (2024) | A narrower demand build that appears to undercount newer industrial and robotics deployments, and it likely applies more conservative ASP and penetration assumptions for emerging automotive programs. |
The spread in the table mainly comes from scope cutoffs and the timing of pricing and adoption assumptions used in the base year. By keeping the counted revenue tied to identifiable LiDAR sales and cross-checking totals with independent activity signals, the resulting number stays easier to explain and repeat when the model is updated.


Key Questions Answered in the Report
What is the current size of the North America LiDAR market?
It stands at USD 1.39 billion in 2026 and is projected to reach USD 3.35 billion by 2031 at a 19.18% CAGR.
Which application segment is expanding fastest?
ADAS and autonomous vehicle deployments are forecast to grow at a 22.2% CAGR, outpacing traditional surveying.
Why are solid-state LiDAR sensors gaining share?
They offer higher reliability, smaller form factors, and declining costs, driving a 21.2% CAGR versus mechanical units.
How does federal infrastructure funding influence demand?
IIJA and SMART grants finance digital-twin and smart-corridor projects that require dense LiDAR data, boosting long-term procurement.
Which country shows the highest growth rate within the region?
Mexico leads with a 20.3% CAGR through 2031, aided by near-shoring of automotive manufacturing and infrastructure upgrades.
What factors limit mass-market vehicle adoption of LiDAR?
A three-to-five-fold cost premium over radar and limited skilled talent for data processing delay large-scale rollout in sub-luxury cars.
Page last updated on:





