
Market Overview
| Study Period | 2020 - 2031 |
|---|---|
| Forecast Data Period | 2026 - 2031 |
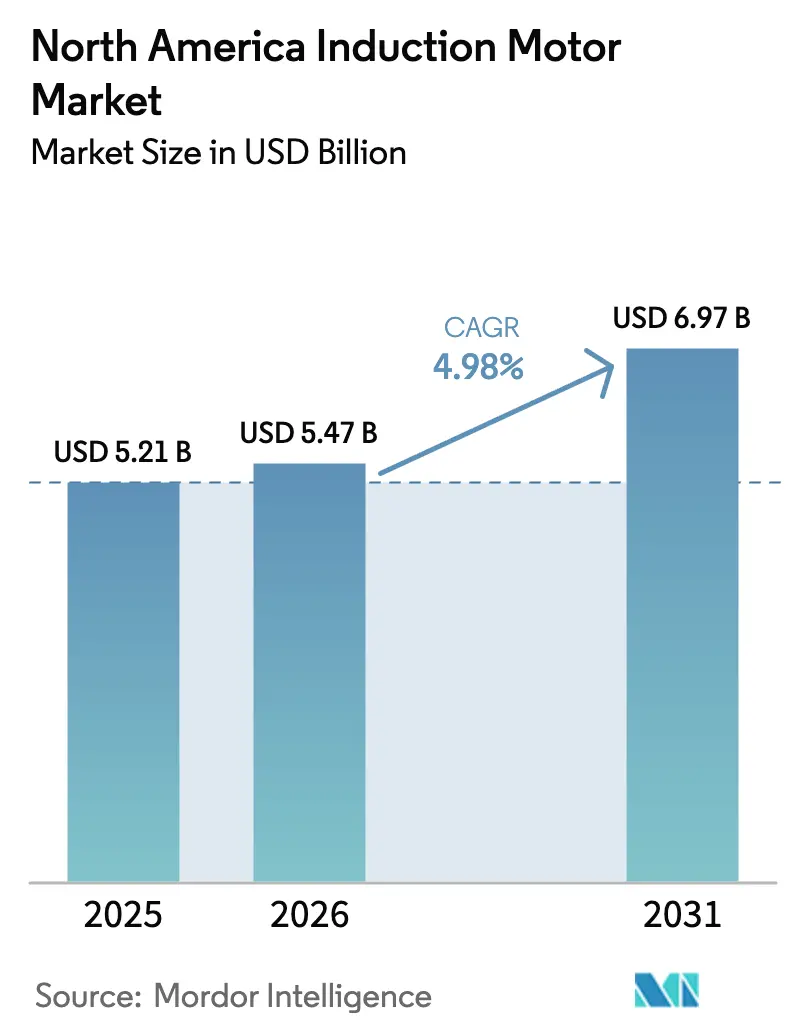
| Base Year Market Size (2025) | USD 5.21 Billion |
| Market Size (2026) | USD 5.47 Billion |
| Market Size (2031) | USD 6.97 Billion |
| Growth Rate (2026 - 2031) | 4.98 % |
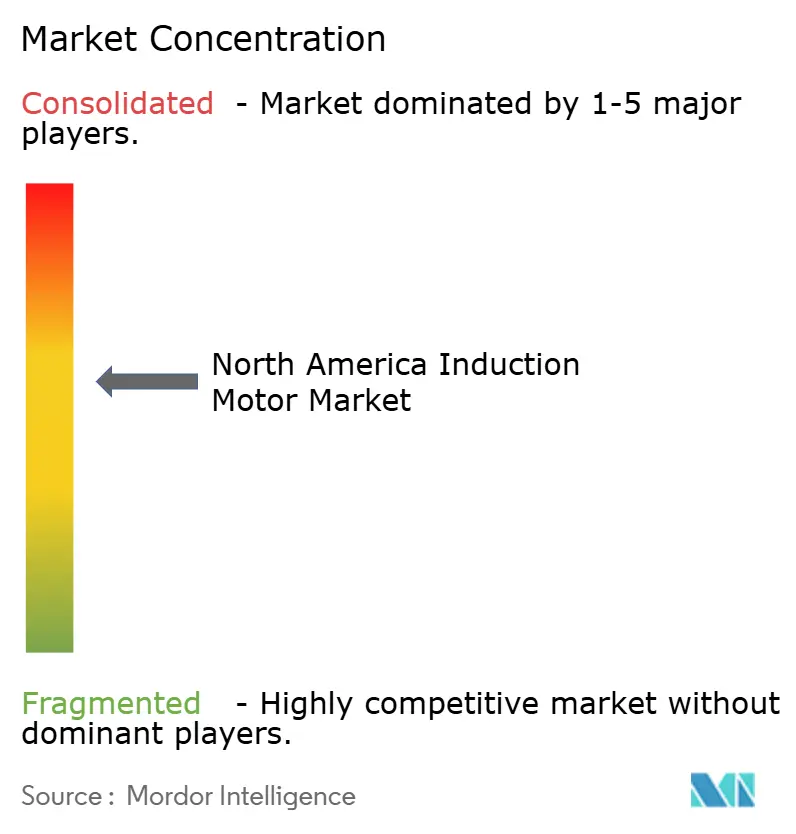
| Market Concentration | Medium |
Major Players *Disclaimer: Major Players sorted in no particular order Image © Mordor Intelligence. Reuse requires attribution under CC BY 4.0. | |
North America Induction Motor Market Analysis by Mordor Intelligence
The North America induction motor market size is projected to expand from USD 5.20 billion in 2025 and USD 5.47 billion in 2026 to USD 6.97 billion by 2031, registering a CAGR of 4.97% between 2026 to 2031. Heightened regulatory pressure, especially the United States Department of Energy’s 2024 update that retires IE1 and IE2 designs, is accelerating replacement demand. Utility rebates tied to time-of-use tariffs reinforce the shift toward IE4 platforms, while medium-voltage motors benefit from Infrastructure Investment and Jobs Act funds channelled into municipal water projects. Electric-vehicle supply-chain reshoring under the CHIPS Act is spawning new machining and battery-cell plants that specify premium-efficiency, sensor-ready drives. At the same time, predictive-maintenance software now quantifies the payback of retrofit over rewind, strengthening aftermarket pull and anchoring supplier margins.
Key Report Takeaways
- By type, three-phase motors led with 71.19% revenue share in 2025, while single-phase motors are expanding at a 5.55% CAGR through 2031.
- By power rating, the 7.6-37 kW band accounted for 38.22% of the North America induction motor market size in 2025, and sub-7.5 kW units are growing fastest at a 5.39% CAGR.
- By efficiency class, IE3 premium-efficiency held 46.74% of demand in 2025, whereas IE4 units are scaling at a 5.82% CAGR to 2031.
- By voltage, low-voltage platforms below 1 kV captured 63.67% share in 2025, yet medium-voltage motors are advancing at a 5.63% CAGR.
- By application, pumps and compressors secured 29.32% of 2025 revenue, while HVAC and refrigeration track the highest 5.75% CAGR.
- By end-user industry, power generation and utilities commanded 22.39% share in 2025, but food and beverage facilities are rising at a 5.91% CAGR.
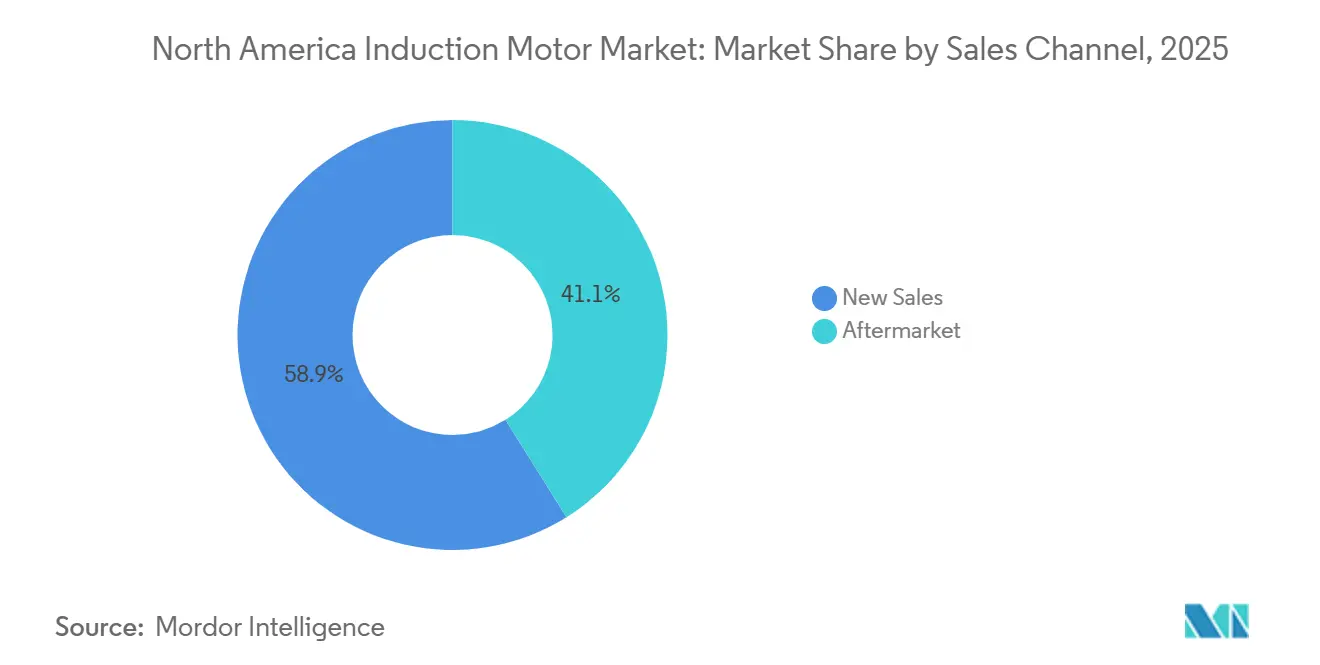
- By sales channel, aftermarket routes controlled 58.89% of 2025 value and are increasing at a 5.96% CAGR.
- By mounting type, foot-mounted designs represented 52% volume in 2025, whereas vertical configurations are climbing at a 5.92% CAGR.
Note: Market size and forecast figures in this report are generated using Mordor Intelligence’s proprietary estimation framework, updated with the latest available data and insights as of 2026.
North America Induction Motor Market Trends and Insights
Drivers Impact Analysis*
| Driver | (~) % Impact on CAGR Forecast | Geographic Relevance | Impact Timeline |
|---|---|---|---|
| Mandatory Efficiency Regulations in the United States and Canada | 1.20% | United States and Canada, with California and New York leading state-level adoption | Medium term (2-4 years) |
| Shift Toward Electric Vehicles (EV and HEV) | 1.00% | United States and Mexico, concentrated in Michigan, Texas, and Nuevo León automotive corridors | Long term (≥4 years) |
| Smart Factories' Demand for Connected Motors | 0.90% | United States and Canada, with early gains in discrete manufacturing clusters | Medium term (2-4 years) |
| Grid-Modernization Incentives for Industrial Efficiency | 0.80% | United States, particularly states with restructured electricity markets and utility performance incentives | Medium term (2-4 years) |
| On-Shoring of Critical Supply Chains in EV and HVAC Industries | 0.70% | United States and Mexico, with investment concentrated in border states and Great Lakes region | Long term (≥4 years) |
| Utility Decarbonization Targets Accelerating Motor Retrofits | 0.60% | United States and Canada, driven by state renewable portfolio standards and federal clean-energy tax credits | Long term (≥4 years) |
| Source: Mordor Intelligence | |||
Mandatory Efficiency Regulations in the United States and Canada
A 2024 rule now enforces IE3 minimums on 0.25-0.75 hp motors and will mandate IE4 for select frames above 500 hp in 2027, obliging OEMs to redesign pump and fan packages and forcing rewind shops to certify post-service efficiency.[1]U.S. Department of Energy, “Energy Efficiency Standards for Electric Motors,” Energy.gov California’s Title 24 tightened further in 2025, accelerating replacement cycles by nearly two years.[2]California Energy Commission, “Title 24 Building Energy Efficiency Standards,” Energy.ca.gov Canada harmonized its federal code yet layered rebates in Ontario and British Columbia that subsidize up to 20% of IE4 cost.[3]Natural Resources Canada, “Energy Efficiency Regulations for Electric Motors,” Nrcan.gc.ca The combined effect bifurcates the North America induction motor market, with compliance-driven new sales surging while older IE1 and IE2 units exit through scrappage rather than rewind.
Shift Toward Electric Vehicles
Light-vehicle output reached 15.8 million units in 2025, 11.2% of which were battery-electric or plug-in hybrids, prompting assembly plants to specify tighter-tolerance, low-vibration three-phase drives.[4]U.S. Bureau of Transportation Statistics, “North American Light-Vehicle Production 2025,” Bts.gov Gigafactory HVAC systems demand variable-frequency-drive-ready motors up to 185 kW to maintain ±1 °C humidity-controlled rooms. Mexico drew USD 20 billion of announced EV investment through 2025, driving local rotor-lamination lines that shorten supply chains. Domestic-content rules under the CHIPS Act compel suppliers to source copper and electrical steel regionally, further localizing production.
Smart Factories’ Demand for Connected Motors
Industrial IoT penetration climbed to 34% in 2025, lifting demand for motors with embedded vibration and thermal sensors that deliver 25-35% downtime reduction. ABB and Siemens integrate edge modules for real-time anomaly detection, mitigating latency concerns in high-speed conveyors. Adoption is tempered by the need for OPC UA or MQTT gateways in legacy SCADA environments, which can add USD 500-1,500 per motor. Still, Better Plants participants report 8-12% energy savings inside 18 months, aligning with capital-budget cycles.
Grid-Modernization Incentives for Industrial Efficiency
The Infrastructure Investment and Jobs Act’s USD 65 billion grid package funds demand-side programs that pay manufacturers for verified peak reduction. Texas, Pennsylvania, and New York utilities now structure performance-based rates that favour IE4 motors paired with drives. State rebates of USD 50-200 per horsepower accelerate project paybacks, though oversubscribed budgets often exclude smaller firms.
Restraints Impact Analysis*
| Restraint | (~) % Impact on CAGR Forecast | Geographic Relevance | Impact Timeline |
|---|---|---|---|
| Competition From Permanent-Magnet Synchronous Motors | -0.80% | United States and Canada, particularly in variable-torque HVAC and material-handling applications | Medium term (2-4 years) |
| Volatility in Copper and Aluminum Prices | -0.60% | North America, with acute impact on small and mid-sized motor manufacturers lacking hedging capacity | Short term (≤2 years) |
| Skilled-Labor Shortages for Motor Rewinding | -0.40% | United States and Canada, concentrated in Rust Belt states and provinces with aging workforce demographics | Long term (≥4 years) |
| Cyber-Security Concerns in IIoT-Enabled Motors | -0.30% | United States, with heightened scrutiny in critical infrastructure sectors regulated by CISA and NERC | Medium term (2-4 years) |
| Source: Mordor Intelligence | |||
Competition From Permanent-Magnet Synchronous Motors
PMSMs deliver 2-5% higher efficiency and reached 12-15% share of new HVAC installs in the 7.5-37 kW band by 2025. Falling rare-earth prices erode the cost gap. However, demagnetization risks in high-temperature plants and limited rewind options curb universal uptake. Induction-motor makers counter with die-cast copper rotors that reclaim most of the efficiency delta at lower material cost.
Volatility in Copper and Aluminium Prices
COMEX copper swung between USD 3.85 and USD 4.72 per lb during 2025, boosting unit cost by USD 40-80 for copper-intensive designs. Aluminium tracked similar volatility, but squirrel-cage aluminium rotors suffer only USD 15-25 incremental cost. Smaller suppliers without hedging capacity often absorb the margin hit, nudging product-mix toward aluminium rotors despite a 1-2% efficiency loss.
*Our forecasts treat driver/restraint impacts as directional, not additive. The impact forecasts reflect baseline growth, mix effects, and variable interactions.
Segment Analysis
By Type: Three-Phase Motors Anchor Industrial Loads
Three-phase machines held 71.19% of 2025 revenue, underscoring their dominance in balanced-load industrial applications where high starting torque, long life, and simple maintenance prevail. This share equates to the largest North America induction motor market share among all types. Single-phase adoption is rising at 5.55% CAGR as heat-pump retrofits under the Inflation Reduction Act permeate residential and light-commercial buildings.
The North America induction motor market benefits from the Department of Energy rule that extended IE3 thresholds to fractional-horsepower single-phase models, raising bill-of-material cost yet unlocking utility incentives. Three-phase units remain favoured for pumps and conveyors above 1 hp because they ride through momentary phase imbalances and broaden voltage tolerance. Single-phase motors now integrate drives that eliminate phase converters, widening their attractiveness in pool pumps, agricultural fans, and distributed building automation.



By Power Rating: Mid-Range Band Serves the Widest Application Span
The 7.6 kW-37 kW segment accounted for 38.22% of 2025 value and therefore represents the largest slice of the North America induction motor market size. Rapid build-out of automated assembly lines and data-center cooling skews growth toward sub-7.5 kW frames, which expand at 5.39% CAGR.
Siemens’ 5.5 kW IE5 launch targets electricity prices above USD 0.12 per kWh, offering a two-year payback to semiconductor and pharmaceutical users. Larger 37-185 kW motors remain steady in metals, mining, and automotive presses, while >185 kW machines stay niche in pipeline and power-plant service. California and New York codes now cover fractional-horsepower designs, hastening churn in small HVAC and commercial refrigeration.
By Efficiency Class: IE4 Uptake Accelerates as Rebates Narrow Premium
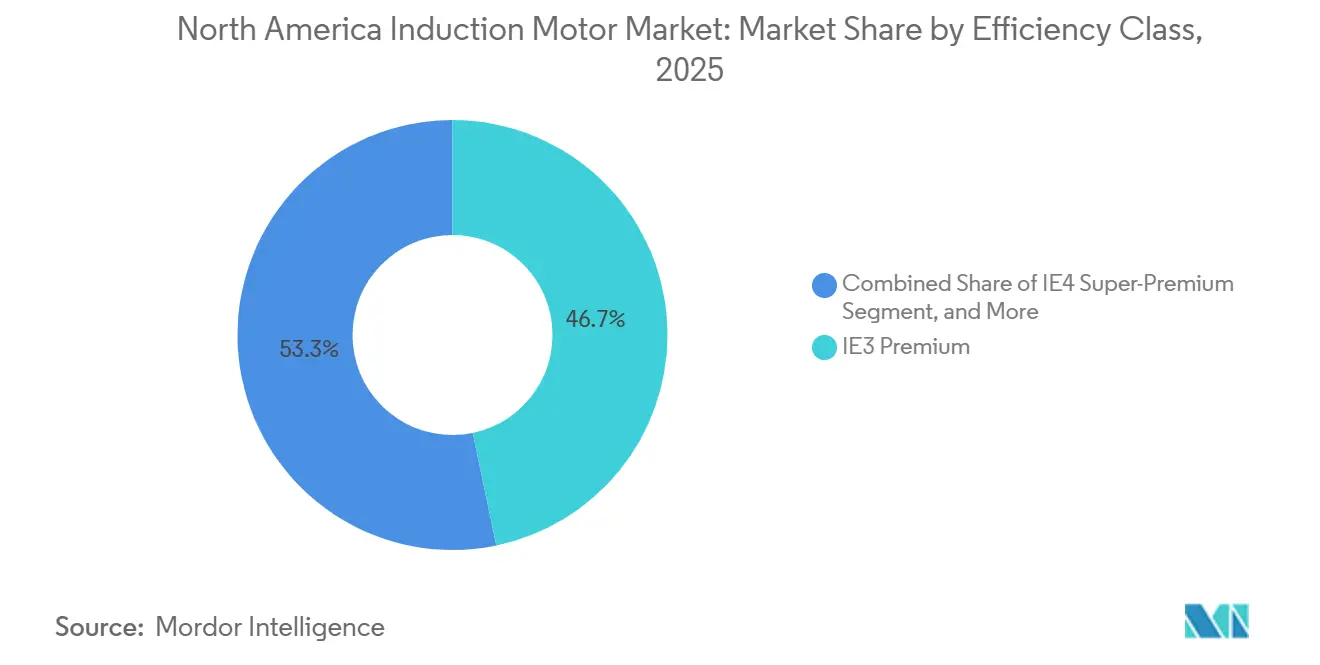
IE3 still rules with 46.74% of 2025 demand, yet IE4 advances at 5.82% CAGR. Utilities in California, Massachusetts, and Ontario stack rebates on time-of-use tariffs, slicing the payback gap to under three years for many mid-load pumps. ABB’s disclosure that IE4 now forms 22% of North American shipments signals a market pivot.
IE2 and IE1 remain in managed decline, limited to like-for-like replacements where switchgear or frame envelopes prevent upgrades. IE4’s 1.5-2.5% efficiency boost yields USD 150-400 annual savings for 6,000-hour duty cycles at USD 0.10 per kWh. Regal Rexnord’s IE5 debut extends the frontier for ultra-premium adopters in semiconductor and pharma clean rooms.

By Voltage: Low-Voltage Dominates, Medium-Voltage Rises on Infrastructure Spend
Low-voltage (<1 kV) platforms captured 63.67% of 2025 revenue. Medium-voltage (1-6.6 kV) units grow at 5.63% supported by Infrastructure Act water projects and oil-and-gas methane-leak rules that favour electric compressors.
Medium-voltage motors slash current draw and feeder size, trimming 15-25% installation cost in greenfield, but demand vacuum breakers and arc-flash training that deter some mid-sized plants. WEG’s 4.16 kV frame with partial-discharge diagnostics squarely targets these municipal upgrades. High-voltage (>6.6 kV) motors remain a specialized pocket tied to utility power and large mines.
By Application: Pumps and Compressors Lead, HVAC Gains Momentum
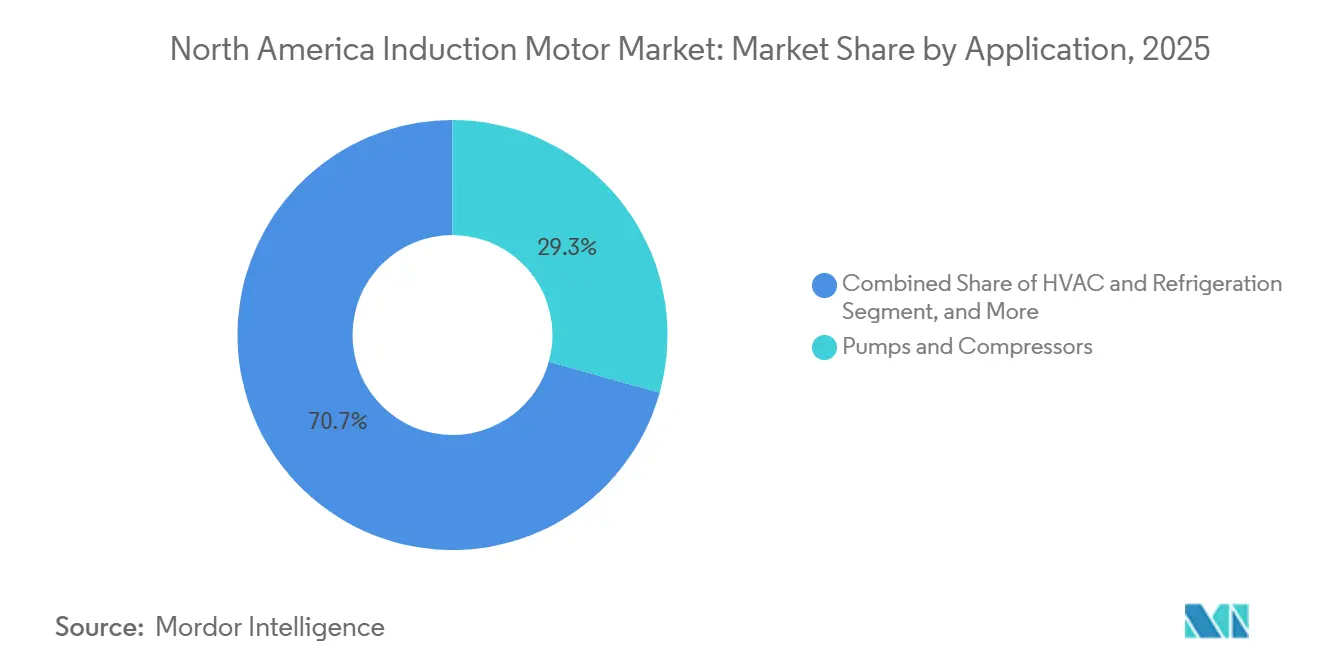
Pumps and compressors generated 29.32% of 2025 revenue, sustained by continuous-duty oil, gas, and water processes. HVAC and refrigeration motors outpace at 5.75% CAGR as LEED recertification and cold-chain electrification spur IE4 demand.
Federal analysis estimates nationwide furnace-to-heat-pump conversion could require an extra 25 GW of motor capacity, reshaping supplier footprints. Fans transition to drive-based modulation as building codes stress demand-controlled ventilation, while material-handling conveyors rely on encoder feedback and braking for high-throughput e-commerce facilities.
By End-User Industry: Utilities Dominate Spend, Food and Beverage Surges
Power generation and utilities owned 22.39% share in 2025, linked to grid-modernization retrofits and renewable integration. Food and beverage plants experience the fastest 5.91% rise, driven by sanitation automation and near-shored ingredient processing.
FDA sanitation rules require IP69K stainless-steel enclosures, allowing suppliers to earn 20-30% premiums. Oil and gas, chemicals, and metals remain steady on long asset cycles, whereas water-treatment upgrades accelerate under Infrastructure Act funds.
By Sales Channel: Aftermarket Benefits from Predictive Analytics
Aftermarket held 58.89% value in 2025 and expands at 5.96% because sensor data now quantifies net present value of rewinds versus replacement. Emerson, Rockwell Automation, and SKF platforms forecast bearing failure 30-90 days out, letting plants schedule downtime and sidestep USD 10,000-50,000 hourly losses.
North America induction motor market share tilts further to service as certified rewind shops with dynamometers command premiums, while uncertified providers lose ground amid insurance scrutiny.
By Mounting Type: Foot-Mounted Prevails, Vertical Profiles Grow in Space-Starved Plants
In 2025, foot-mounted units captured 52% of the market volume, celebrated for their alignment flexibility. These units are widely preferred in various industrial applications due to their ease of installation and adaptability to different operational setups. As water and wastewater skids tighten floor plans, vertical motors are projected to grow at a 5.92% CAGR.
This growth is driven by the increasing demand for compact and efficient solutions in industries where space optimization is critical. ABB has introduced a vertical hollow-shaft motor, equipped with ceramic bearings, designed for continuous immersion duty. This innovation addresses the need for durable and reliable motors in challenging environments, such as water treatment facilities.
Flange-mounted motors continue to be essential for rooftop HVAC systems and fan coils, playing a crucial role in maintaining efficient air circulation and temperature control. However, their proprietary bolt patterns pose challenges for aftermarket replacements, limiting compatibility and increasing the complexity of maintenance and upgrades. Despite this, their specialized design ensures optimal performance in specific applications, making them a vital component in the HVAC sector.
Geography Analysis
The United States dominates the North America induction motor market through the largest installed motor base and the strictest federal efficiency mandates. CHIPS Act incentives spur greenfield EV and HVAC plants in Michigan, Texas, and the Southeast, while Infrastructure Act water funds accelerate pump retrofits. California and New York codes advance IE4 adoption 18-24 months ahead of federal timelines, but skilled-labour shortages in repair shops and cybersecurity advisories from CISA temper growth.
Canada leverages carbon pricing to internalize lifecycle savings of IE4 motors, especially in Alberta’s oil sands and Ontario’s auto corridor. Provincial incentives in British Columbia and Quebec subsidize 15-20% of incremental IE4 cost, lifting adoption in pulp, paper, and mining. Ontario’s demand-response program pays CAD 100-150 per kW of curtailed peak, motivating drive-controlled pumps.
Mexico is the fastest-growing locus as USD 20 billion of 2024-2025 automotive and HVAC investment follows USMCA tariff certainty. Nuevo León, Guanajuato, and Coahuila host new rotor and stator lines by Nidec, WEG, and Siemens, compressing delivery windows for automakers. While federal efficiency rules still allow IE2, multinationals specify IE3 or higher to harmonize sustainability reporting. Grid reliability challenges push demand for motors tolerant of voltage sag and frequency drift.
Regulatory Landscape
In the United States, the U.S. Department of Energy (DOE) is the central authority governing minimum efficiency and test procedures for electric motors under 10 CFR Part 431, and updates that expand scope and tighten requirements. DOE finalized amended standards for expanded-scope electric motors in January 2025, while the broader electric-motor standards established earlier in the cycle carry a June 1, 2027 compliance date for covered products. The expanded-scope amendments move to January 1, 2029 for compliance.
In Canada, Natural Resources Canada (NRCan) is advancing harmonization with the U.S. framework through proposed amendments to the Energy Efficiency Regulations (notably Amendment 19), including expanded scope coverage up to 559 kW and the inclusion of air-over motors. NRCan published the proposal in Canada Gazette, Part I, in June 2026, providing a North America-wide compliance roadmap that shapes cross-border product qualification, labeling, and test alignment for OEMs and distributors operating across the United States, Canada, and Mexico.
Competitive Landscape
Moderate concentration characterizes the North America induction motor market, with the top five suppliers controlling roughly 45-50% revenue. ABB and Siemens exploit scale to integrate edge analytics and cloud connectivity, marketing their motors as plug-and-play drive systems that reduce engineering workload. Nidec and WEG run high-volume lines in Mexico, enabling 20-30% cost advantages they deploy selectively to win price-sensitive bids. Regal Rexnord and Emerson dominate aftermarket through 200-plus service centers, and 48-hour rewind promises that command premiums.
Strategic activity underscores technology leverage. ABB’s 2024 purchase of a Canadian rewind chain secures service revenue. Siemens partnered with Microsoft to embed Azure IoT into Simotics, while Nidec invested USD 150 million in Monterrey rotor capacity aimed at reshored auto production. Smaller players such as Baldor Electric and TECO-Westinghouse protect niches via custom windings and legacy frame continuity. Emerging software-defined motor startups promise sensorless efficiency gains that could narrow PMSM’s edge, yet certification costs exceeding USD 50 million curb rapid disruption.
Pricing power centers on integrated motor-drive-controller stacks below 10 hp, where small enterprises seek single-invoice procurement. Vertical-specific washdown packages for cold-chain logistics draw 25-35% premiums given FDA compliance. Permanent-magnet encroachment, raw-material volatility, and cybersecurity gaps remain headline risks suppliers must hedge.
North America Induction Motor Industry Leaders
Rockwell Automation, Inc.
WEG S.A.
ABB Ltd.
Nidec Motor Corporation
Schneider Electric SE
- *Disclaimer: Major Players sorted in no particular order

Market Opportunities and Future Outlook
Near-term whitespace is concentrated in compliance-driven replacement cycles and in engineering services tied to DOE and NRCan timelines, particularly for OEMs and system integrators that need to redesign pump, fan, and compressor packages around higher-efficiency motor platforms. DOE also issued an enforcement policy (June 2026) exercising enforcement discretion for certain motor categories (including inverter-only and air-over), creating a defined window for suppliers to clear legacy configurations while requalifying expanded-scope product lines ahead of the next compliance steps.
Industrial reindustrialization and electrical-infrastructure buildouts are translating into incremental demand for premium-efficiency, drive-ready induction motors and integrated motor-control architectures. In April 2026, Franklin, Wisconsin approved a tax incremental financing district supporting Yaskawa Americas USD 182 million campus investment that includes space for electric motor-drive equipment. Siemens also reported reaching USD 1 billion in U.S. manufacturing investments over the prior five years (May 2026), reinforcing supply-chain localization themes that support shorter lead times and regional customization. On the grid and industrial power side, Mitsubishi Electric Power Products Inc. announced an USD 86 million investment (October 2024) for a new switchgear factory, with expanded power-electronics and test capabilities in Western Pennsylvania, which aligns with the market shift toward packaged motor-drive-control solutions where verification, testing, and commissioning capacity can influence project execution.
Recent Industry Developments
- May 2026: Rockwell Automation expanded its EtherNet/IP In-cabinet solution with added motor control and protection device support, including 140ME Motor Protective Switching Devices and E100 Electronic Overload Relays. The update tightens integration between motor protection, diagnostics, and networked control, supporting plants that are standardizing on connected motor-control architectures for faster commissioning and improved uptime.
- November 2025: Nidec Motor Corporation introduced a TEFC Inverter Duty Closed Coupled Pump (CCP) motor line, highlighting inverter-grade insulation and shaft grounding to address VFD-related electrical stresses. The launch targets high-duty pump applications in water and process industries where retrofit demand is rising and where VFD compatibility can reduce premature bearing and insulation failures.
- April 2024: Rockwell Automation launched the FLEXLINE 3500 low-voltage motor control center at Hannover Messe 2024, expanding its IEC-oriented MCC portfolio. The platform supports centralized motor control strategies and aligns with broader adoption of standardized, modular motor-control lineups that simplify maintenance and upgrades in multi-motor industrial environments.


Research Methodology Framework and Report Scope
Market Definition and Coverage
For this study, the market covers revenues from induction motors sold and used across North America, including new unit sales and aftermarket demand where induction motors are replaced, repaired, or upgraded for industrial and building applications.
Scope exclusions: Excludes non-induction motor types (such as DC and synchronous motors) and non-motor equipment that may be sold alongside motors, unless it is packaged and priced as part of the motor sale.
Segmentation Overview
- By Type
- Single-Phase Induction Motors
- Three-Phase Induction Motors
- By Power Rating
- Less than equal to 7.5 kW
- 7.6 - 37 kW
- 37.1 - 185 kW
- More than 185 kW
- By Efficiency Class
- IE1 Standard Efficiency
- IE2 High Efficiency
- IE3 Premium Efficiency
- IE4 Super-Premium Efficiency
- By Voltage
- Low Voltage (Less than 1 kV)
- Medium Voltage (1 - 6.6 kV)
- High Voltage (More than 6.6 kV)
- By Application
- Pumps and Compressors
- HVAC and Refrigeration
- Material Handling (Conveyors, Hoists)
- Fans and Blowers
- Other Applications
- By End-User Industry
- Oil and Gas
- Chemicals and Petrochemicals
- Power Generation and Utilities
- Water and Wastewater
- Metals and Mining
- Food and Beverage
- Discrete Manufacturing (Automotive, Electronics)
- Other End-User Industries
- By Sales Channel
- New Sales
- Aftermarket
- By Mounting Type
- Foot-Mounted
- Flange-Mounted
- Vertical-Mounted
- By Country
- United States
- Canada
- Mexico
Data Sources, Market Sizing, and Validation
Desk Research
Desk research was used to set the market boundary and build the starting dataset for demand across the United States, Canada, and Mexico. We relied on public and official sources such as the US Department of Energy (motor efficiency rules and test procedures), the US Census Bureau and Statistics Canada (manufacturing and construction indicators), and Mexico-focused sources such as INEGI for industrial activity context.
To ground motor standards and naming conventions, we referenced materials from associations such as NEMA, and we reviewed customs and trade statistics where relevant to check import and export direction for motors and components. Company annual reports, investor presentations, product catalogs, and reputable press coverage were used to understand pricing mix and channel structure. A paid subscription for company financials and news was also used to validate revenue splits and to time-check major capacity announcements. The desk sources listed here are illustrative, and many other public and paid references were also consulted for data collection, cross-checking, and clarification.
Primary Interviews and Surveys
Primary interviews and surveys were conducted with a spread of motor suppliers, distributors, service partners, and large end users to confirm what is being bought and replaced, and how efficiency and voltage choices are changing. We used these discussions to validate assumptions on pricing, aftermarket shares, and the practical split across applications such as pumps and compressors, HVAC systems, fans, and material handling across North America.
Distribution of primary research fieldwork respondents
| Company type | Respondent position |
|---|---|
| Top tier: 31% | CXOs: 14% |
| Mid tier: 50% | Functional/Unit leaders: 27% |
| Smaller Players: 19% | Managers: 59% |
Market-Sizing & Forecasting
Market sizing starts with a top-down and bottom-up approach where industrial output, construction activity, and equipment replacement needs are converted into an addressable demand pool for induction motors by country, and then split by voltage, power rating, and application. Once that structure is in place, selective bottom-up checks are used to confirm the totals, including channel checks plus sampled ASP times volume logic by key power bands.
In the model, several market fingerprints are tracked because they move demand and pricing in a visible way. These include the efficiency class shift (IE2 to IE3 and IE4), the split across voltage groups (low, medium, and high), and the application pull from pumps and compressors, HVAC systems, fans, and material handling. We also adjust for the new versus aftermarket split, since replacement cycles and repair-to-replace decisions can change faster than new-build activity. Where company or channel data is incomplete, gaps are handled using conservative range fills that are later narrowed through primary feedback and cross-checks against country-level industrial indicators.
For forecasting, scenario analysis is applied around a base case, and the key drivers are refreshed using primary expert expectations for investment cycles, efficiency-led upgrades, and the pace of capacity additions in manufacturing. To keep the forecast practical, pricing is progressed using a mix-led method (efficiency and voltage mix) plus inflation expectations, rather than assuming one flat ASP trend for the full market.
Data Validation & Update Cycle
Validation is done through a few layers so unusual outputs are caught early. We compare the model totals against independent signals, such as country-level industrial output trends, visible capex cycles in key end users, and the implied motor replacement pace that the installed base would require.
If large variances show up by country, voltage, or efficiency class, the assumptions are reviewed and then rechecked with follow-up questions to primary contacts. Before sign-off, the work is reviewed in steps, including consistency checks across related splits like new versus aftermarket and application shares. The report is refreshed annually, and interim adjustments are made when there are material events that can change demand, with a final freshness pass completed before delivery.
Mordor Intelligence's North America Induction Motor Market Size Compared With Other Published Estimates
Published market sizes for induction motors in North America can look different because each publisher draws the scope lines in a different place, and then uses different inputs for pricing, replacement demand, and efficiency-driven upgrades. Differences also come from the year used as the base, the currency conversion timing, and whether the estimate leans more on shipments, installed-base signals, or reported revenues.
Key gap drivers in this market usually include whether aftermarket revenues are counted, how low, medium, and high voltage motors are treated, and whether the efficiency class mix (IE1 to IE4) is updated as regulations and incentives change. Some estimates also blend in adjacent motor categories or omit Mexico, which can shift totals even when the growth rate looks similar.
Benchmark comparison
| Source | Market Size | Gaps in Research Methodology |
|---|---|---|
| Mordor Intelligence | USD 5.21 B (2025) | |
| Industry Association A | USD 4.80 B (2025) | Often leans on member-reported shipments and published production indicators, which can undercount replacement-led demand and service-linked aftermarket value that is visible in channel checks. |
| Trade Journal B | USD 5.90 B (2025) | May apply a broader motor bucket by folding in non-induction AC motor revenues or bundled equipment pricing, and it can use simplified ASP progression without resetting the efficiency and voltage mix. |
The table shows a meaningful spread around the same year, and in Mordor Intelligence's model the total is limited to induction motors sold in the United States, Canada, and Mexico, with new and aftermarket demand separated so replacements are not mixed into new-build activity. When aftermarket treatment, motor type coverage, and mix updates are handled differently, the market size can swing even if the story sounds similar.


Key Questions Answered in the Report
How large is the North America induction motor market in 2026?
It is valued at USD 5.47 billion, on its way to USD 6.97 billion by 2031.
Which efficiency class is growing fastest?
IE4 super-premium motors post the highest 5.82% CAGR through 2031 because utility rebates shorten payback periods.
What segment holds the biggest North America induction motor market share?
Three-phase motors with 71.19% of 2025 revenue remain the dominant segment.
Why is aftermarket demand expanding quickly?
Predictive-maintenance analytics now quantify retrofit payback, raising aftermarket revenue at a 5.96% CAGR.
Which country shows the quickest growth?
Mexico, propelled by USD 20 billion in reshored automotive and HVAC investment announced between 2024 and 2025.
What is the main risk to induction-motor vendors?
Rising penetration of permanent-magnet synchronous motors that offer 2-5% higher efficiency in variable-torque loads.
Page last updated on:


 Your data is secure and never sold or shared.


