Market Overview
| Study Period | 2020 - 2031 |
|---|---|
| Forecast Data Period | 2026 - 2031 |
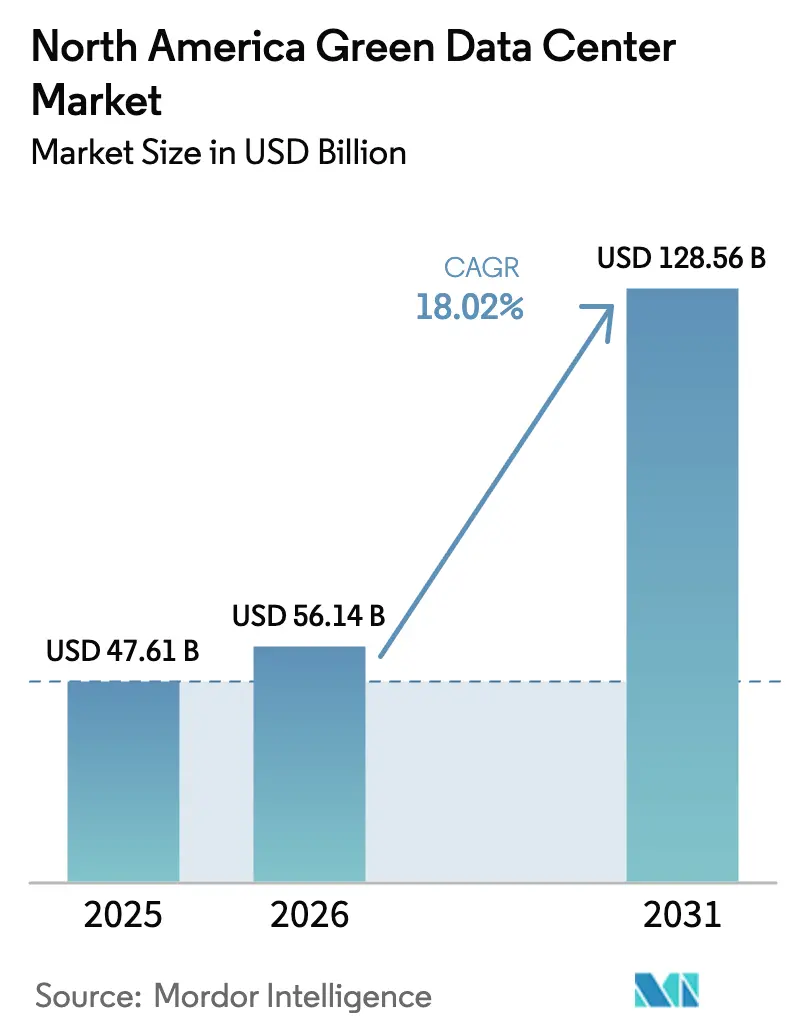
| Base Year Market Size (2025) | USD 47.61 Billion |
| Market Size (2026) | USD 56.14 Billion |
| Market Size (2031) | USD 128.56 Billion |
| Growth Rate (2026 - 2031) | 18.02% CAGR |
| Market Concentration | Low |
Major Players *Disclaimer: Major Players sorted in no particular order Image © Mordor Intelligence. Reuse requires attribution under CC BY 4.0. | |
North America Green Data Center Market Analysis by Mordor Intelligence
The North America green data center market size is projected to expand from USD 47.61 billion in 2025 and USD 56.14 billion in 2026 to USD 128.56 billion by 2031, registering a CAGR of 18.02% between 2026 to 2031. Thermal-management innovation, renewable-energy procurement strategies, and accelerating generative-AI inference workloads are reshaping siting decisions, power architectures, and facility designs. Liquid-cooling retrofits are shifting capital toward high-density halls, while real-time carbon-intensity data feeds influence workload placement more than network latency. Mature operators that secured long-term renewable power-purchase agreements before 2024 enjoy structural electricity-cost advantages. However, tightening transmission capacity across major U.S. grids is elevating interconnection risk and increasing dependence on modular prefabricated electrical rooms and on-site energy storage.
Key Report Takeaways
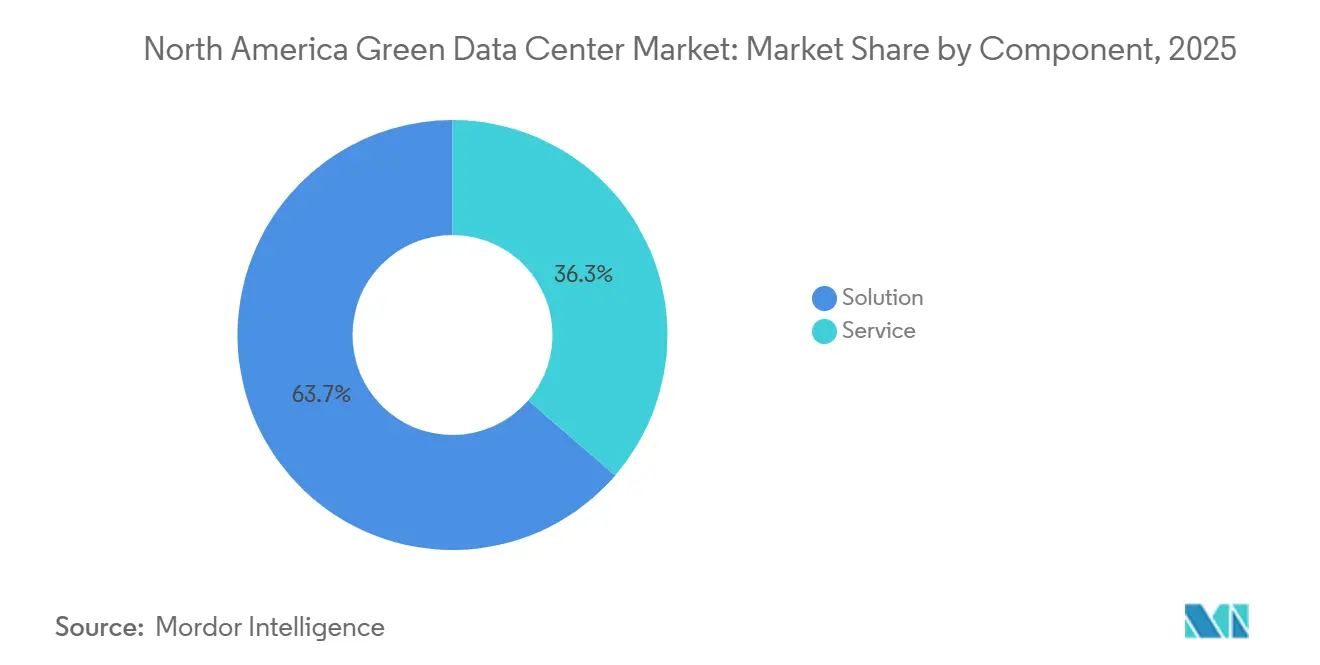
- By component, solutions led with 63.65% of the North America green data center market share in 2025, driven by power and liquid-cooling upgrades, whereas services are forecast to expand at a 19.32% CAGR through 2031.
- By tier classification, tier 3 facilities held 52.86% of market share in 2025, and tier 4 builds are projected to advance at a 19.77% CAGR between 2026-2031.
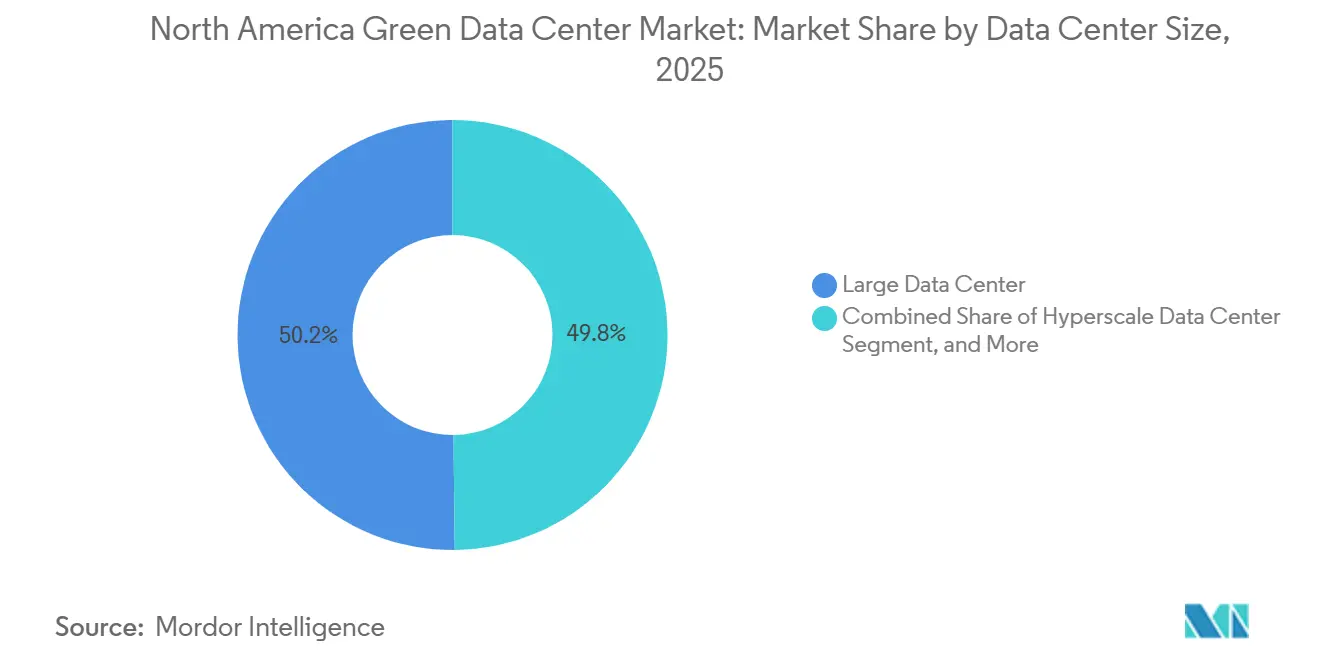
- By data center size, large data centers accounted for 50.17% of the North America green data center market in 2025, while hyperscale campuses are on track for a 19.46% CAGR through 2031.
- By data center type, colocation accounted for 53.14% of the share in 2025, and hyperscaler-owned campuses are set to grow at a 19.63% CAGR over the same horizon.
- By country, the United States captured 79.62% of market share in 2025; Canada is anticipated to post a 19.89% CAGR to 2031, outpacing regional peers.
Note: Market size and forecast figures in this report are generated using Mordor Intelligence’s proprietary estimation framework, updated with the latest available data and insights as of January 2026.
North America Green Data Center Market Trends and Insights
Drivers Impact Analysis*
| Driver | (~) % Impact on CAGR Forecast | Geographic Relevance | Impact Timeline |
|---|---|---|---|
| Soaring Hyperscale Build-Outs Across North America | +3.8% | United States (Virginia, Texas, California), Canada (Quebec, Ontario) | Medium term (2-4 years) |
| Corporate Net-Zero Mandates Reshaping Colocation RFPs | +3.2% | United States (California, New York, Illinois), Canada (British Columbia) | Short term (≤ 2 years) |
| Utility-Level Renewable PPA Price Declines | +2.9% | United States (Texas, Midwest wind belt), Canada (Alberta, Saskatchewan) | Long term (≥ 4 years) |
| AI-Driven Airflow Optimization Cutting OpEx | +2.4% | United States (hyperscale clusters), Canada (Toronto, Montreal) | Short term (≤ 2 years) |
| Rise of Modular Liquid-Cooling Retrofits | +2.1% | United States (existing Tier 3 facilities), Mexico (nearshoring hubs) | Medium term (2-4 years) |
| Carbon-Credit Monetisation Pilots in Data Estates | +1.7% | United States (California, Washington), Canada (Quebec) | Long term (≥ 4 years) |
| Source: Mordor Intelligence | |||
Soaring Hyperscale Build-Outs Across North America
GPU-dense campuses are scaling from 50 MW footprints to well above 200 MW because AI training racks consume up to fifteen times the power of traditional servers. Meta allocated USD 30 billion for a Louisiana complex and Google reserved USD 3.3 billion for South Carolina expansions, placing direct pressure on regional grids. Hyperscalers now outbid utilities for renewable offtake in competitive PPA auctions, limiting contract availability for smaller operators. Amazon’s USD 30 billion investment pipeline across Pennsylvania and North Carolina illustrates how workload demand is decoupling from historic enterprise IT budgets. Campus designs integrate on-site substations and storage to mitigate transmission delays, accelerating adoption of prefabricated electrical rooms that compress build schedules.
Corporate Net-Zero Mandates Reshaping Colocation RFPs
Enterprise buyers increasingly stipulate hourly carbon-free energy alignment rather than annual certificate balancing, forcing colocation providers to pair battery storage with dispatchable renewables. Microsoft’s 2024 sustainability filing acknowledged the gap between annual matching and real-time fossil fuel reliance, prompting marketwide transparency around Scope 2 emissions.[1]California Energy Commission Staff, “Building Energy Efficiency Standards,” energy.ca.gov California’s Senate Bill 100 and New York’s CLCPA create legal obligations for hourly reporting, raising development budgets by 15-20% as providers integrate carbon-intensity APIs and fast-response batteries.
Utility-Level Renewable PPA Price Declines
Wind and solar contract prices in Texas and the Midwest fell below USD 20 per MWh in 2024, enabling renewable energy to undercut gas peakers during many hours. Data center operators now prioritize grids with renewable oversupply even if fiber proximity is suboptimal. NextEra Energy is piloting co-located small modular reactors to provide firm zero-carbon power, highlighting a strategic pivot toward 24/7 clean baseload that battery storage alone cannot yet match.
AI-Driven Airflow Optimization Cutting OpEx
Machine-learning algorithms adjust cooling setpoints, aisle containment, and fan speeds in real time, lowering energy use by up to 30%. Google’s DeepMind-trained control software now governs more than 1 GW of cooling capacity, shaving power-usage-effectiveness metrics from 1.18 to 1.10.[2]Google DeepMind Team, “Machine Learning Boosts Cooling Efficiency,” Financial Times, ft.com Microsoft’s microfluidic two-phase immersion research demonstrated 250 kW rack densities without chilled-water loops, eliminating compressor loads and saving about USD 1 million annually for every 0.01 PUE improvement at a 100 MW site.
Restraints Impact Analysis*
| Restraint | (~) % Impact on CAGR Forecast | Geographic Relevance | Impact Timeline |
|---|---|---|---|
| Up-Front Capex Premium of Sustainable Materials | -1.8% | United States (coastal metro areas), Canada (urban centers) | Short term (≤ 2 years) |
| Regional Grid-Congestion and Interconnection Queue Backlog | -1.5% | United States (PJM, ERCOT, CAISO territories) | Medium term (2-4 years) |
| Limited Availability of Low-Carbon Concrete and Steel | -1.2% | United States (nationwide), Mexico (industrial zones) | Long term (≥ 4 years) |
| Skilled-Labor Shortage for High-Density Deployments | -0.9% | United States (secondary markets), Canada (Alberta, Saskatchewan) | Medium term (2-4 years) |
| Source: Mordor Intelligence | |||
Up-Front Capex Premium of Sustainable Materials
Low-carbon concrete and recycled steel raise shell construction budgets by 8-12% and compress development yields for colocation REITs that must honor dividend payouts. Equinix disclosed that sustainable materials added USD 15-20 million to a typical 30 MW build, a surcharge hyperscalers can absorb through longer depreciation schedules. ESG-minded lenders now request ISO 14064 embodied-carbon disclosures, making design choices visible during project finance diligence and tilting funding toward operators with proven materials supply chains.
Regional Grid-Congestion and Interconnection Queue Backlog
PJM and ERCOT territories report 18-24-month delays amid surging applications from renewable developers and hyperscalers. Berkeley Lab quantified a 2,600 GW national interconnection backlog in 2024, twice the existing U.S. generation capacity, signaling that grid access, rather than capital, is the critical growth constraint.[3]Berkeley Lab Grid Team, “Interconnection Queue Study,” energy.gov FERC Order 2023 shifted upgrade costs to interconnection customers, elevating project risk and favoring incumbents with established capacity reservations.
*Our forecasts treat driver/restraint impacts as directional, not additive. The impact forecasts reflect baseline growth, mix effects, and variable interactions.
Segment Analysis
By Component: Services Expand as Carbon Accounting Grows Complex
The services segment is forecast to grow at a 19.32% CAGR from 2026-2031, outpacing broader North America green data center market growth as operators outsource emissions tracking, renewable certificate procurement, and grid-balancing software. Operators integrate real-time carbon APIs into orchestration stacks, triggering workload migration when grid intensity spikes, a capability previously limited to hyperscalers. Professional services now bundle energy audits, LEED compliance, and PPA structuring, while post-install offerings cover battery recycling and diesel-generator replacement. Within solutions, power infrastructure commands the largest share because 40-60 kW racks require 480 V or 600 V distribution and substation upgrades that exceed USD 10 million per hall.
Solutions retained 63.65% of the market share in 2025, led by liquid-cooling retrofits and AI-optimized power distribution that shrink mechanical footprints. Vendors are bundling hardware with recurring monitoring contracts; Trane Technologies’ USD 1 billion purchase of LiquidStack exemplifies this move toward lifecycle revenue. As Scope 2 reporting tightens, managed-service providers that guarantee hourly carbon compliance can charge premium fees, sustaining double-digit growth rates.


By Tier Type: Tier 4 Adoption Rises Under Sovereign-Cloud Mandates
Tier 4 deployments are projected to advance at a 19.77% CAGR between 2026-2031 as financial institutions and government agencies push for fully fault-tolerant designs with diesel-free backup. Dual utility feeds, 2N UPS topologies, and modular liquid cooling raise capital intensity by 40-50% relative to Tier 3, but regulators increasingly equate Tier 4 certification with mission-critical reliability. Tier 3 sites held 52.86% share in 2025, reflecting enterprise comfort with N+1 redundancy at lower cost.
Technology suppliers are responding with higher-efficiency architectures. Vertiv’s modular Liebert EXL S1 UPS achieves 97% efficiency in double-conversion mode, cutting HVAC loads and freeing floor space for additional racks. Operators also pair Tier 4 builds with LEED Platinum certification to signal embodied-carbon reductions, creating multilayered differentiation that supports elevated lease rates.
By Data Center Size: Hyperscale Campuses Lead Density Wave
Hyperscale builds are on course for a 19.46% CAGR as AI inference clusters demand 100 MW-plus campuses and 250 kW immersion-cooled racks. Large facilities held 50.17% of the market share in 2025, but densification requirements are rendering many raised-floor halls obsolete. Microsoft’s immersion technology enables 250 kW racks that conventional air systems cannot support, amplifying the appeal of purpose-built greenfield campuses.
Medium and small data centers remain relevant for latency-sensitive workloads such as trading or gaming. However, their growth lags behind as 5G edge deployments fall short of initial expectations. Manufacturers of modular prefabricated halls can deliver 12-month build cycles, which appeal to cloud providers racing to activate GPU capacity before training datasets shift.

By Data Center Type: Hyperscalers Verticalize Renewable Portfolios
Hyperscaler-owned sites are expected to grow at a 19.63% CAGR through 2031, surpassing colocation growth. Cloud giants are prioritizing direct renewable procurement and bespoke cooling to meet their operational needs. Meta’s USD 30 billion Louisiana commitment and Amazon’s multi-state pipeline highlight how vertically integrated models bypass third-party colos in favor of self-developed campuses.
Colocation dominates the market with 53.14% of market share in 2025. It maintains advantages where cross-connect density and carrier neutrality matter, but capital-intensive battery storage and liquid cooling erode thin REIT development spreads. Sovereign-cloud mandates open a niche for security-cleared colos, while joint-venture structures like Equinix’s xScale series enable participation in hyperscale economics without loading REIT balance sheets.
Geography Analysis
The United States captured 79.62% of North America green data center market share in 2025, anchored by Northern Virginia’s 2 GW installed base, Texas’s deregulated power markets, and California’s enterprise concentration. Loudoun County remains the world’s largest data center hub, yet transmission bottlenecks are redirecting hyperscalers toward ERCOT territories where demand-response revenues offset interconnection risk. California’s Title 24 codes mandate hourly carbon accounting, driving battery-storage adoption and dispatchable renewable contracts. The U.S. Energy Information Administration projected that data center electricity demand could triple by 2030, emphasizing that grid access rather than capital will determine deployment velocity.
Canada is forecast to achieve a 19.89% CAGR from 2026-2031, the fastest pace in the region, fueled by low-cost hydropower and favorable climate. Hydro-Québec delivers industrial rates below USD 0.05 per kWh with 99% carbon-free generation, attracting AI training clusters tolerant of moderate latency. Toronto and Montreal colocation facilities offer sub-10-millisecond round-trip latency to New York exchanges, satisfying financial-sector requirements. British Columbia’s escalating carbon tax is prompting a shift toward all-electric backup systems, raising entry barriers for smaller operators unable to absorb upfront capital premiums.
Mexico remains a nascent segment but is accelerating as nearshoring manufacturers demand low-latency edge compute for industrial IoT and real-time analytics. Monterrey, Querétaro, and Guadalajara are emerging as connectivity nodes that replicate U.S. workloads for disaster-recovery compliance under the United States-Mexico-Canada Agreement. Grid reliability challenges persist, yet the Federal Electricity Commission’s renewable-energy auctions aim to stimulate industrial self-supply. Air-quality regulations in Mexico City are nudging operators toward hydrogen or natural-gas backup power, a trend likely to spread to northern industrial corridors in the next five years.
Competitive Landscape
The North America green data center market displays fragmented. Schneider Electric, Vertiv, and Eaton dominate power and cooling, leveraging decades of field data to embed AI controls that raise mechanical efficiency and justify premium pricing. Hyperscalers such as Amazon Web Services, Microsoft, Google, and Meta are vertically integrating by acquiring renewable-energy developers, guaranteeing utility-scale PPAs that small colos cannot match. Colocation REITs like Equinix and Digital Realty rely on carrier-neutral meet-me rooms and metropolitan land banks, but REIT payout rules restrict retained earnings, slowing investment in next-generation cooling.
Technology leadership has become the competitive fulcrum. Operators deploying real-time carbon APIs, predictive maintenance, and liquid-cooling retrofits secure 10-15% lease-rate uplifts that offset 15-20% capex premiums for low-carbon materials. Modular builders compress construction timelines from 24 months to about 12 months, appealing to hyperscalers facing GPU supply-chain deadlines. Schneider Electric’s 2024 patent filings for integrated prefabricated electrical rooms with battery storage underscore incumbent moves to defend share against these modular entrants.
Regulation also differentiates players. Tier 4 certification, LEED Platinum status, and ISO 50001 energy-management compliance serve as proof points for enterprise procurement teams. Hyperscalers, however, increasingly rely on proprietary metrics that focus on rack-level utilization and hourly carbon alignment rather than broad certifications. Start-ups targeting hydrogen fuel-cell backup, carbon-credit aggregation, and demand-response monetization represent potential acquisition targets as incumbents seek to widen service portfolios.
North America Green Data Center Industry Leaders
Equinix Inc.
Digital Realty Trust Inc.
Amazon Web Services
Schneider Electric SE
Microsoft Corporation
- *Disclaimer: Major Players sorted in no particular order

Recent Industry Developments
- February 2026: Microsoft announced the roll-out of microfluidic two-phase immersion cooling across five new U.S. sites, a USD 2 billion upgrade expected to cut PUE by up to 0.20 points.
- February 2026: Equinix committed USD 1.5 billion to three xScale facilities in Northern Virginia, Dallas, and Silicon Valley, each designed for GPU-dense workloads with 100% renewable energy matching.
- January 2026: Digital Realty raised USD 800 million in green bonds to fund low-carbon construction across four North American builds targeting LEED Platinum certification.
- January 2026: Vertiv launched its next-generation AI-driven Liebert DSE thermal system, reporting 25% energy savings versus legacy CRAC units.


Research Methodology Framework and Report Scope
Market Definitions and Key Coverage
Our study defines the North America green data center market as the yearly revenue generated from newly built or comprehensively retro-fitted facilities that achieve demonstrable energy or water efficiency gains through solutions such as renewable-source power, liquid or free-air cooling, DCIM-driven optimization, and circular-economy material choices. The scope spans colocation, hyperscale, and enterprise sites across the United States, Canada, and Mexico, capturing associated design, build, and integrated-infrastructure revenues.
Scope exclusion: Minor refurbishments that only add IT load without materially lowering PUE or WUE are outside this estimate.
Segmentation Overview
- By Component
- By Service
- System Integration
- Monitoring Services
- Professional Services
- Other Services
- By Solution
- Power
- Cooling
- Servers
- Networking Equipment
- Management Software
- Other Solutions
- By Service
- By Tier Type
- Tier 1 and 2
- Tier 3
- Tier 4
- By Data Center Size
- Small Data Center
- Medium Data Center
- Large Data Center
- Hyperscale Data Center
- By Data Center Type
- Colocation Data Center
- Hyperscalers Data Center/CSPs
- Enterprise and Edge Data Center
- By Country
- United States
- Canada
- Mexico
Detailed Research Methodology and Data Validation
Primary Research
Mordor analysts interviewed data-center developers, equipment vendors, and state-level energy regulators across the three countries. Conversations clarified typical green-premium capex, emerging SMR pilot timelines, and average renewable-PPA strike prices, which in turn anchored cost curves and forecast adoption rates.
Desk Research
We began by scanning open datasets from sources such as the U.S. Energy Information Administration, Natural Resources Canada, Mexico's Secretaria de Energia, the Uptime Institute's public PUE database, and regional trade bodies like the Canadian Renewable Energy Association. Company 10-Ks, utility tariff filings, and building-permit records helped validate price and capacity assumptions, while peer-reviewed journals on immersion cooling supplied efficiency benchmarks. Paid repositories, including D&B Hoovers for operator financials and Dow Jones Factiva for transaction news, were tapped to cross-check revenue splits and project pipelines. This list is illustrative; many other public and subscription sources informed the evidence base.
Market-Sizing & Forecasting
A top-down reconstruction of regional demand pools (grid power additions, hyperscale land-bank announcements, and renewable-capacity pipelines) set the ceiling, which was then corroborated through selective bottom-up roll-ups of major operators' disclosed build plans and sampled ASP × rack counts. Key variables include average PUE progression, renewable-energy penetration, liquid-cooling share, hyperscale share of new MW, and state tax-incentive uptake. Multivariate regression on these drivers produced the 2025-2030 trajectory, with scenario analysis adjusting for power-grid bottlenecks. Data gaps in operator disclosures were bridged using benchmark ratios from similar facilities and validated through two rounds of expert calls.
Data Validation & Update Cycle
Outputs pass variance checks against historical PUE trends, utility-scale renewable additions, and quarterly capex guidance. A senior analyst reviews anomalies before sign-off. We refresh the model every twelve months and trigger mid-cycle updates when material events, such as federal tax-credit changes or multi-gigawatt campus announcements, occur.
Building confidence in our North America Green Data Center Baseline for sustainable facilities
Published figures often diverge because studies differ on whether retrofits qualify, how power-purchase agreements are valued, and which currency and inflation bases feed the model.
Key gap drivers include (a) competitor studies treating retrofits and new builds alike, (b) use of global ASP averages that ignore North American labor premiums, and (c) slower refresh cadences that miss the 2024 surge of U.S. renewable PPAs.
Benchmark comparison
| Market Size | Anonymized source | Primary gap driver |
|---|---|---|
| USD 47.60 B (2025) | Mordor Intelligence | - |
| USD 30.96 B (2024) | Global Consultancy A | excludes Mexico, applies uniform 20 % retrofit discount |
| USD 26.04 B (2024) | Industry Association B | counts only solution revenue, omits services and land acquisition |
In sum, our disciplined scope choices, driver-based model, and annual refresh give decision-makers a balanced and transparent baseline they can trace back to clear variables and repeatable steps.


Key Questions Answered in the Report
What were the market’s size and growth rate from 2026 to 2031?
The North America green data center market stood at USD 56.14 billion in 2026 and is projected to reach USD 128.56 billion by 2031, reflecting an 18.02% CAGR.
Which component segment is expanding the fastest?
Services, covering carbon-accounting, grid-balancing, and renewable-certificate procurement, are forecast to grow at a 19.32% CAGR through 2031.
Why are Tier 4 facilities gaining traction?
Financial-services and sovereign-cloud mandates require five-nines uptime without diesel backup, driving Tier 4 deployments at a 19.77% CAGR.
How is Canada influencing regional capacity growth?
Abundant hydropower and sub-USD 0.05 per kWh industrial rates in Quebec and Ontario support the region’s leading 19.89% CAGR through 2031.
What technology enables 250 kW rack densities?
Microfluidic two-phase immersion cooling removes chilled-water dependencies, supporting extreme GPU densities and reducing PUE.
Which ownership model is projected to outpace colocation growth?
Hyperscaler-owned campuses are expected to rise at a 19.63% CAGR because cloud providers favor direct renewable procurement and custom high-density infrastructure.
Page last updated on:


