
Market Overview
| Study Period | 2021 - 2031 |
|---|---|
| Forecast Data Period | 2026 - 2031 |
| Base Year Market Size (2025) | USD 1.21 Billion |
| Market Size (2026) | USD 1.24 Billion |
| Market Size (2031) | USD 1.38 Billion |
| Growth Rate (2026 - 2031) | 2.19 % |
| Market Concentration | High |
Major Players
*Disclaimer: Major Players sorted in no particular order Image © Mordor Intelligence. Reuse requires attribution under CC BY 4.0. |
|
Mexico Oil And Gas Downstream Market Analysis by Mordor Intelligence
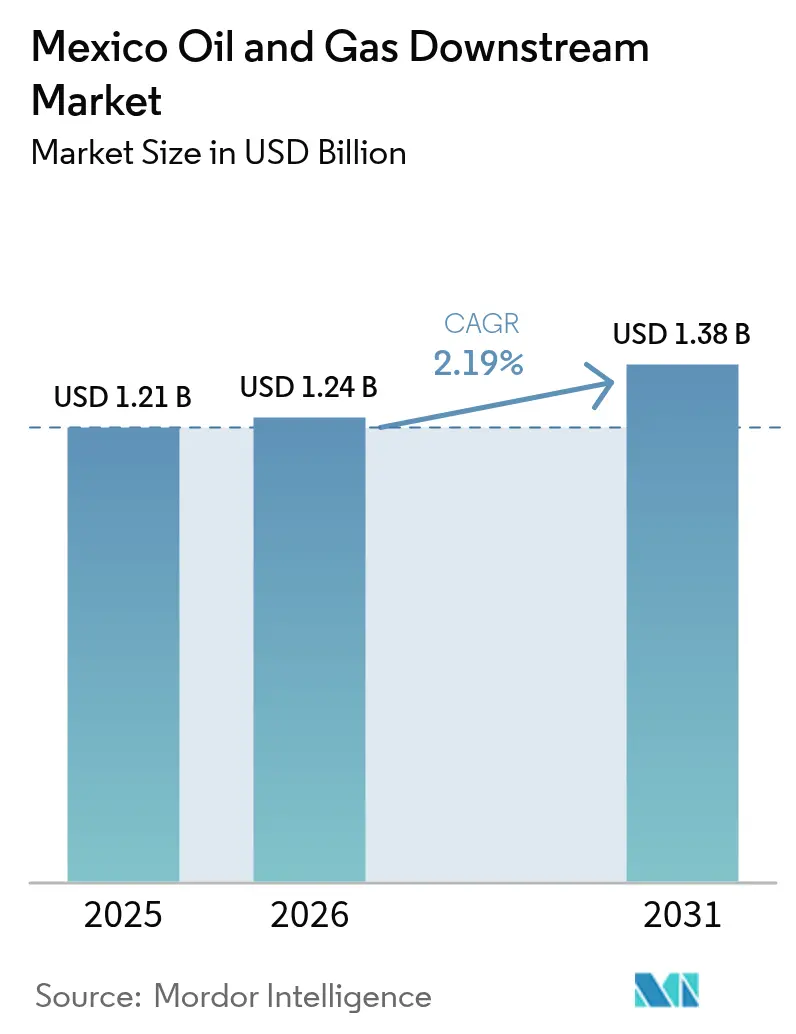
Mexico Oil And Gas Downstream Market size in 2026 is estimated at USD 1.24 billion, growing from 2025 value of USD 1.21 billion with 2031 projections showing USD 1.38 billion, growing at 2.19% CAGR over 2026-2031.
State‐backed refinery upgrades, the integration of Deer Park, and the phased start-up of Dos Bocas underpin the gradual expansion of the Mexico oil and gas downstream market, while chronic maintenance shortfalls curb utilization gains. Demand tailwinds stem from a larger vehicle fleet, near-shoring-driven petrochemical requirements, and growth in marine bunkering at Gulf and Pacific ports. Competitive intensity remains moderate because PEMEX retains operational control of pipelines, terminals, and retail pricing. Nonetheless, specialized storage and import terminals being built by private firms reveal niches where the Mexico oil and gas downstream market can still liberalize. The shift from autonomous regulators to a single National Energy Commission simplifies permitting but heightens policy risk for foreign investors.(1)
Key Report Takeaways
- By type, refineries led with 64.10% of the Mexico oil and gas downstream market share in 2025; petrochemical plants are projected to grow at a 4.03% CAGR to 2031.
- By product type, refined petroleum products accounted for 49.30% of the Mexican oil and gas downstream market size in 2025; petrochemicals are expected to advance at a 3.74% CAGR through 2031.
- By distribution channel, direct sales and wholesale held 61.70% of the Mexican oil and gas downstream market share in 2025, whereas distributors and commercial channels are expected to post the highest 4.41% CAGR over 2026-2031.
Note: Market size and forecast figures in this report are generated using Mordor Intelligence’s proprietary estimation framework, updated with the latest available data and insights as of 2026.
Market Trends and Insights
Drivers Impact Analysis of Mexico Oil And Gas Downstream Market*
| Driver | (~) % Impact on CAGR Forecast | Geographic Relevance | Impact Timeline |
|---|---|---|---|
| Government refinery-upgrade program | +0.8% | Gulf Coast refineries | Medium term (2-4 years) |
| Rising gasoline & diesel consumption | +0.6% | Nationwide, stronger in northern border states | Long term (≥ 4 years) |
| Commissioning of Dos Bocas capacity | +0.4% | Gulf Coast | Short term (≤ 2 years) |
| Liberalized fuel-retail rules | +0.3% | Major urban centers | Medium term (2-4 years) |
| Near-shoring petrochemical demand | +0.7% | Northern clusters | Long term (≥ 4 years) |
| Marine bunkering surge | +0.2% | Gulf & Pacific ports | Medium term (2-4 years) |
| Source: Mordor Intelligence | |||
Government refinery-upgrade program bolstering utilization rates
Processing volumes across PEMEX’s six refineries climbed from 511 kb/d in 2018 to 1.23 MMb/d by early 2024 after successive rehabilitation outlays and Deer Park’s integration. The National Refining System is budgeted MX$136 billion through 2030 to replace critical units, debottleneck coking trains, and raise power reliability. While these efforts underpin the Mexican oil and gas downstream market, actual utilization still lingers below 60% because recurring maintenance backlogs outpace annual capital expenditure (capex) allocations. Dos Bocas reached only 115 kb/d throughput—34% of its design capacity—by May 2025, reflecting the absence of cogeneration and gas interconnects. The 2025-2035 roadmap now prioritizes debt reduction to unlock cash flow for turnarounds, a move expected to lift the Mexico oil and gas downstream market in the medium term.(2)
Commissioning of Dos Bocas refinery adding 340 kbd new capacity
Dos Bocas is the country’s largest downstream investment in decades, designed for 340,000 barrels per day of heavy-crude runs that could trim Mexico’s gasoline and diesel import dependence by 30%. Operational reality diverged from design: the plant reached only 115 kbd—34% of its nameplate capacity—by May 2025 because the cogeneration island and natural-gas interconnects were not yet finished. Its location in Tabasco provides direct access to Maya crude from Cantarell and Ku-Maloob-Zaap, reducing haulage costs compared to imported light blends. Even at reduced throughput, Dos Bocas has proven it can yield gasoline, diesel, and fuel oil that previously required costly imports. Once the cogeneration unit, sulfur-recovery trains, and tank-farm tie-ins are completed, the refinery is expected to increase national processing capacity beyond 1.5 MMb/d, thereby reinforcing the Mexican oil and gas downstream market. Continuous monitoring through SEMARNAT’s environmental framework ensures emissions control and wastewater handling, aligning with federal energy sovereignty goals.
Rising gasoline & diesel consumption from an expanding vehicle fleet
Mexico added nearly 900,000 light and heavy vehicles in 2024, maintaining nationwide sales resilience despite inflationary pressures. Northern border states post the fastest demand growth because cross-border logistics rely heavily on diesel, thereby elevating regional demand for the Mexican oil and gas downstream market. The federal government capped average retail prices at MX$23 per liter in 2025 and synchronized the IEPS tax adjustment at 4.5%, shielding demand from volatility. These measures stabilize margins for wholesale distributors while sustaining throughput requirements at refineries. Pipeline congestion and limited storage capacity, however, still hamper timely product flow to inland terminals.
Near-shoring-led petrochemical demand boom in northern clusters
Relocation of electronics, automotive, and packaging supply chains has attracted more than USD 20 billion of greenfield commitments into Tamaulipas, Nuevo León, and Coahuila. This surge prompts the addition of ethane and propane streams, encouraging joint ventures and the construction of import terminals that expand the Mexican oil and gas downstream market. Braskem Idesa’s ethane terminal and the Pacifico Mexinol complex—set to deliver 2.1 million t/y methanol using carbon-capture technology—represent flagship investments supported by IFC and multilaterals.(3) Although feedstock tightness persists, PEMEX has signaled its willingness to formalize supply contracts, anchoring private confidence.
Restraints Impact Analysis of Mexico Oil And Gas Downstream Market*
| Restraint | (~) % Impact on CAGR Forecast | Geographic Relevance | Impact Timeline |
|---|---|---|---|
| Maintenance backlogs keeping utilization <60% | -0.5% | All six refineries | Short term (≤ 2 years) |
| Policy volatility deterring FDI | -0.4% | Nationwide | Medium term (2-4 years) |
| Decarbonization limits on fossil funding | -0.3% | ESG-sensitive regions | Long term (≥ 4 years) |
| High-sulfur fuel-oil surplus | -0.2% | Gulf Coast | Short term (≤ 2 years) |
| Source: Mordor Intelligence | |||
Chronic maintenance backlogs keeping utilization below 60%
Supplier arrears topping MX$430 billion have led key contractors to idle rigs and curtail works, a scenario that translates into fewer spare parts and delayed turnarounds across the Mexico oil and gas downstream market. The Cadereyta refinery is scheduled to face 2025 environmental hearings that could restrict throughput until emission controls are improved. Pemex secured a USD 10 billion liability management package but still requires additional funding to cover pipeline inspections, storage roof repairs, and delayed coker upgrades. The new “Oil Rights for Well-Being” fiscal scheme promises lighter royalty loads; however, the timing of its execution remains uncertain. Until full funding is secured, operational rates remain subdued.
Policy volatility and frequent contract reviews deterring FDI
The January 2025 secondary energy laws merged CRE and CNH into a National Energy Commission, centralizing approvals under SENER and boosting state oversight. Shell’s sale of more than 200 stations to Iconn underscores how abrupt rule changes are pushing established multinationals to scale back. Although mixed contracts remain possible, uncertainty surrounding import permits, storage concessions, and clean-fuel targets makes long-term capital expenditures unattractive. This restraint tempers external capital inflows that could otherwise expand the Mexico oil and gas downstream market.
*Our forecasts treat driver/restraint impacts as directional, not additive. The impact forecasts reflect baseline growth, mix effects, and variable interactions.
Mexico Oil And Gas Downstream Market Segment Analysis
By Type:
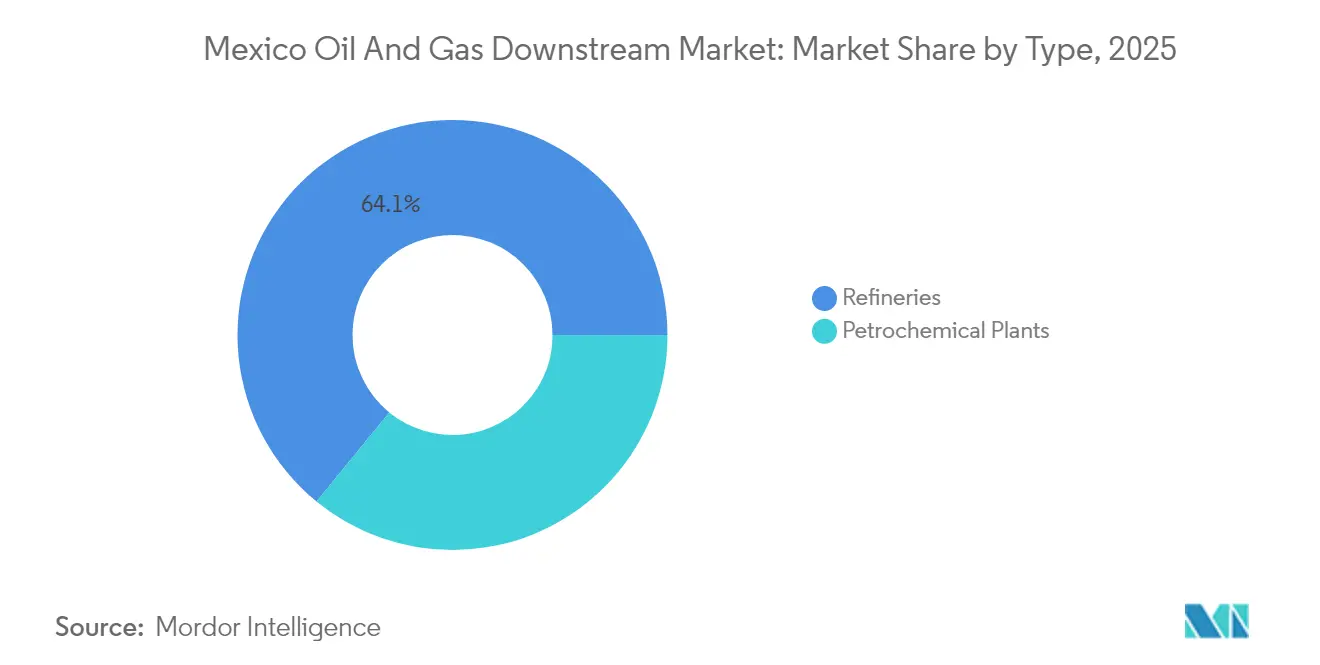
Refineries drive capacity while petrochemicals accelerateRefineries accounted for 64.10% of Mexico's oil and gas downstream market in 2025, a dominance amplified by the Deer Park acquisition and the start-up of Dos Bocas. Despite the increase, refinery utilization lags behind design capacity because maintenance scheduling cannot keep pace with component failures. The Mexico oil and gas downstream market size attributed to refineries is expected to increase, as MXD 136 billion in federal funds is allocated to desulfurization, power generation, and dock expansion.
Petrochemical plants, in contrast, are expected to log a 4.03% CAGR to 2031, the fastest within the Mexican oil and gas downstream market. The Pacifico Mexinol project and Braskem Idesa's ethane terminal open additional capacity that meets near-shoring-driven demand, positioning northern clusters as major consumers. Sustained feedstock contracts and private-sector operational discipline underpin the petrochemical trajectory.

By Product Type:
Refined products maintain leadership despite petrochemical momentumRefined petroleum products accounted for 49.30% of Mexico's oil and gas downstream market in 2025, supported by price caps and import substitution drives that raised domestic throughput. The Mexico oil and gas downstream market size for refined products is projected to expand steadily as improved utilization lifts diesel and gasoline output.
Petrochemicals, although smaller today, are experiencing a 3.74% CAGR driven by near-shoring and low-carbon mandates that favor methanol, polyethylene, and specialty resins. Lubricants remain a niche but stable segment, feeding heavy-industry hubs in Monterrey and Saltillo.
By Distribution Channel:
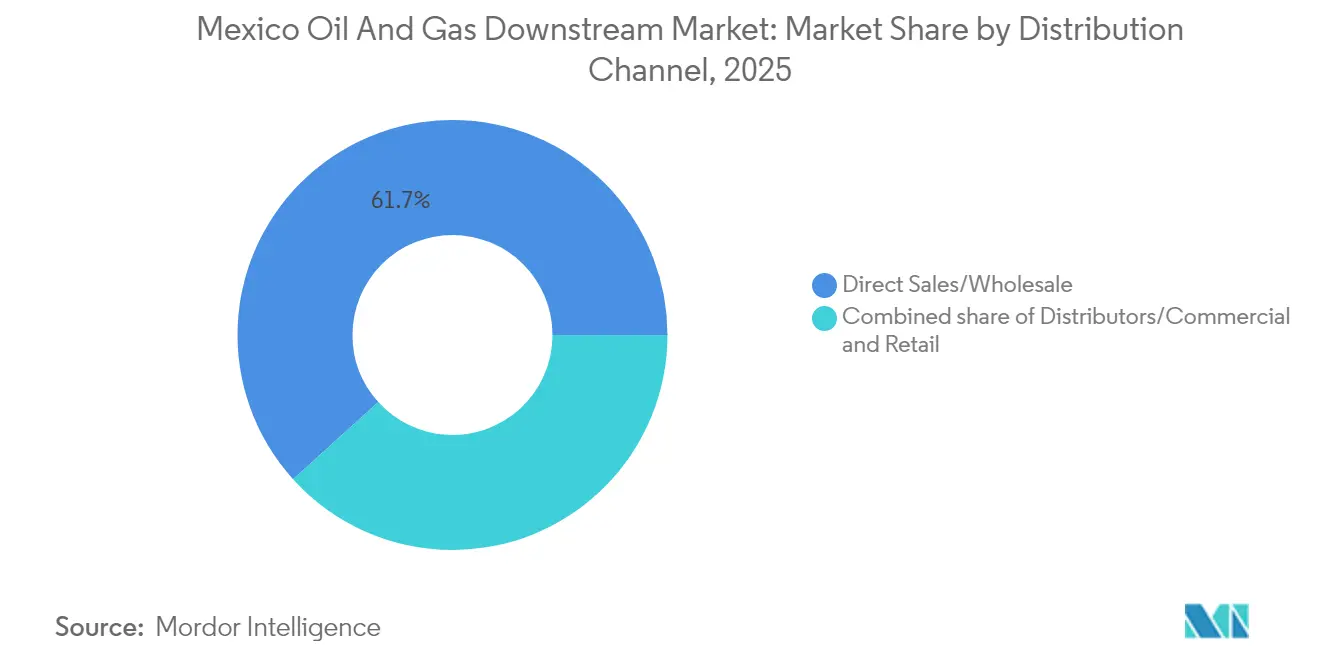
Wholesale dominance faces commercial-channel growthDirect sales and wholesale operations accounted for 61.70% of the Mexican oil and gas downstream market in 2025, as PEMEX Logística utilized its pipeline and terminal network to supply government agencies and large distributors. The Mexico oil and gas downstream market share of wholesale channels may contract modestly as specialized distributors capture customers seeking flexible terms and conditions.
Distributors and commercial outlets will post a 4.41% CAGR through 2031, leveraging import terminals and private storage to offer blended grades, low-sulfur bunkers, and petrochemical feedstocks. Retail remains constrained by brand exits, yet domestic players, such as Oxxo Gas and Iconn, continue to expand their networks under local franchise models.
Geography Analysis
The Gulf Coast remains the operational backbone of the Mexico oil and gas downstream market, hosting five of six PEMEX refineries and the new Dos Bocas site. Crude proximity and dock infrastructure provide the region with scale advantages, although lingering maintenance gaps limit utilization. Northern border states form the fastest-growing demand corridor, fueled by USMCA trade flows and USD-pegged retail pricing that encourages diesel uptake for logistics fleets.
Central Mexico, anchored by Mexico City, Guadalajara, and Querétaro, consumes more than one-third of the nation's gasoline yet relies on long-haul pipelines and rail. IEnova's 650,000-barrel terminal, located outside the capital, reduces stock-out risk and increases flexibility for the Mexican oil and gas downstream market.
Pacific ports—Manzanillo, Topolobampo, and Lázaro Cárdenas—are emerging as bunkering and petrochemical export hubs. The Pacifico Mexinol complex utilizes Topolobampo's deepwater access to ship green and blue methanol to Asian customers, reflecting geographic diversification within the Mexican oil and gas downstream market.
Regulatory Landscape
Mexico's downstream activity is governed by the Ley de Hidrocarburos and its implementing regulations, including the Reglamento de la Ley del Sector Hidrocarburos published on October 3, 2025. In practice, the framework reflects more centralized decision-making under SENER and the National Energy Commission (CNE) referenced in the report context. Operational permitting and economic regulation historically sit with CRE, while ASEA oversees industrial safety and environmental compliance, resulting in parallel permitting and verification requirements for service stations, terminals, and other distribution assets.
Safety, traceability, and facility registration have become more compliance-intensive for fuel retail and LPG infrastructure. A March 7, 2025 agreement established the Registro Nacional de Instalaciones de Gasolinas y Gas Licuado de Petroleo (RENAGAS) for registering service stations and LPG distribution plants. ASEA also advanced PROY-NOM-023-ASEA-2025 (public consultation initiated after approval in October 2025) to update technical safety and environmental specifications for service stations, replacing legacy requirements under NOM-005-ASEA-2016. Together, these updates increase the need for documented maintenance and operational controls for permit holders across the Mexico oil and gas downstream market.
Competitive Landscape
The Mexico oil and gas downstream market is moderately concentrated. PEMEX maintains ownership of refining, trunk pipelines, and key storage terminals, thereby gaining structural control over approximately 80% of the national throughput. Foreign firms continue to participate, but now favor joint ventures or service contracts over equity stakes, as illustrated by Transition Industries' partnership with NextChem and Veolia on the Pacifico Mexinol facility.
Private players are directing capital toward complementary assets—such as import terminals, ethane logistics, and digital fuel management systems—that do not directly challenge PEMEX's core refineries. IEnova and Monterra Energy focus on multi-product terminals that fill regional supply gaps. EPC specialists, such as Bonatti, secure infrastructure packages tied to government priorities, thereby avoiding the regulatory headwinds that confront retail and midstream newcomers.
Retail consolidation persists: Shell transferred its network to Iconn while BP and Repsol slowed site roll-outs, preferring branded fuel supply contracts over owned stations. Domestic operators Oxxo Gas and G500 pursue scale through franchising, but their broader impact on the Mexico oil and gas downstream market will depend on securing consistent supply from PEMEX or alternative importers.
Mexico Oil And Gas Downstream Industry Leaders
-
Petróleos Mexicanos
-
Braskem Idesa
-
IEnova (Sempra Infraestructura)
-
Valero Energy México
-
Shell México
- *Disclaimer: Major Players sorted in no particular order

Mexico Oil And Gas Downstream Market Companies Covered in this Report
- Petróleos Mexicanos (Pemex)
- Braskem Idesa
- IEnova (Sempra Infraestructura)
- Shell México
- TotalEnergies México
- Valero Energy México
- ExxonMobil México
- BP México
- Chevron México
- Repsol México
- Trafigura México
- Koch Industries (Flint Hills Resources)
- Grupo IDESA
- Samsung Engineering
- Fluor Corporation
- KBR Inc.
- Wood Group
- ICA Fluor
- Techint Ingeniería y Construcción
- Dragados Offshore
Market Opportunities and Future Outlook
State-led petrochemicals and fertilizer reactivation present a clear opportunity area for downstream-linked assets and services, especially where projects depend on logistics, utilities tie-ins, storage, and feedstock handling rather than new standalone fuel retail. In June 2026, PEMEX announced a MX$93 billion comprehensive reactivation plan for petrochemical and fertilizer infrastructure for 2026-2030. The plan includes actions tied to ammonia and urea development at Escolin (Veracruz) and upgrades at complexes such as Cangrejera and Morelos. This agenda supports demand for EPC packages, debottlenecking, reliability upgrades, and specialized storage and terminal capability around existing PEMEX industrial hubs, which matches the report's view that petrochemicals are outpacing refining in growth momentum.
Large private-led molecules projects continue to shape whitespace across terminals, feedstock supply, and port-adjacent infrastructure where industrial demand and export logistics intersect. The Pacifico Mexinol complex at Topolobampo supports a methanol export platform that relies on an integrated supply chain, including gas supply, port handling, and product logistics, reinforcing opportunities for marine bunkering services and complementary midstream assets at the Pacific ports named in the report context. Meanwhile, the post-2025 shift toward centralized oversight and evolving safety standards, such as RENAGAS registration and ASEA's NOM update track, is increasing the role of compliance systems, volumetric control, and traceability tooling in commercial viability for distributors and commercial channels building specialized storage and import terminals.
Recent Industry Developments in Mexico Oil And Gas Downstream Market
- June 2026: Petroleos Mexicanos (Pemex) announced a MX$93 billion investment program for 2026-2030 to rehabilitate petrochemical and fertilizer infrastructure, including projects linked to ammonia and urea and upgrades at major petrochemical complexes. The announcement reinforces petrochemical feedstock and derivative availability as a strategic pillar of Mexico's downstream value chain and supports import-substitution priorities that affect terminals, logistics, and industrial off-take.
- April 2026: Transition Industries marked the groundbreaking of the USD 3.3 billion Pacifico Mexinol ultra-low carbon methanol project in Topolobampo, Sinaloa. Advancing a port-adjacent methanol platform increases demand for downstream-adjacent infrastructure such as storage, handling, utilities tie-ins, and export logistics along Mexico's Pacific corridor.
- March 2025: Pemex reported 70 million liters of seized stolen fuel over eight months, surpassing the total reported for the prior administration's six years. The enforcement focus increases the value of traceability, inventory controls, and compliant distribution practices for wholesalers, distributors, and retail operators across Mexico's fuels supply chain.
Mexico Oil And Gas Downstream Market Report Scope and Research Methodology
Market Definition and Coverage
For this methodology, the Mexico oil and gas downstream market covers the value created after crude oil and natural gas are produced, mainly through refining, petrochemical processing, and the marketing and distribution of finished fuels and related products to end users.
Scope exclusions: Upstream exploration and production and pure midstream transportation and storage services are excluded when they are not tied to downstream processing or product sales.
Segments Covered in This Report
-
By Type
- Refineries
- Petrochemical Plants
-
By Product Type
- Refined Petroleum Products
- Petrochemicals
- Lubricants
-
By Distribution Channel
- Direct Sales/Wholesale
- Distributors/Commercial
- Retail
Data Sources, Market Sizing, and Validation
Desk Research
Desk research was used to set the factual base of the model and to make sure the Mexico-specific constraints were reflected before estimates were finalized. We reviewed public sources such as Mexico energy regulator publications, customs and trade statistics, central bank and national statistics releases, energy ministry and state agency updates, and association pages that track refinery operations and fuels demand.
Along with these, we used company filings, investor presentations, reputable press reporting, and project announcements to understand capacity additions, turnarounds, and product slate changes that can shift output and pricing. In parallel, we referenced paid subscriptions that compile company financials and business intelligence, plus shipment-level import and export tracking where it supported cross-checks. These examples are not exhaustive, and many other public documents were also used for data collection, validation, and clarification.
Primary Interviews and Surveys
Primary work focused on confirming what desk research could not fully answer, especially around effective capacity utilization, product mix shifts, and realized margins across fuels versus petrochemicals. We spoke with refinery and petrochemical operations professionals, downstream marketers, distributors, logistics-linked stakeholders, and industry advisors across Mexico to pressure-test assumptions and remove obvious over-counting.
Survey feedback was also used to align near-term expectations on maintenance timing, demand recovery patterns, and typical pricing pass-through in the domestic market, and then to settle the final inputs used in the forecast.
Distribution of primary research fieldwork respondents
| Company type | Respondent position |
|---|---|
| Top tier: 35% | CXOs: 20% |
| Mid tier: 45% | Functional/Unit leaders: 38% |
| Smaller Players: 20% | Managers: 42% |
Market-Sizing & Forecasting
Sizing was built using a top-down and bottom-up logic. The top-down side starts from Mexico refining capacity and related throughput signals to reconstruct the addressable downstream value pool. Since capacity does not directly equal output, utilization assumptions were adjusted using publicly visible maintenance cycles and then verified through expert checks, followed by conversion into value using product mix and pricing proxies.
To keep the model practical, we tracked a short list of inputs consistently, including refinery capacity by site, estimated utilization ranges, shifts in refined product versus petrochemical output, import dependence for key fuels, and local price spreads versus reference benchmarks. Those spreads were then used to inform achievable realized values.
Bottom-up approximations were used as a control, mainly applying volume times average selling price logic for selected products and channels, then scaling carefully where coverage was incomplete. For forecasting, scenario analysis was applied around three drivers that stakeholders repeatedly highlighted, namely capacity availability, demand sensitivity to economic activity, and the timing of upgrades or constraints that affect product yields. When data gaps appeared, assumptions were carried forward only after they matched at least one independent signal and were consistent with the operational reality described in interviews.
Data Validation & Update Cycle
Validation was done through several checks so the final numbers did not rely on a single data series. We compared model outputs against independent signals such as capacity and utilization expectations, fuel trade movements, and visible policy or operational events that could alter supply availability.
Outliers were flagged and reworked, and any large variance triggered a second review plus targeted re-contact with industry sources to confirm what changed and why. Before sign-off, another analyst review step was completed to make sure assumptions were applied consistently across years. Reports are refreshed annually, and interim updates are made when a material event happens, followed by a final pre-delivery pass so clients receive the latest updated view.
Mordor Intelligence's Mexico Oil and Gas Downstream Market Size Compared Against Other Published Estimates
Published market sizes for Mexico oil and gas downstream can look far apart, even when the titles sound similar, because the included activities are not always the same. Differences usually come from what is counted as downstream value, how capacity and utilization are translated into revenue, and whether prices are treated as realized domestic values or broad reference benchmarks.
The main gap comes from mixing in midstream infrastructure and wider retail fuel sales, where Mordor Intelligence treats downstream as refining and petrochemical activity anchored to capacity and throughput checks, instead of counting the full value of transported, stored, or resold volumes. Other spreads also come from base year choices, aggressive versus conservative utilization assumptions, and currency conversion timing when local price movements are volatile.
Benchmark comparison
| Source | Market Size | Gaps in Research Methodology |
|---|---|---|
| Mordor Intelligence | USD 1.21 B (2025) | |
| Global Consultancy A | USD 34.09 B (2023) | Uses a broader downstream definition that includes a wider set of refined product sales and distribution and marketing value pools, which can inflate totals versus a capacity and throughput anchored approach. |
| Industry Publisher B | USD 38.70 B (2026) | Appears to carry midstream-linked activities and expansive retail and wholesale channel value into the downstream total, and may apply higher utilization and pricing progression assumptions across the forecast window. |
The comparison shows that most of the spread is explained by scope expansion into distribution-heavy value pools and by different utilization and pricing assumptions. By keeping the sizing tied to capacity, utilization, and product mix signals that can be checked year to year, the resulting view stays easier to replicate and to audit when market conditions change.
Key Questions Answered in the Report
What is the projected value of the Mexico oil and gas downstream sector by 2031?
The market is expected to reach USD 1.38 billion by 2031, reflecting a 2.19% CAGR.
How much capacity did Dos Bocas achieve by mid-2025?
The refinery operated at 115 kb/d, equivalent to 34% of its 340 kb/d design.
Which segment grows fastest within the downstream chain?
Petrochemical plants post the quickest growth at a 4.03% CAGR through 2031.
Why are private distributors investing in storage terminals?
They aim to secure flexible supply and capture a 4.41% CAGR opportunity as commercial channels expand.
How does the new National Energy Commission affect investors?
Centralized rule-making speeds up permits but raises policy risk, moderating foreign capital inflows.