North America Fixed Wireless Access Market Size and Share
Market Overview
| Study Period | 2019 - 2030 |
|---|---|
| Forecast Data Period | 2025 - 2030 |
| Historical Data Period | 2019 - 2023 |
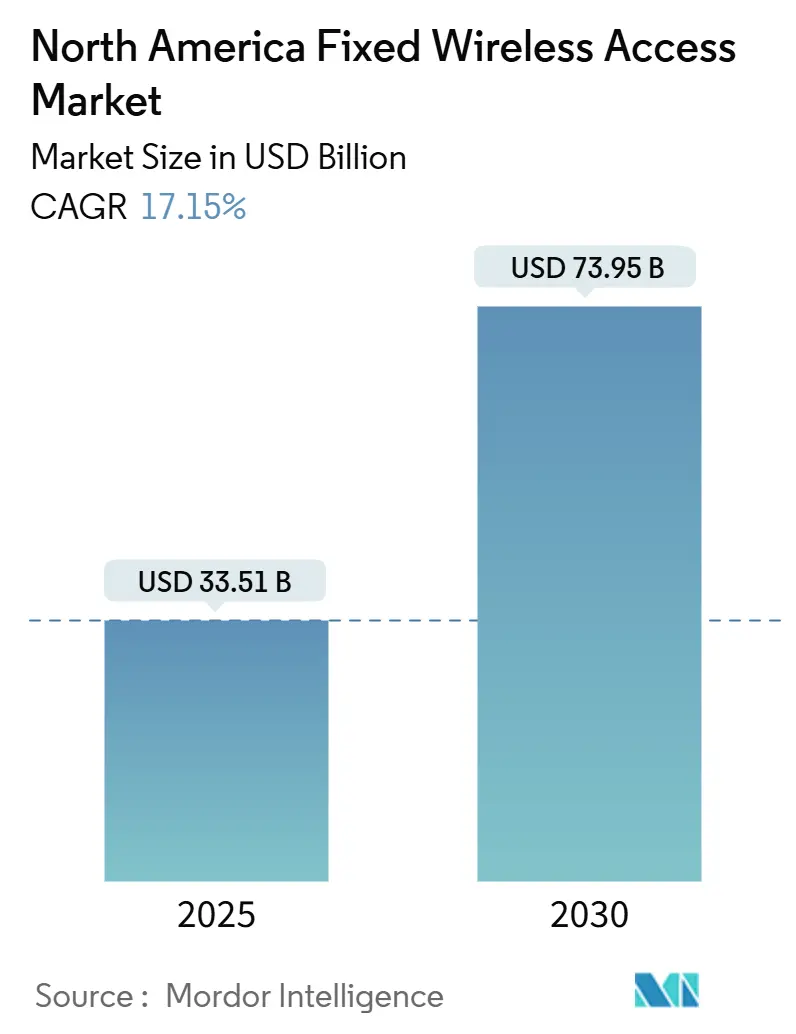
| Market Size (2025) | USD 33.51 Billion |
| Market Size (2030) | USD 73.95 Billion |
| Growth Rate (2025 - 2030) | 17.15% CAGR |
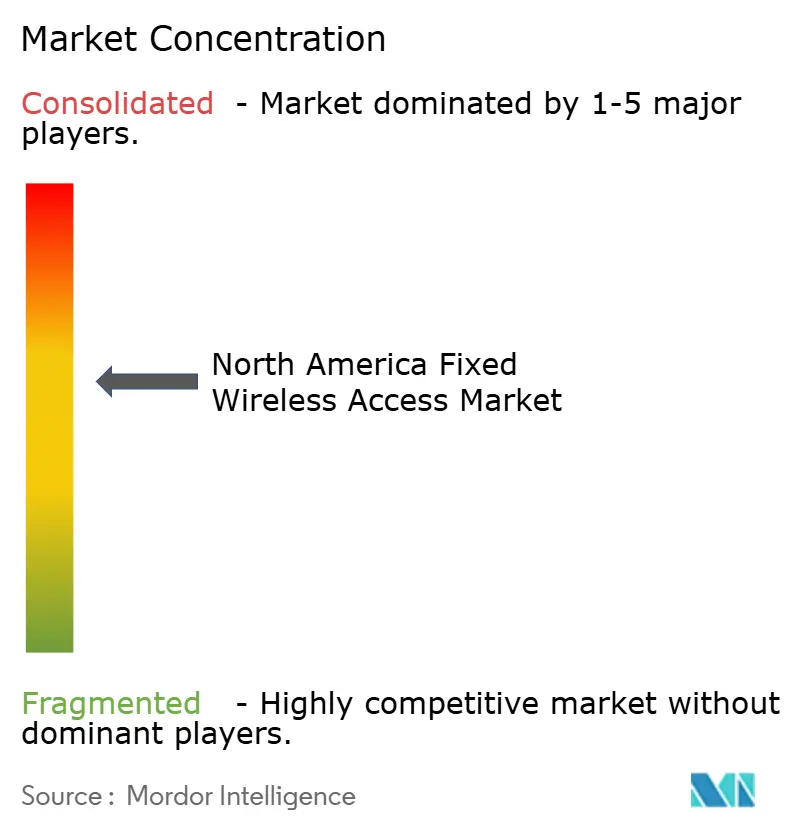
| Market Concentration | Medium |
Major Players *Disclaimer: Major Players sorted in no particular order Image © Mordor Intelligence. Reuse requires attribution under CC BY 4.0. | |
North America Fixed Wireless Access Market Analysis by Mordor Intelligence
The North America Fixed Wireless Access Market size is estimated at USD 33.51 billion in 2025, and is expected to reach USD 73.95 billion by 2030, at a CAGR of 17.15% during the forecast period (2025-2030). Consistent spectrum releases, federal rural broadband subsidies, and lower customer-premise equipment (CPE) prices are combining to accelerate the adoption path for the Fixed Wireless Access market. Tier-1 operators are using mid-band holdings in the C-band and CBRS to deliver gigabit-class speeds while avoiding the high capital intensity and protracted permitting cycles that slow fiber builds. Services anchored to recurring monthly revenue are the dominant monetization model, outdoor CPE installations are gaining ground in fringe coverage areas, and commercial demand is rising sharply as enterprises seek rapid-deployment connectivity options. Competitive pressure from cable DOCSIS 4.0 upgrades is prompting operators to refine their pricing strategies, yet federal programs, such as the USD 42.5 billion BEAD initiative, continue to tilt rural economies toward the Fixed Wireless Access market [1]National Telecommunications and Information Administration, “BEAD Program Overview,” ntia.gov.
Key Report Takeaways
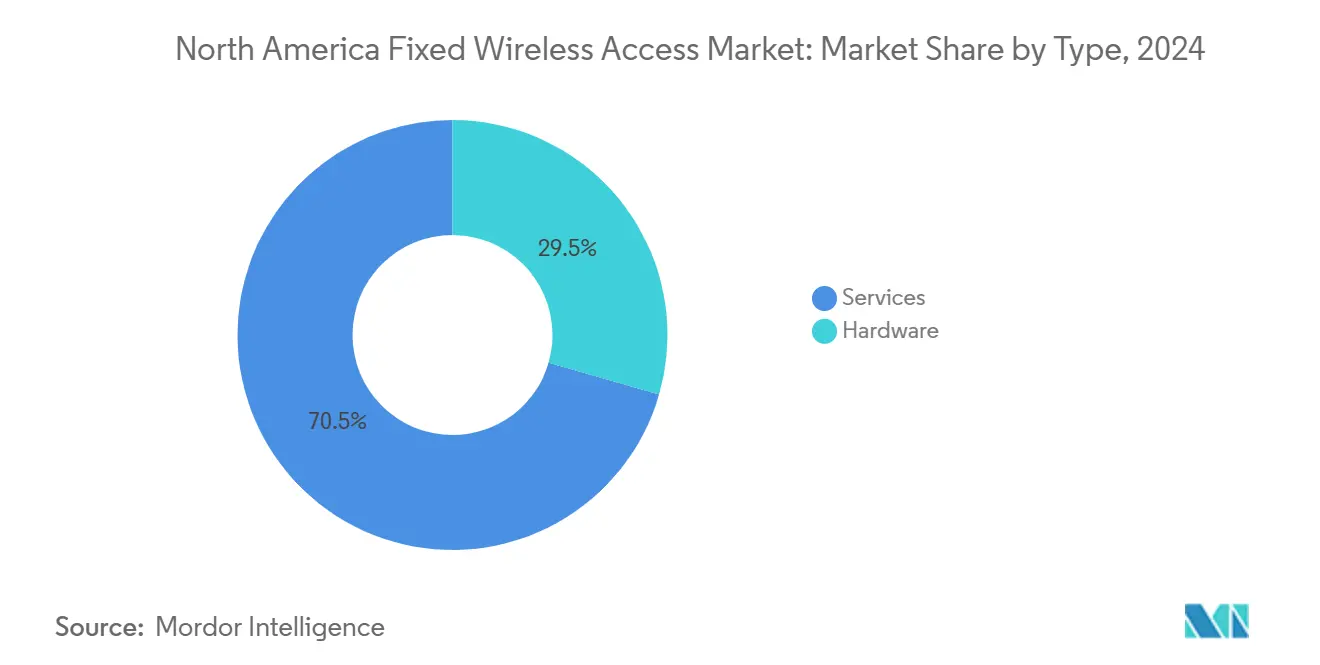
- By type, services accounted for 70.54% of the Fixed Wireless Access market share in 2024, while the hardware category is expected to expand at an 18.83% CAGR through 2030.
- By application, residential held 67.31% of 2024 revenue, whereas the commercial segment is projected to scale at a 25.02% CAGR through 2030.
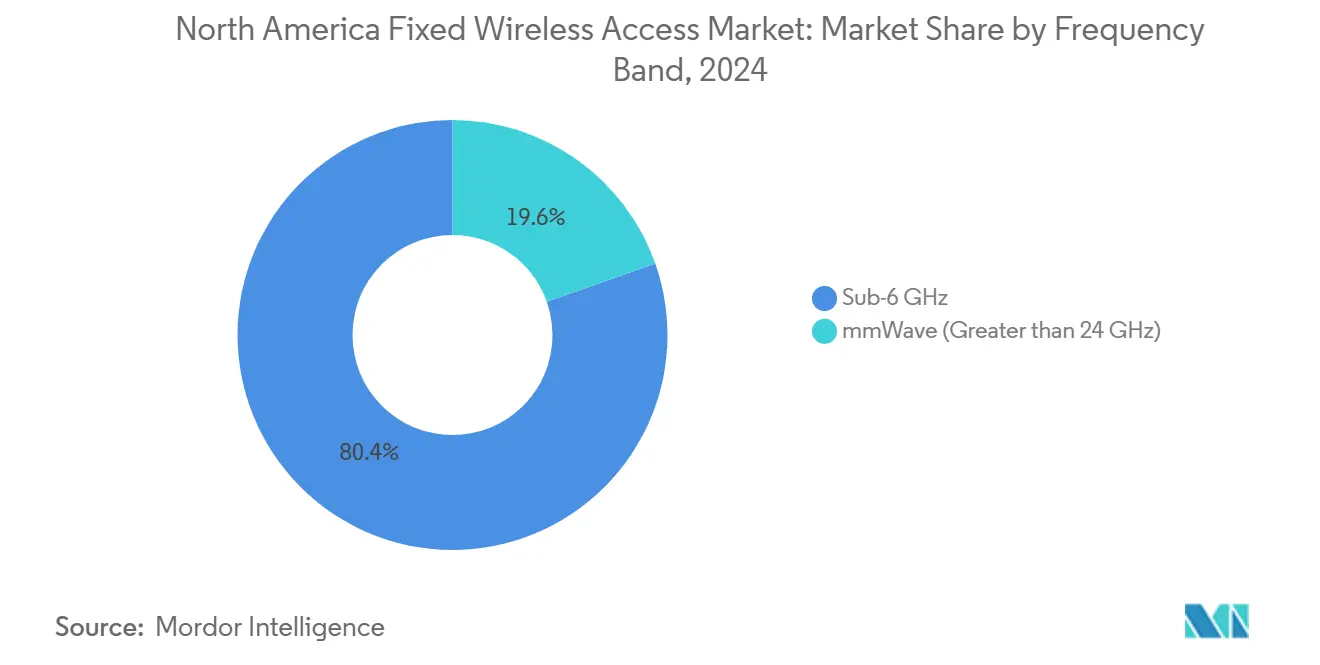
- By frequency band, the Sub-6 GHz band captured an 80.39% share in 2024; the mmWave tier is projected to progress at a 26.47% CAGR through 2030.
- By deployment mode, indoor CPE represented 70.93% of the 2024 value; however, outdoor CPE is projected to grow at a 23.26% CAGR by 2030.
- By country, the United States contributed 85.93% of the 2024 revenue; Mexico is the fastest climber, with a 34.40% CAGR to 2030.
Future direction is shaped by developments occurring across multiple regions, with North america contributing to the overall trajectory. The outlook on worldwide fixed wireless access market reflects how these are expected to evolve collectively.
North America Fixed Wireless Access Market Trends and Insights
Drivers Impact Analysis*
| Driver | (~) % Impact on CAGR Forecast | Geographic Relevance | Impact Timeline |
|---|---|---|---|
| Rapid 5G mid-band roll-outs by Tier-1 US operators | +4.2% | United States, with spillover to Canada | Medium term (2-4 years) |
| C-Band and CBRS regulatory tailwinds unlocking sub-6 GHz capacity | +3.8% | North America, concentrated in urban/suburban markets | Short term (≤ 2 years) |
| Self-install CPE cost decline below USD 200 retail | +2.9% | Global, with early adoption in US rural markets | Short term (≤ 2 years) |
| Federal and state BEAD subsidies favoring FWA for rural broadband | +3.1% | United States, targeting unserved/underserved areas | Long term (≥ 4 years) |
| Telco API exposure enabling SLA-based premium FWA tiers | +1.7% | North America, focused on enterprise segments | Medium term (2-4 years) |
| Generative-AI-driven uplink demand from home devices (AR/XR assistants) | +1.5% | North America, concentrated in high-income households | Long term (≥ 4 years) |
| Source: Mordor Intelligence | |||
Rapid 5G Mid-Band Roll-outs by Tier-1 US Operators
Verizon’s C-band overlay reached 200 million POPs by Q3 2024, enabling typical FWA downlink speeds above 300 Mbps in suburban zones where fiber penetration remains below 40% [2]Verizon Communications, “Investor Presentation Q3 2024,” verizon.com. T-Mobile leverages 2.5 GHz assets to deliver consistent 100+ Mbps service to 90 million eligible households, providing an attractive substitute to aging DOCSIS 3.1 networks. AT&T pursues a C-band densification strategy, aiming for 30 million passings by 2026, which complements fiber rollouts in high-margin metropolitan areas. Mid-band propagation enables near-line-of-sight performance and simplified siting, providing operators with the coverage scale necessary to capitalize on the growth of the Fixed Wireless Access market. Consistent 100 Mbps performance comfortably supports video streaming and remote-work workloads, satisfying a large share of residential demand.
C-Band and CBRS Regulatory Tailwinds Unlocking Sub-6 GHz Capacity
The FCC’s USD 81 billion C-band auction put 280 MHz of contiguous mid-band spectrum into commercial service, underpinning enterprise-grade FWA offers that match wireline SLAs. The CBRS framework adds 150 MHz of lightly licensed spectrum, enabling regional ISPs to launch competitive offers without the heavy upfront licensing burden. A three-tier sharing model protects incumbents while allowing spectrum reuse patterns that increase overall capacity by 3-4 times compared to legacy cellular setups. Equipment vendors, such as Nokia, now ship CBRS-ready small cells optimized for utility-pole mounting, thereby bypassing zoning disputes that often delay macro upgrades. Collectively, these regulatory levers lower entry barriers and broaden the addressable Fixed Wireless Access market.
Self-Install CPE Cost Decline Below USD 200 Retail
Samsung’s FWA6 outdoor gateway reached a USD 149 price point in 2025 carrier channels, more than halving the acquisition cost compared to 2022 designs [3]Samsung Networks, “FWA6 Gateway Datasheet,” samsung.com. Ericsson’s Radio Dot indoor unit is available for under USD 99 in volume deals, eliminating the USD 150-200 truck-roll fee that previously hindered rural activations. The cheaper hardware reflects chipset consolidation and global volume scaling, which has surpassed 100 million subscribers. Lower upfront expenses bolster operator margins, trim payback periods, and enable prepaid models that resonate with budget-sensitive households.
Federal and State BEAD Subsidies Favoring FWA in Rural Broadband
The NTIA allocated USD 42.5 billion under the BEAD program, with 19 states formally endorsing FWA alongside fiber in their 2024 proposals. Texas leads with USD 3.3 billion, earmarking roughly 400,000 rural premises where fiber exceeds USD 5,000 per passing. Scoring hinges on speed, latency, and reliability, not technology. Modern mid-band FWA easily meets the 25/3 Mbps and sub-100 ms latency thresholds, positioning operators to capture contracts in sparsely populated counties. The funding terms thereby expand the Fixed Wireless Access market beyond suburban fill-in to deep-rural greenfield territories.
Restraints Impact Analysis*
| Restraint | (~) % Impact on CAGR Forecast | Geographic Relevance | Impact Timeline |
|---|---|---|---|
| Urban spectrum congestion in NFL city cores | -2.3% | United States, major metropolitan areas | Medium term (2-4 years) |
| Utility-pole access disputes slowing outdoor CPE deployment | -1.8% | North America, suburban/rural deployment zones | Short term (≤ 2 years) |
| Cable DOCSIS 4.0 price wars compressing FWA ARPU | -2.1% | United States and Canada, cable-served territories | Medium term (2-4 years) |
| Weather-linked mmWave service degradation in northern states | -1.4% | Northern United States and Canada | Long term (≥ 4 years) |
| Source: Mordor Intelligence | |||
Urban Spectrum Congestion in NFL City Cores
Game-day traffic in stadium districts reduces FWA throughput by as much as 60%, leading carriers to prioritize mobile experience over home-internet flows. Markets such as Dallas, Chicago, and Los Angeles illustrate the ceiling on penetration rates once sector load passes 15-20 concurrent households. Operators are layering small cells and deploying dynamic spectrum sharing, yet both tactics increase capital intensity and dampen margin upside. Consequently, dense urban pockets may cap the addressable Fixed Wireless Access market earlier than suburban or rural locales.
Cable DOCSIS 4.0 Price Wars Compressing FWA ARPU
Comcast’s 2 Gbps DOCSIS 4.0 tier undercuts analogous FWA service by 20-30% in many suburbs, pressuring wireless carriers to bundle mobile or streaming perks to maintain parity. Charter’s accelerated rollout to 15 million homes by late 2024 intensifies the squeeze, particularly where cable enjoys right-of-way incumbency. Fixed Wireless Access market entrants must therefore adopt creative pricing and service-tier strategies to cushion ARPU erosion while scaling subscriber counts.
*Our forecasts treat driver/restraint impacts as directional, not additive. The impact forecasts reflect baseline growth, mix effects, and variable interactions.
Segment Analysis
By Type: Services Secure a Durable Lead
The services slice dominated 2024 revenue at 70.54%, reflecting a clear operator preference for subscription cash flows over one-off hardware sales. At an 18.83% CAGR, services will contribute the largest absolute dollar value to the Fixed Wireless Access market size through 2030. Enterprise customers value SLA-backed tiers that guarantee bandwidth, latency, and jitter, whereas residential users tend to gravitate toward straightforward, “set-and-forget” monthly plans. Hardware, encompassing CPE and access units, is forecast to grow; however, it will represent a shrinking revenue fraction as semiconductor deflation reduces average selling prices and vendors shift to managed-service attachment models. Nokia’s network slicing supports differentiated quality of service levels that operators monetize through premium tiers, a tactic likely to expand the Fixed Wireless Access market share for services in the coming years.
Hardware’s 29.46% share in 2024 will continue to erode as self-install kits mature and value shifts to cloud-based orchestration platforms. Operators capitalize on OpEx-light deployments by amortizing radio access and transport investments across a larger subscriber base, reinforcing the ascendancy of service-led monetization. Nonetheless, the hardware channel retains importance for specialized deployments such as private industrial networks where bespoke antenna arrays remain critical.


By Application: Commercial Uptake Accelerates
Residential accounted for 67.31% of 2024 revenue, a legacy of FWA’s early positioning as a cable alternative for households. The Fixed Wireless Access market size for commercial deployments is forecast to climb at a 25.02% CAGR, narrowing the gap by 2030 as enterprises embrace rapid-turnup connectivity for pop-up stores, construction sites, and branch offices. Verizon Business reports that commercial ARPU averages 3-5 times the level of residential ARPU, providing a material lift to blended revenue.
Demand drivers include branch resiliency mandates, IoT sensor backhaul, and the need for short-term connectivity during building renovations. Tightened cybersecurity frameworks also spur interest in isolated FWA links that bypass shared building LANs. As these use cases proliferate, the commercial cohort is expected to deliver an outsized contribution to the Fixed Wireless Access market share by the end of the decade.
By Frequency Band: Sub-6 GHz Dominates, mmWave Finds Niches
With 80.39% of 2024 revenue, sub-6 GHz remains the workhorse thanks to its forgiving propagation and economical cell-site spacing. The Fixed Wireless Access market size associated with mmWave is expected to expand rapidly, with a 26.47% CAGR, as operators deploy outdoor CPE and steer beams to maintain gigabit links. AT&T focuses its mmWave rollouts on high-rise apartments where line-of-sight is manageable and capacity demand acute.
Sub-6 GHz enjoys streamlined regulatory treatment and leverages existing macro grids, while mmWave excels in dense user clusters craving high instantaneous throughput. Vendors continue to refine adaptive beamforming and envelope-tracking power amplifiers, which lift mmWave link budgets by 5-6 dB, extending viable coverage by a further block or two.
By Deployment Mode: Outdoor CPE Momentum Builds
Indoor gateways still held 70.93% of 2024 spend, yet outdoor units are on a 23.26% CAGR clip to 2030 as operators chase higher signal-to-noise ratios at cell edges. Outdoor installations raise antenna height, dodge interior wall attenuation, and can bump spectral efficiency by 2-3×, expanding the Fixed Wireless Access market share for this mode over the forecast horizon. Self-mount brackets and integrated eSIM activation flows reduce homeowner friction, helping outdoor CPE surpass a 35% penetration rate among new additions by 2027.
Extreme climates have historically slowed outdoor adoption; ruggedized enclosures now tolerate temperatures ranging from –40 °C to +65 °C and support rapid thermal dissipation. Policy reforms mandating 60-day utility-pole attachment responses further accelerate neighborhood rollouts, lowering the cost-per-passing and improving payback math.
Geography Analysis
The United States generated 85.93% of the 2024 regional revenue, driven by mid-band spectrum depth, aggressive carrier promotions, and the USD 42.5 billion BEAD funding tranche, which enhances rural economies. Verizon, T-Mobile, and AT&T together served more than 5 million subscribers by year-end 2024, with suburban rings around secondary metros showing the fastest net-add momentum. The C-band harvest delivered contiguous 80 MHz blocks in many Partial Economic Areas, enabling operators to consistently achieve 100 Mbps downlink metrics necessary for BEAD eligibility.
Canada presents a mature yet slower-moving opportunity. Rogers, Bell, and Telus concentrate on remote communities, lake-region cottages, and oil-patch camps where terrestrial broadband remains uneconomic. The federal CAD 1.75 billion Universal Broadband Fund covers part of the backhaul, although policymakers still prioritize fiber when population density warrants it. Weather-related mmWave fade margins push operators toward sub-6 GHz solutions and indoor CPE that tolerates winter lows of –30 °C.
Mexico is the breakout growth engine, projected at a 34.40% CAGR through 2030. América Móvil’s Telcel introduced mid-band FWA in 15 states during 2024, focusing on suburban middle-class households and small offices that lack fiber. Recent spectrum liberalization in 2.5 GHz and 3.5 GHz bands grants ample headroom for nationwide expansion. The Instituto Federal de Telecomunicaciones stipulates a 25 Mbps minimum downstream, which the current mid-band footprint comfortably clears. Intensifying foreign investment and tower-sharing arrangements should help Mexico lift its share of the regional Fixed Wireless Access market revenue from below 10% in 2024 to roughly 18% by 2030.
Analysis of the fixed wireless access market by Mordor Intelligence spans multiple other regional evaluations across South America, Africa, and Asia, supported by country-level insights for France and Germany, wherein local market conditions keep varying from one country to another.
Competitive Landscape
North American FWA exhibits moderate concentration, with Verizon, T-Mobile, and AT&T claiming about 60% of total subscribers in 2024. Their spectrum depth and existing macro grids provide cost advantages that hinder new entrants, yet regional players such as UScellular and a constellation of fixed-wireless ISPs leverage targeted deployments to carve out defensible niches. Cable incumbents deploy DOCSIS 4.0 to counter churn but face customer fatigue over annual price escalators, opening a window for FWA substitution.
Technology suppliers, such as Nokia, Ericsson, Samsung, and upstart Tarana Wireless, intensify rivalry by bundling hardware, orchestration software, and managed services. Tarana’s non-line-of-sight platform has earned contracts with more than 200 WISPs, serving valleys and forested terrain beyond the reach of standard LTE. Patent activity around beamforming and AI-driven interference cancellation increased by 40% year-over-year in 2024, suggesting further performance gains that could narrow the cost advantage long held by cable.
Strategic moves include Verizon’s spectrum-sharing partnership with satellite players to extend C-band reach into fringe areas, T-Mobile’s bundling of home internet with Magenta MAX mobile to increase customer lifetime value, and AT&T’s selective pursuit of high-margin enterprise corridors, coupled with a hybrid fiber/FWA fallback. Collectively, these plays suggest a race to differentiate on QoS, bundle economics, and geographic precision rather than raw price alone.
North America Fixed Wireless Access Industry Leaders
Verizon Communications Inc.
T-Mobile US, Inc.
AT&T Inc.
Rogers Communications Inc.
TELUS Corporation
- *Disclaimer: Major Players sorted in no particular order

Recent Industry Developments
- June 2025: AT&T passed more than 30 million consumer and business locations with fiber, reinforcing a selective deployment strategy that balances Fixed Wireless Access market offers with profitable fiber zones.
- February 2025: UScellular partnered with Samsung to deploy FWA across 400,000 rural locations, utilizing mmWave and mid-band spectrum, targeting underserved markets with fiber costs exceeding USD 5,000 per premise.


North America Fixed Wireless Access Market Report Scope
| Hardware | Consumer Premise Equipment (CPE) |
| Access Units (Femto and Picocells) | |
| Services |
| Residential |
| Commercial |
| Industrial |
| Sub-6 GHz |
| mmWave (> 24 GHz) |
| Indoor CPE |
| Outdoor CPE |
| United States |
| Canada |
| Mexico |
| By Type | Hardware | Consumer Premise Equipment (CPE) |
| Access Units (Femto and Picocells) | ||
| Services | ||
| By Application | Residential | |
| Commercial | ||
| Industrial | ||
| By Frequency Band | Sub-6 GHz | |
| mmWave (> 24 GHz) | ||
| By Deployment Mode | Indoor CPE | |
| Outdoor CPE | ||
| By Country | United States | |
| Canada | ||
| Mexico |


Key Questions Answered in the Report
How large is the North America Fixed Wireless Access market in 2025?
The market is valued at USD 33.51 billion in 2025 and is projected to expand to USD 73.95 billion by 2030.
What growth rate is forecast for Fixed Wireless Access through 2030?
Regional revenue is expected to rise at a 17.15% CAGR over the 2025-2030 period.
Which segment contributes most to revenue today?
Services contribute 70.54% of 2024 revenue, owing to operators’ focus on recurring subscription models.
Which application is growing fastest?
Commercial deployments are advancing at a 25.02% CAGR as enterprises seek rapid-deployment connectivity and backup links.
What country is showing the fastest market growth?
Mexico leads with a 34.40% CAGR forecast through 2030 due to infrastructure modernization and regulatory liberalization.
How concentrated is the competitive landscape?
Verizon, T-Mobile, and AT&T together control roughly 60% of subscribers, indicating moderate concentration.
Page last updated on:


