North America Mobile Broadband Market Size and Share
Market Overview
| Study Period | 2019 - 2030 |
|---|---|
| Forecast Data Period | 2025 - 2030 |
| Historical Data Period | 2019 - 2023 |
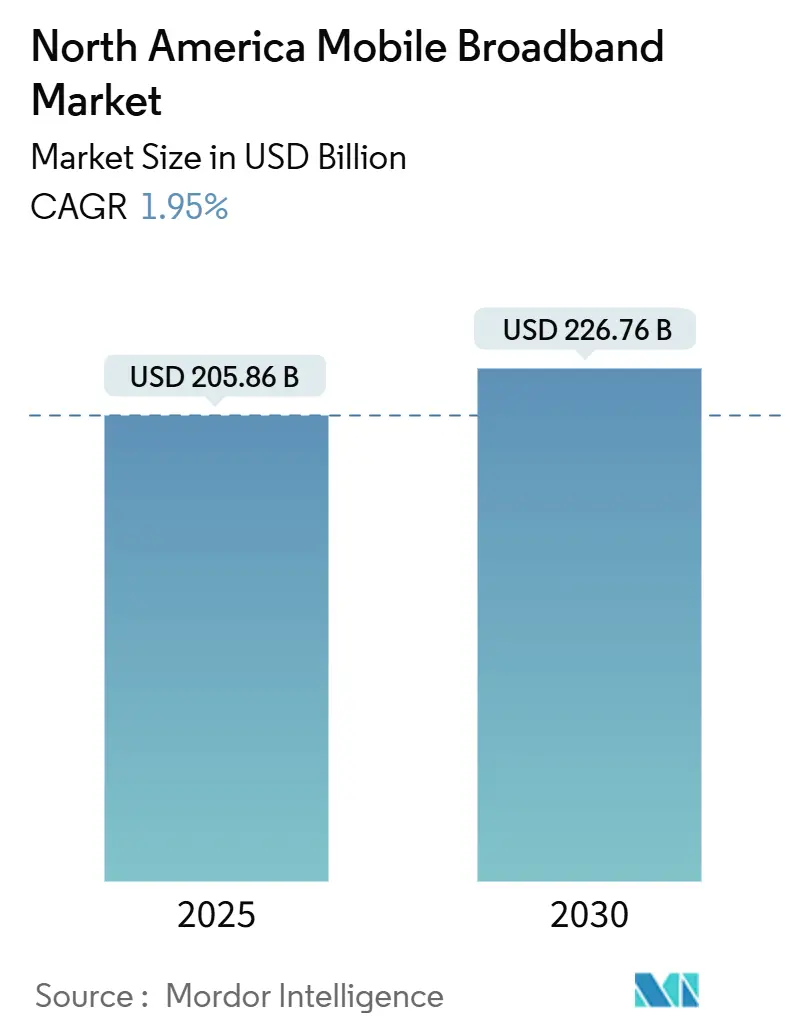
| Market Size (2025) | USD 205.86 Billion |
| Market Size (2030) | USD 226.76 Billion |
| Growth Rate (2025 - 2030) | 1.95% CAGR |
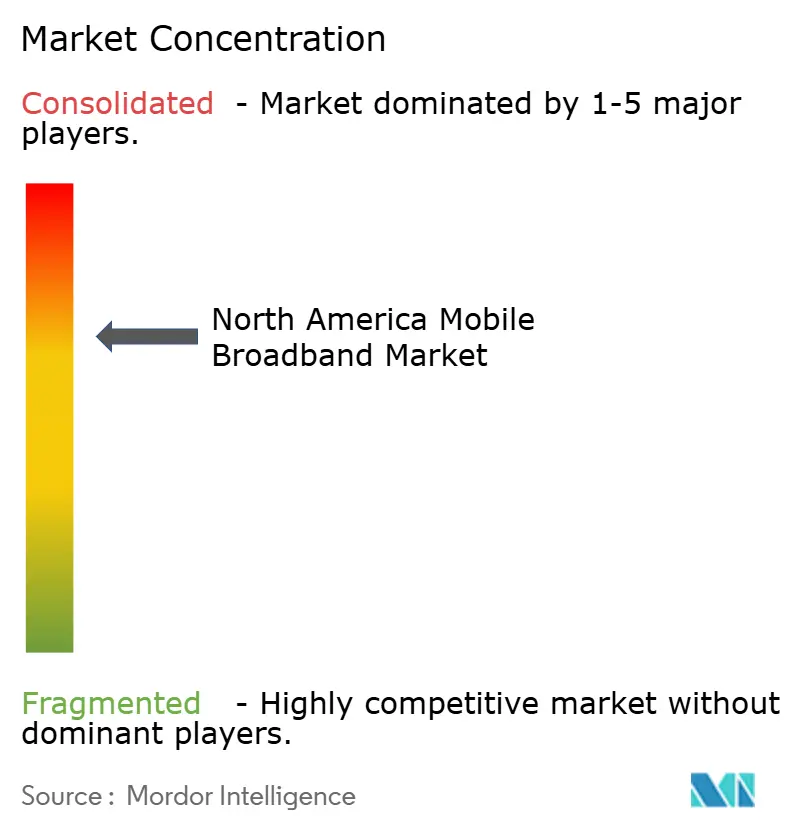
| Market Concentration | Medium |
Major Players *Disclaimer: Major Players sorted in no particular order Image © Mordor Intelligence. Reuse requires attribution under CC BY 4.0. | |
North America Mobile Broadband Market Analysis by Mordor Intelligence
The North America Mobile Broadband Market size is estimated at USD 205.86 billion in 2025, and is expected to reach USD 226.76 billion by 2030, at a CAGR of 1.95% during the forecast period (2025-2030). Steady topline growth masks a structural shift from coverage-focused 4G spending to capacity-intensive 5G rollouts, drawing capital into mid-band spectrum, edge-cloud integration, and AI-based radio optimization. Operators are increasingly treating spectrum as a scarce asset whose productivity must expand as data traffic rises faster than revenue. The convergence of fixed-wireless access with the mobile core blurs service boundaries, while government subsidies for rural build-outs alter traditional return-on-investment calculations. Competitive intensity rises as cable MVNOs, cloud-native greenfield entrants, and rural specialists pursue share through price-performance plays, pushing incumbents toward differentiated quality of service, enterprise network slicing, and bundled content strategies.
Key Report Takeaways
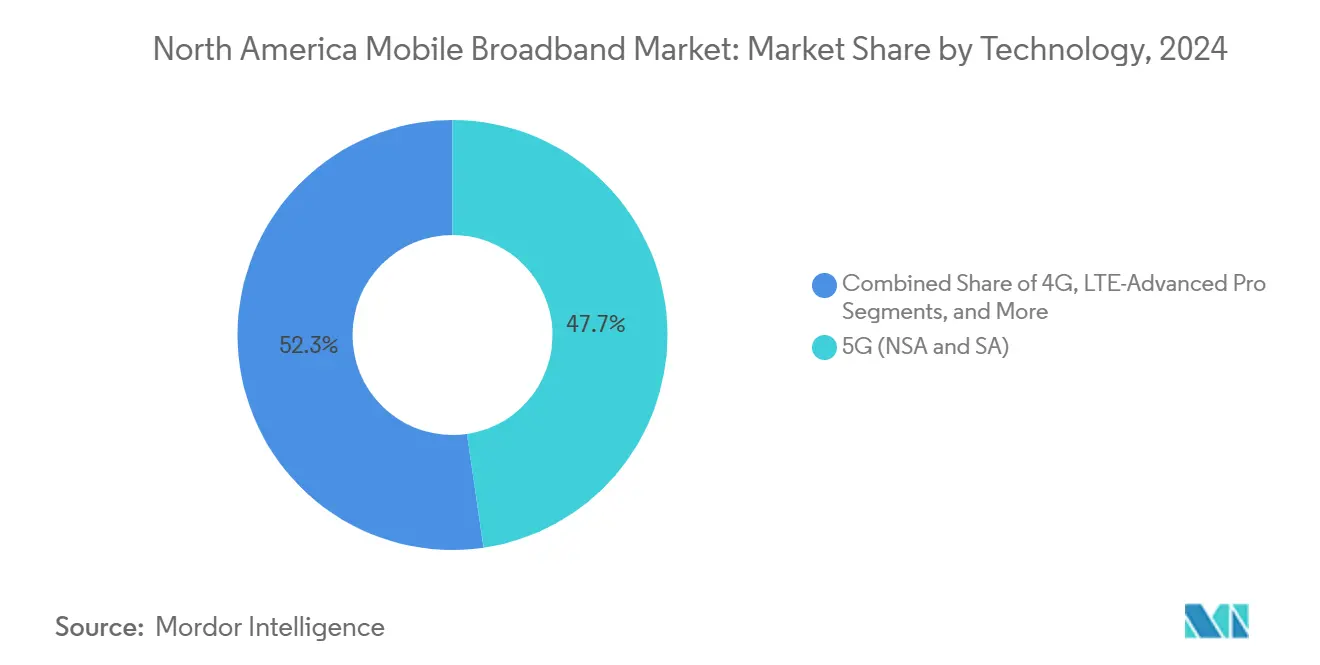
- By technology, 5G NSA/SA commanded 47.69% of the North America mobile broadband market share in 2024 and is advancing at a 4.17% CAGR through 2030.
- By service type, mobile data plans held 72.51% share of the North America mobile broadband market size in 2024, while recording a 2.30% CAGR to 2030.
- By end-user, the consumer segment accounted for 70.18% of the North America mobile broadband market size in 2024, whereas the enterprise segment is set to grow at a 2.15% CAGR through 2030.
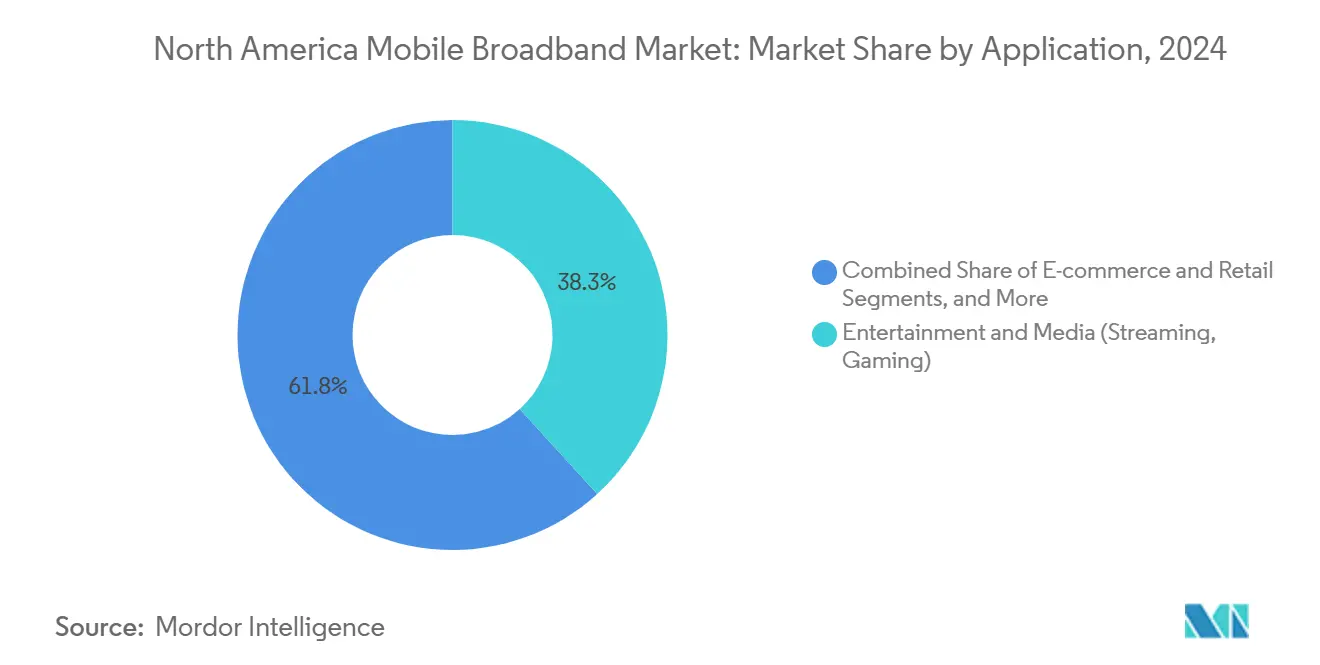
- By application, entertainment and media led with 38.25% North America mobile broadband market share in 2024; e-commerce and retail post the fastest 3.81% CAGR to 2030.
- By spectrum band, mid-band (1–6 GHz) captured 56.97% of the North America mobile broadband market share in 2024 and is forecast to expand at a 3.76% CAGR through 2030.
- By country, the United States held an 85.24% share of the North America mobile broadband market size in 2024, though its 2.09% CAGR trails the continental average to 2030.
Worldwide, activity is shaped by contributions from multiple regions, with North america representing one of the more structurally developed among them. The global report on mobile broadband market by Mordor Intelligence reflects how these regional layers combine into a single system.
North America Mobile Broadband Market Trends and Insights
Drivers Impact Analysis
| Driver | (~) % Impact on CAGR Forecast | Geographic Relevance | Impact Timeline |
|---|---|---|---|
| Intensifying mid-band 5G roll-outs by Tier-1 carriers | +0.8% | United States, Canada core metros | Medium term (2-4 years) |
| Convergence of fixed-wireless access (FWA) with mobile core | +0.6% | Rural US, Western Canada | Long term (≥ 4 years) |
| Spectrum repurposing incentives under FCC’s C-band re-auction | +0.4% | United States nationwide | Short term (≤ 2 years) |
| Edge-native consumer AR/VR content partnerships | +0.3% | Major metropolitan areas | Long term (≥ 4 years) |
| Federal Broadband Equity, Access, and Deployment (BEAD) grants tilting rural economics | +0.5% | Rural United States | Medium term (2-4 years) |
| AI-driven RAN optimisation lowering per-GB cost curves | +0.7% | North America wide | Medium term (2-4 years) |
| Source: Mordor Intelligence | |||
Intensifying Mid-Band 5G Roll-Outs by Tier-1 Carriers
Mid-band spectrum commands operator attention because it balances propagation and capacity, letting carriers extend 5G farther than mmWave without sacrificing throughput. Verizon spent USD 45.4 billion on C-band licenses, while AT&T layered 3.45 GHz licenses on top of its earlier holdings in the 3.7-4.2 GHz range to fill urban gaps [1]Verizon Communications, “C-Band Deployment Progress,” verizon.com. T-Mobile continues to leverage the 2.5 GHz spectrum it acquired from the Sprint merger, forcing rivals into rapid build schedules that compress asset amortization. Network differentiation now hinges on spectral depth and software-defined radios capable of 100 MHz-wide channels. As coverage density increases, subscriber churn correlates more closely with median download speeds, reinforcing the investment loop between spectrum depth and customer lifetime value.
Convergence of Fixed-Wireless Access with Mobile Core
FWA leverages existing macro and small-cell footprints to reach homes at one-third the cost of fiber, letting carriers harvest incremental revenue from idle spectrum blocks during off-peak mobility hours. Rural economics benefit most, as a single radio plant now addresses both mobility and residential demand, reducing payback periods that were previously prohibitive for fiber trenching. Dynamic spectrum sharing allocates capacity between fixed and mobile sessions in real time, squeezing more bits per invested megahertz. Regulatory frameworks lag behind the technical reality, and future classifications may need to merge telecom and cable rules, spurring new compliance costs while also clarifying franchising obligations.
Spectrum Repurposing Incentives Under FCC C-Band Re-Auction
The C-band clearing program raised USD 81 billion and paid satellite incumbents USD 9.7 billion to vacate early, shrinking relocation timelines from seven years to two. The success illustrates a template for 3.1-3.55 GHz, now under federal review, and could trigger further mid-band releases critical to the North America mobile broadband market. Elevated spectrum prices strain carrier balance sheets, nudging them toward network-sharing and tower-leasing models to preserve free cash flow. Secondary-market entrants face higher hurdle rates, potentially consolidating ownership of prime frequencies among the top three national carriers.
AI-Driven RAN Optimization Lowering Per-GB Cost Curves
Self-organizing network suites such as Nokia’s MantaRay analyze cell-site KPIs, adjust tilt, power, and channel width, and trigger predictive maintenance tickets before alarms occur [2]Nokia, “MantaRay SON Platform,” nokia.com. Carriers adopting AI cut operational expense per gigabyte by up to 40%, offsetting stagnant ARPU and funding further 5G densification. Automated energy-saving modes trim site consumption by 15%, aiding sustainability targets that are increasingly tied to lending terms. The same analytics surface spectrum usage anomalies, guiding refarming decisions from 3G sunset to future mmWave overlay strategies.
Restraints Impact Analysis
| Restraint | (~) % Impact on CAGR Forecast | Geographic Relevance | Impact Timeline |
|---|---|---|---|
| Tier-2/3 operator cap-ex squeeze amid high spectrum debt | -0.3% | Regional US, smaller Canadian operators | Short term (≤ 2 years) |
| Local-authority moratoria on small-cell permits in dense metros | -0.2% | Major metropolitan areas | Medium term (2-4 years) |
| Stagnant average-revenue-per-user (ARPU) despite traffic boom | -0.4% | North America wide | Long term (≥ 4 years) |
| Supply-chain bottlenecks for 5G mmWave RF-front-end modules | -0.3% | United States, urban Canada | Short term (≤ 2 years) |
| Source: Mordor Intelligence | |||
Stagnant Average-Revenue-Per-User Despite Traffic Boom
US wireless ARPU slipped 2.1% in 2024 even as data usage expanded 40%, underscoring the widening gap between revenue and traffic [3]CTIA, “ARPU Trends in U.S. Wireless,” ctia.org. Unlimited plans reset customer expectations around price ceilings, limiting the ability to monetize incremental gigabytes. As 5G standalone enables network slicing, operators aim to restore pricing power through service-tier stratification; however, enterprise demand alone cannot fully offset consumer margin erosion. The longer revenue lags, the harder it becomes to justify fresh spectrum auctions at past valuations, tempering long-term investment appetites.
Supply-Chain Bottlenecks for 5G mmWave RF-Front-End Modules
Lead times for gallium-based power amplifiers extend beyond a year because compound semiconductor fabs cannot scale quickly, which impedes dense-urban small-cell schedules. Operators therefore prioritize elite venues, such as stadiums, financial districts, and transit hubs, when allocating scarce hardware, leaving secondary metros to await capacity relief. Vendor diversification helps, but multi-sourcing exotic chipsets proves difficult amid strict RF calibration requirements. Interim mitigations include advanced antenna arrays and carrier aggregation with mid-band layers, yet neither delivers the multi-gigabit benchmarks mmWave advertises, eroding early-marketing narratives.
Segment Analysis
By Technology: 5G Drives Infrastructure Transformation
5G NSA/SA accounted for 47.69% of the North America mobile broadband market in 2024 and posts the fastest 4.17% CAGR through 2030 as carriers shift cap-ex toward cloud-native cores and massive MIMO radios. LTE-Advanced Pro sustains a transitional 4G layer that helps offload legacy devices, but its share erodes annually as handset refresh cycles accelerate. Standalone 5G unlocks network slicing, ultra-low-latency modes, and integrated edge computing, allowing operators to craft new enterprise offers that command premium service fees. The North America mobile broadband market size for 5G services is forecast to surpass 60% of total revenue by 2030, buoyed by industrial IoT, private networks, and immersive media. Vendor landscapes are tightening as integrated hardware-software stacks gain favor, rewarding OEMs that deliver backward-compatible baseband and remote upgrade paths.
Multi-generation coexistence raises operational complexity, prompting carriers to adopt orchestration tools that automate traffic steering across 4G and 5G layers. Such agility maintains high average spectral efficiency even when subscriber mixes remain heterogeneous. Component suppliers refine envelope-tracking power amplifiers to support wider 5G channels without increasing handset battery draw, sustaining the device refresh cadence critical to volume economics. Edge-cloud alignment with carrier data centers reduces latency below 20 ms for gaming and AR, a threshold deemed essential for premium consumer experiences. These technology dynamics collectively reinforce the central role of 5G in the North America mobile broadband market.


By Service Type: Data Plans Maintain Dominance
Mobile data plans retained a 72.51% share in 2024 and are expected to grow at a 2.30% CAGR to 2030, reflecting saturation yet ongoing volume gains from device proliferation. Bundled voice-over-LTE has lost standalone visibility, morphing into an application riding the data layer, which simplifies tariff structures. Hotspot and tethering allowances rise as hybrid work lifestyles persist, encouraging operators to upsell higher-tier unlimited plans. The North America mobile broadband market size, attributed to corporate pooled data contracts, accelerates as enterprises subsidize remote-employee connectivity, particularly where fiber remains unavailable.
Service differentiation migrates from allowance buckets to performance promises, including priority queuing, zero-rating of internal enterprise traffic, and security overlays. Usage analytics integrated into self-care apps enable subscribers to monitor quality of service in real-time, fostering transparency that reduces churn. Operators deploy content partnership bundles, especially in streaming and gaming, to anchor high-end tiers. The resulting revenue mix shifts toward ancillary services, such as device insurance, cloud storage, and identity protection, raising the average account value even as base data pricing stagnates. This nuanced evolution preserves data-plan dominance within the North America mobile broadband market.
By End-User: Enterprise Growth Outpaces Consumer
Consumers still generate 70.18% of revenue, yet the enterprise slice grows faster at 2.15% because organizations value reliability and security over raw price. Industrial firms adopt private 5G to modernize their automation, while healthcare providers require HIPAA-compliant connectivity for telehealth services. The North America mobile broadband market share commanded by enterprises will inch upward as edge computing matures, allowing carriers to host mission-critical workloads within metro data centers. Service-level agreements guarantee sub-50-ms round-trip latency and 99.99% availability, thresholds consumers neither demand nor pay for.
Platform plays such as Verizon ThingSpace bundle connectivity with device management, analytics, and API access, expanding revenue per connection several-fold versus plain SIM cards. Carriers partner with hyperscalers to integrate network slices with cloud instances, easing application deployment for corporate developers. This bundling also blunts hyperscaler ambitions to bypass telcos through over-the-top networking. Although consumer ARPU plateaus, family plan volume continues to safeguard the baseline cash flow. The complementary growth profiles create a resilient portfolio that stabilizes overall earnings in the North America mobile broadband market.
By Application: E-Commerce Disrupts Entertainment Dominance
Entertainment and media captured 38.25% of 2024 usage, but its share inches downward as subscription fatigue mounts and customers rotate among streaming catalogs. E-commerce and retail traffic, however, grows 3.81% annually, reflecting a migration toward mobile checkout, live shopping, and augmented-reality product visualization. Financial services apps piggyback on this shift, with peer-to-peer payments being embedded into retail experiences. The North America mobile broadband market size allocated to data-rich commercial transactions rises as merchandisers optimize images and streaming demos that increase conversion rates.
Healthcare and education usage spikes during seasonal outbreaks and exam cycles, respectively, demanding predictable bandwidth that pushes operators to hold additional mid-band capacity reserves. Social-media engagement stabilizes in absolute terms but shifts toward richer formats, such as short-form video and immersive filters, that increase the number of bytes per session. Operators therefore invest in adaptive bitrate caching at the edge to contain backhaul costs. Application diversity affords revenue hedging, ensuring that no single use case dictates capacity-planning assumptions within the North America mobile broadband market.
By Spectrum Band: Mid-Band Optimization Intensifies
Mid-band frequencies held a 56.97% share in 2024 and grew 3.76% through 2030 as they offer the sweet spot between coverage and multi-100-Mbps throughput. Sub-1 GHz remains crucial for rural reach and deep indoor penetration, but its finite bandwidth caps capacity, relegating it to control-plane and voice duties. mmWave and future terahertz open gigabit lanes but demand hyper-dense small-cell grids whose economics work only in downtown cores. The North America mobile broadband market size, attributed to mid-band services, is expected to surpass USD 150 billion by 2030 as operators refine carrier aggregation of 100-MHz blocks.
Qualcomm’s X65 modem aggregates licensed and unlicensed spectrum, enabling devices to reach a 10 Gbps peak while alleviating concerns about spectral scarcity. Radio vendors deliver tri-band remote units that reduce tower rent by co-locating low-, mid-, and high-band radios in a single enclosure, thereby aiding deployment velocity. Regulators continue hunting underutilized mid-band allocations in government hands, encouraged by the C-band auction’s fiscal windfall. Policy predictability underpins investor confidence in the North America mobile broadband market, ensuring capital remains available for future releases.
Geography Analysis
The United States represented 85.24% of the North America mobile broadband market in 2024 and grew at a below-average 2.09% CAGR, as urban saturation tempered subscriber additions. Federal BEAD funding of USD 42.45 billion subsidizes rural build-outs, increasing the number of addressable households by 10 million and imposing open-access conditions that may reshape roaming economics. Carriers are redirecting a rising share of capital toward densifying C-band coverage in top-100 metros, where median speeds drive competitive positioning.
Canada exhibits oligopolistic traits, with Rogers, Bell, and Telus balancing competitive offers against the high cost of covering sparsely populated terrain. The Rogers–Shaw merger, valued at USD 26 billion, consolidates spectrum and fiber assets, promising nationwide 5G yet raising regulatory demands for regional-carrier support. Government auction structures favor contiguous mid-band blocks, helping incumbents deliver contiguous 100 MHz channels that meet ITU 5G performance standards. Despite premium pricing, churn remains low because coverage in remote provinces still differentiates carrier propositions.
Mexico’s accelerating economic expansion drives smartphone penetration beyond 75%. América Móvil allocates the bulk of its USD 7 billion 2024 cap-ex to 5G, targeting dense corridors that link industrial parks and urban centers. Competitor Telefónica leans on roaming agreements to fill coverage gaps, preserving cash for selective C-band licenses. Regulatory reforms mandating wholesale rates on Telcel’s towers and spectrum align with pro-competition goals, gradually narrowing service-quality disparities. Cross-border carriers benefit from compatible band plans, which lower device costs and smooth tourist roaming, collectively sustaining growth in the North America mobile broadband market.
Mordor Intelligence provides coverage of the mobile broadband market across other key regional markets, including Middle East, South America, and Africa, each with their regulatory frameworks and demand patterns.
Competitive Landscape
Tier-1 incumbents, Verizon, AT&T, and T-Mobile, control over two-thirds of mobile lines, yet market concentration is easing as cable MVNOs, greenfield cloud-native players, and private-network specialists nibble at the edges. Comcast’s Xfinity Mobile and Charter’s Spectrum Mobile utilize existing Wi-Fi grids for offload, reducing variable network costs by 35% and offering unlimited plans at a discount to attract broadband bundles. Dish pursues a nationwide Open-RAN build on AWS infrastructure, striving for opex savings but facing execution risk amid supply-chain delays.
Spectrum ownership largely defines strategic latitude. Verizon’s C-band depth underpins its premium positioning, while T-Mobile leverages 2.5 GHz for broad mid-band coverage, forcing AT&T to use carrier aggregation until its 3.45 GHz network is scaled. Rural carriers form spectrum-sharing collectives to pool sub-6 GHz holdings, negotiating favorable roaming rates that widen retail options in underserved counties. AT&T integrates its 5G edge with Microsoft Azure, and Verizon extends Mobile Edge Compute zones with AWS Wavelength, each seeking differentiated latency guarantees for enterprise customers.
Network automation emerges as the next battleground. Operators deploying AI-powered self-organizing networks reduce troubleshooting time by 50%, resulting in higher customer-experience scores that correlate with lower churn rates. Cable MVNOs counter with aggressive pricing, wagering that converged billing and home-gateway control trump raw speed. The resulting dynamics keep pricing rational nationally, but localized promotions intensify as carriers chase market share, sustaining a healthy rivalry in the North America mobile broadband market.
North America Mobile Broadband Industry Leaders
Verizon Communications Inc.
AT&T Inc.
T-Mobile US Inc.
Rogers Communications Inc.
Telus Corporation
- *Disclaimer: Major Players sorted in no particular order

Recent Industry Developments
- October 2025: AT&T activated a nationwide 5G standalone core, enabling network slicing for enterprise users and reduced latency for consumers.
- July 2025: T-Mobile committed USD 3 billion to expand rural 5G coverage to 30 million additional Americans, aligning with BEAD funding objectives.
- October 2024: América Móvil earmarked a significant share of its USD 7 billion 2024 cap-ex to accelerate multi-market 5G deployment.


North America Mobile Broadband Market Report Scope
| 4G |
| 5G (NSA and SA) |
| LTE-Advanced Pro |
| Wi-Fi |
| Other Technologies (NB-IoT, LoRaWAN, etc.) |
| Mobile Data Plans |
| Voice-over-LTE (VoLTE) |
| Mobile Hotspot / Tethering |
| Consumers |
| Businesses/Enterprises |
| Entertainment and Media (Streaming, Gaming) |
| E-commerce and Retail |
| Social Media and Communication |
| Healthcare and Education |
| Other Applications |
| Sub-1 GHz (Coverage bands) |
| 1–6 GHz (Mid-band) |
| >6 GHz mmWave and Terahertz |
| United States |
| Canada |
| Mexico |
| By Technology | 4G |
| 5G (NSA and SA) | |
| LTE-Advanced Pro | |
| Wi-Fi | |
| Other Technologies (NB-IoT, LoRaWAN, etc.) | |
| By Service Type | Mobile Data Plans |
| Voice-over-LTE (VoLTE) | |
| Mobile Hotspot / Tethering | |
| By End-User | Consumers |
| Businesses/Enterprises | |
| By Application | Entertainment and Media (Streaming, Gaming) |
| E-commerce and Retail | |
| Social Media and Communication | |
| Healthcare and Education | |
| Other Applications | |
| By Spectrum Band | Sub-1 GHz (Coverage bands) |
| 1–6 GHz (Mid-band) | |
| >6 GHz mmWave and Terahertz | |
| By Country | United States |
| Canada | |
| Mexico |


Key Questions Answered in the Report
How large is the North America mobile broadband market in 2025?
The market reaches USD 205.86 billion in 2025 with a projected 1.95% CAGR to 2030.
Which spectrum band currently dominates in North America?
Mid-band frequencies between 1 GHz and 6 GHz hold 56.97% share thanks to their blend of coverage and capacity.
What technology segment is growing the fastest?
5G NSA/SA grows at a 4.17% CAGR, driven by standalone core deployments and network slicing demand.
Why are enterprise customers increasingly important?
Enterprises pay premiums for guaranteed latency and security, pushing segment growth above consumer rates at 2.15% CAGR.
How are operators addressing rural coverage gaps?
They combine federal BEAD subsidies with fixed-wireless access architectures to reach low-density areas at lower cost.
Which companies pose the biggest competitive threat to Tier-1 carriers?
Cable MVNOs like Comcast Xfinity Mobile and Charter Spectrum Mobile leverage Wi-Fi offload and bundled pricing to undercut incumbents.
Page last updated on:


