Asia-Pacific Fixed Wireless Access Market Size and Share
Market Overview
| Study Period | 2019 - 2030 |
|---|---|
| Forecast Data Period | 2025 - 2030 |
| Historical Data Period | 2019 - 2023 |
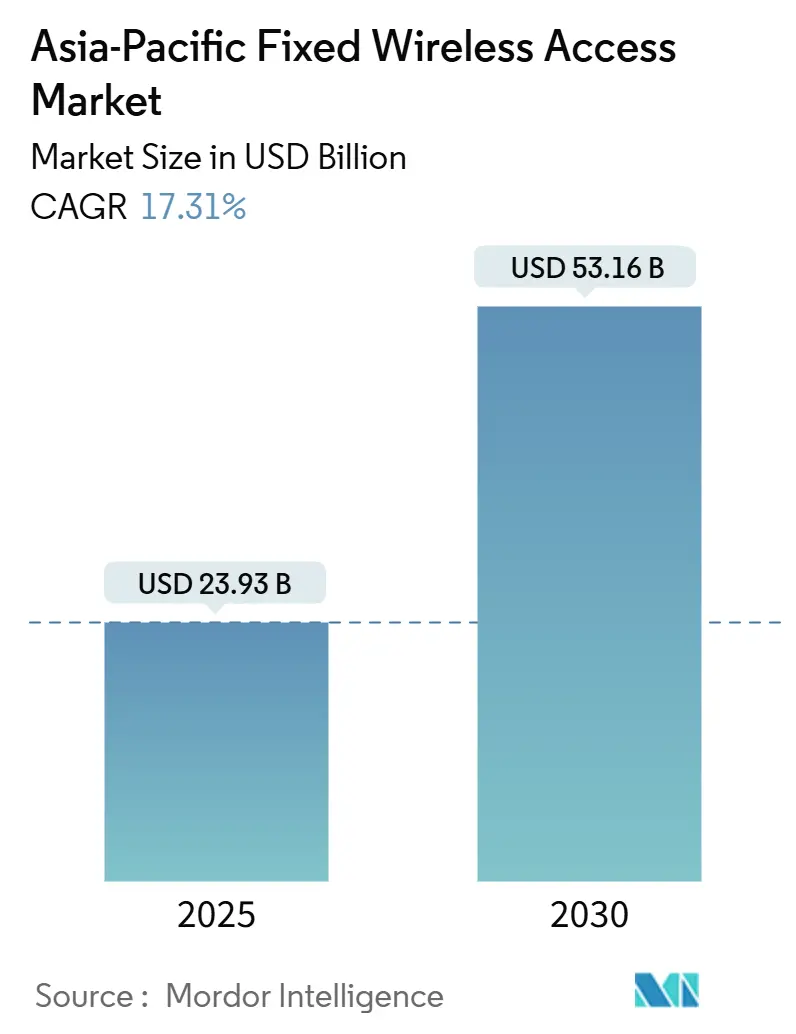
| Market Size (2025) | USD 23.93 Billion |
| Market Size (2030) | USD 53.16 Billion |
| Growth Rate (2025 - 2030) | 17.31% CAGR |
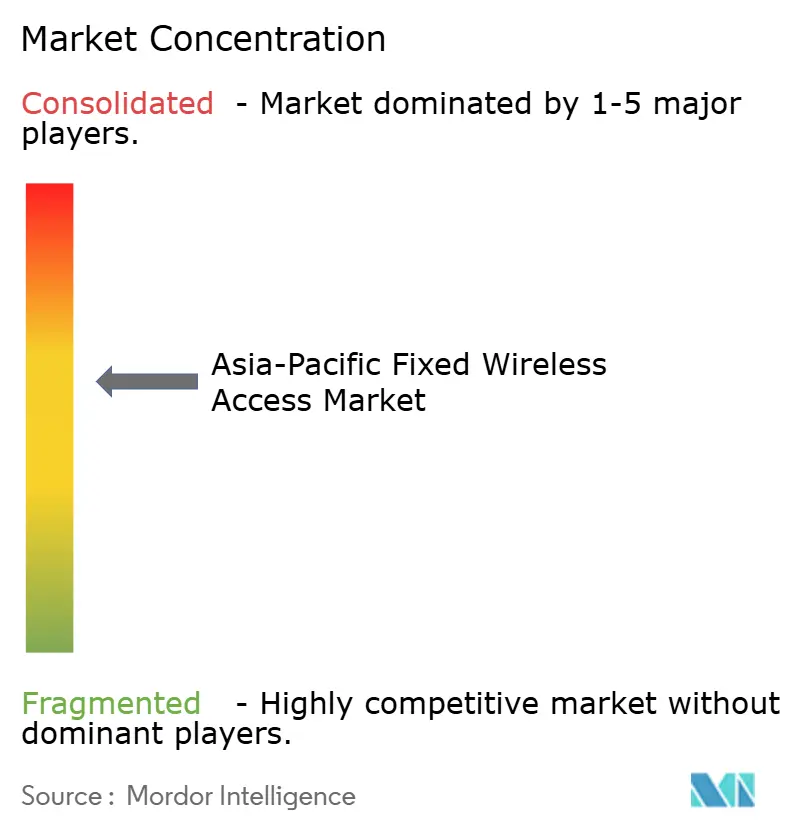
| Market Concentration | Medium |
Major Players *Disclaimer: Major Players sorted in no particular order Image © Mordor Intelligence. Reuse requires attribution under CC BY 4.0. | |
Asia-Pacific Fixed Wireless Access Market Analysis by Mordor Intelligence
The Asia-Pacific Fixed Wireless Access Market size is estimated at USD 23.93 billion in 2025, and is expected to reach USD 53.16 billion by 2030, at a CAGR of 17.31% during the forecast period (2025-2030). Operators are turning to 5G-enabled FWA to bypass the civil works costs associated with fiber in mountainous islands, dense megacities, and hard-to-reach Tier 3 towns. Government spectrum liberalization, particularly for the 3.5 GHz and 26-28 GHz bands, continues to shorten rollout timelines and compress the total cost of ownership. Enterprise demand for campus networks and industrial IoT has triggered fresh competition from satellite-backhauled providers that can serve remote mines and offshore rigs. The investment case is further strengthened by 35–40% declines in 5G Advanced chipset prices, which allow carriers to subsidize customer-premise equipment (CPE) more aggressively.
Key Report Takeaways
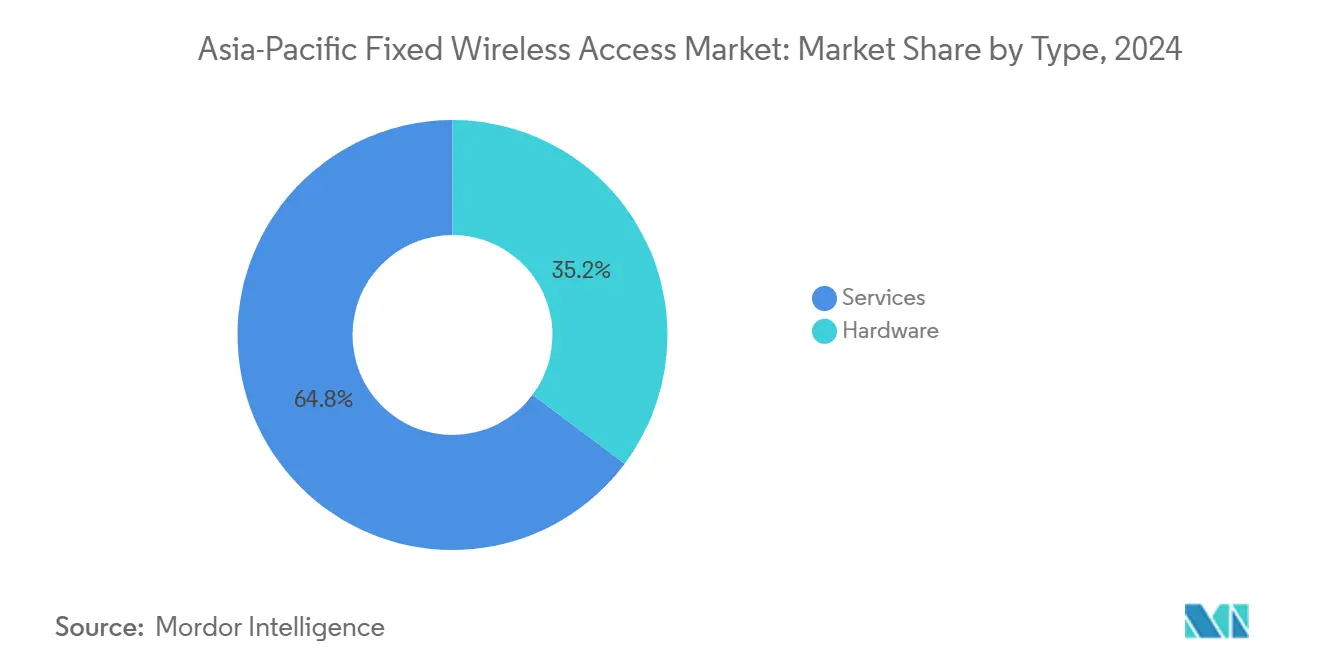
- By type, services held 64.79% of the Asia Pacific fixed wireless access market share in 2024 and are expected to expand at a 19.33% CAGR through 2030.
- By application, commercial deployments are forecast to grow at a 23.41% CAGR to 2030, while residential connections retained a 60.87% share in 2024.
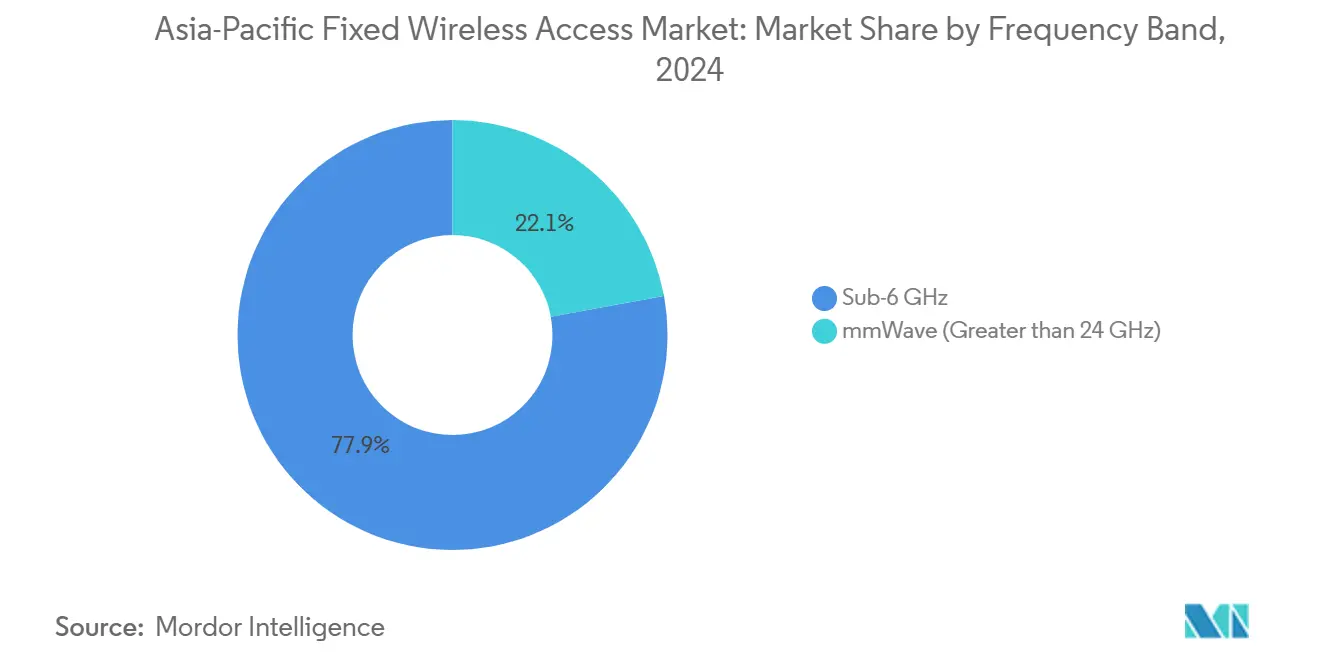
- By frequency, the sub-6 GHz bands commanded 77.91% of the Asia Pacific fixed wireless access market size in 2024; mmWave is expected to accelerate at a 28.46% CAGR.
- By deployment mode, indoor CPE accounted for 60.87% of the 2024 value, whereas outdoor units are set to register a 22.01% CAGR.
- By country, China contributed 37.11% revenue in 2024; India is advancing fastest with a 23.82% CAGR through 2030.
Asia operates as part of an interconnected international environment rather than as a self-contained unit. The fixed wireless access market research by Mordor Intelligence places together all major regional developments across the globe within that wider frame.
Asia-Pacific Fixed Wireless Access Market Trends and Insights
Drivers Impact Analysis*
| Driver | (~) % Impact on CAGR Forecast | Geographic Relevance | Impact Timeline |
|---|---|---|---|
| Government-backed 5G spectrum allocations | +3.2% | China, India, South Korea, Australia | Medium term (2–4 years) |
| 5G Advanced chipset price erosion | +2.8% | China, India, wider Asia Pacific | Short term (≤2 years) |
| Fiber rollout bottlenecks in tier-2/3 cities | +1.9% | India, China, Southeast Asia | Long term (≥4 years) |
| Telco-tower-company co-investment models | +1.7% | Philippines, Indonesia, Malaysia | Medium term (2–4 years) |
| mmWave-enabled campus networks | +1.4% | Japan, South Korea, Australia | Medium term (2–4 years) |
| Satellite-backhauled FWA for remote islands | +1.2% | Philippines, Indonesia, Pacific Islands | Long term (≥4 years) |
| Source: Mordor Intelligence | |||
Government-Backed 5G Spectrum Allocations
Streamlined spectrum auctions and site-sharing mandates are accelerating the densification of networks. Australia cleared 850 MHz in the 26 GHz band in 2024, and India’s auction raised USD 19 billion, which operators earmarked for suburban FWA rollouts [1]Australian Communications and Media Authority, “26 GHz Band Allocation 2024,” acma.gov.au. China’s regulators have synchronized the 3.5 GHz and 28 GHz assignments, enabling China Mobile to reach a target of exceeding 3.8 million 5G base stations by late 2024 [2]China Mobile, “Annual Report 2024,” chinamobileltd.com. The predictability of spectrum tenure incentivizes carriers to extend coverage beyond megacities, positioning FWA as a direct substitute for fiber in sparsely cabled districts.
5G Advanced Chipset Price Erosion
Qualcomm’s Snapdragon X75 and MediaTek’s T830 experienced price drops of nearly 35% in 2024, allowing vendors to release sub-USD 200 indoor CPEs that still support carrier aggregation and Wi-Fi 7 [3]Qualcomm, “Snapdragon X75 Specifications,” qualcomm.com. Samsung’s System-LSI group reported a 40% cost reduction, enabling operators in Indonesia and Vietnam to launch zero-down-payment plans. The resulting CAPEX relief lifts service uptake among price-sensitive homes and cafés without diluting margins.
Fiber Rollout Bottlenecks in Tier-2/3 Cities
Permitting delays and congested rights-of-way leave India’s tier-3 towns with less than 25% fiber penetration, despite Digital India goals. Chinese heritage districts face similar trenching constraints, prompting China Telecom to activate FWA in over 200 smaller cities. When the breakeven per-household passed exceeds USD 400 for fiber yet stays near USD 150 for FWA, operators pivot decisively to wireless last-mile delivery.
Telco-Tower-Company Co-Investment Models
Private equity is underwriting new macro and small-cell sites that host both mobile and FWA radios. KKR’s USD 400 million investment in Philippine towers in 2024 resulted in 40-50% opex savings for participating carriers. Shared poles shorten the payback period for rural clusters where single-tenant economics have historically failed, ensuring faster coverage growth without bloating balance sheets.
Restraints Impact Analysis*
| Restraint | (~) % Impact on CAGR Forecast | Geographic Relevance | Impact Timeline |
|---|---|---|---|
| High up-front CPE cost for rural households | -2.1% | India, Indonesia, Philippines, Vietnam | Short term (≤ 2 years) |
| Regulatory limits on power emission density | -1.8% | Japan, South Korea, Australia | Long term (≥ 4 years) |
| Fragmented spectrum holdings across markets | -1.4% | Southeast Asia, India tier-2/3 cities | Medium term (2-4 years) |
| Limited ROI in sparsely populated interiors | -1.2% | Australia, China western regions, Indonesia outer islands | Long term (≥ 4 years) |
| Source: Mordor Intelligence | |||
High Up-Front CPE Cost for Rural Households
Outdoor CPE capable of fiber-like throughput often retails above USD 300, equal to two-plus months of income for many Indonesian families. Airtel’s 24-month financing trims entry barriers but still suffers 12% default rates in remote Indian villages. Subsidy trade-offs challenge operators: generous device discounts spur uptake yet erode ARPU-based cash flows, while full-price offers cap penetration precisely where fixed wireless excels on a cost basis.
Regulatory Limits on Power Emission Density
Japan’s SAR limits curb mmWave base-station power to roughly 70% of technical potential, forcing denser site grids at higher cost. Australia employs similar thresholds that stretch coverage gaps in the outback. Certification cycles of six to twelve months slow equipment refreshes, leaving operators lagging on the newest antenna innovations that could compensate for lower power envelopes.
*Our forecasts treat driver/restraint impacts as directional, not additive. The impact forecasts reflect baseline growth, mix effects, and variable interactions.
Segment Analysis
By Type: Services Revenue Model Dominates Growth
Services accounted for 64.79% of the 2024 value, reflecting carriers’ preference for annuity-style billing over one-off device sales. The Asia Pacific fixed wireless access market size attributed to services is projected to rise at a 19.33% CAGR, widening the gap versus hardware. Operators retain CPE ownership, allowing seamless firmware upgrades and upsell paths to premium speed tiers. Hardware revenue growth lags because refresh cycles run four to five years, and many carriers bundle devices at cost. Vendors such as Nokia now frame gateways as enablers of value-added services like whole-home Wi-Fi analytics, illustrating a pivot from product margin to service stickiness. Enterprise access-unit demand remains resilient, however, as factories often insist on owning their own infrastructure for security and compliance purposes.
Second-order dynamics indicate a margin crossover by 2027, when lifetime service revenue per connection is expected to surpass cumulative device subsidies, even in price-sensitive markets. Telcos are increasingly bundling cybersecurity, cloud storage, and OTT video to boost the average revenue per account. Conversely, independent CPE makers are targeting niche verticals, such as maritime, mining, and oil rigs, where buyers prefer capital purchases and self-maintenance.


By Application: Commercial Segment Accelerates Despite Residential Lead
Residential still contributed 60.87% of 2024 turnover thanks to pent-up demand in fiber-light suburbs. The Asia Pacific fixed wireless access market share for commercial uses, however, is scaling rapidly as enterprises deploy FWA for primary and redundant links. Globe Telecom notes that the ARPU from small businesses is three to four times the consumer rate, supporting early profitability even at modest volumes. Manufacturing parks in Malaysia utilize private 5G to control AGVs and vision-inspection robots, demonstrating the suitability of FWA beyond best-effort access.
Looking forward, the commercial CAGR of 23.41% will be reinforced by standardized 5G slicing, which enables IT managers to reserve deterministic throughput without the fronthaul complexity of wired Ethernet. Industrial adoption is expected to increase as oil and gas firms adopt ruggedized outdoor CPE with ATEX certifications. These divergent adoption curves suggest a layered service portfolio, from no-frills broadband in rural homes to SLA-backed gigabit links in data-heavy campuses.
By Frequency Band: mmWave Gains Momentum Despite Sub-6 GHz Leadership
Sub-6 GHz accounted for 77.91% of 2024 revenue, as its favorable propagation supports wide-area coverage with modest tower density. The 3.5 GHz anchor band remains pivotal to the Asia Pacific fixed wireless access market, underpinning rural and suburban footprints. China Mobile utilizes both 2.6 GHz and 4.9 GHz to optimize urban penetration while adhering to emission caps.
mmWave, although currently a small market share, is expanding at a 28.46% CAGR. Japan’s 28 GHz licenses issued in 2024 empowered NTT DOCOMO to deliver multigigabit links to corporate campuses, positioning FWA as a viable alternative to LANs. Improvements in phased-array antennas and AI-based beam steering now extend cell range beyond one kilometer in line-of-sight corridors, making mmWave more economically attractive for dense business districts and stadium hotspots.
By Deployment Mode: Outdoor CPE Momentum Builds on Indoor Base
Indoor self-install gateways accounted for 60.87% of 2024 shipments due to their quick plug-and-play activation and lower bill of materials. They remain popular in apartments and cafés where window-mount reception suffices. Yet outdoor installations are projected to expand at a 22.01% CAGR as operators serve sparsely populated islands and industrial plants. Outdoor units generally deliver 60% higher capacity, owing to elevated antennas and IP-67 enclosures that withstand monsoon conditions. Tarana’s G1 beam-formed platform in Guam shows how outdoor gear can overcome non-line-of-sight clutter without spectrum-hungry repeaters.
A bifurcated landscape is emerging as cost-conscious households opt for indoor kits, whereas performance-critical factories and resorts rely on professional truck rolls for roof-mounted CPE that supports symmetrical megabit speeds during peak loads.
Geography Analysis
China’s 37.11% revenue share in 2024 rests on massive state-backed 5G infrastructure, with more than 3.8 million base stations online. Domestic suppliers Huawei and ZTE shorten lead times and keep unit costs low, letting carriers blanket counties and townships that still lack fiber. Rural pilots under the “Digital Countryside” plan bundle FWA with e-commerce and tele-education services, further locking in adoption.
India is on a sharper growth arc, climbing at 23.82% CAGR to 2030. Reliance Jio amassed 2.8 million subscribers by late 2024, while Bharti Airtel’s AirFiber spans 1,300+ cities. Fiber scarcity in tier-2 and tier-3 urban clusters, coupled with favorable right-of-way fee waivers, prompts households to opt for wireless broadband as their primary line. New spectrum caps that allow carriers to pool unused blocks also accelerate rural coverage.
Mature markets, such as Japan, South Korea, Australia, and New Zealand, exhibit slower volume growth yet lead in premium tiers. Australia’s National Broadband Network spent AUD 750 million upgrading fixed wireless to 400/40 Mbps tiers in 2025 to counter Starlink’s incursion. Japan leverages 5G standalone cores to enable deterministic slices for video production houses that require upstream gigabit rates.
Southeast Asia remains the wild card. The Philippines, Indonesia, Malaysia, Thailand, and Vietnam combine youthful demographics with patchy terrestrial backbones. KKR-funded tower rollouts reduce leasing fees, prompting carriers to activate FWA in previously uneconomic areas, such as fishing villages and plantation estates. Collectively, these “rest of Asia Pacific” nations are expected to add more than 30 million new lines by 2030, underscoring the role of FWA in inclusive connectivity.
The fixed wireless access market is assessed by Mordor Intelligence through a multi-layered geographic lens, covering other regions such as Africa, North America, and Middle East, along with detailed country-level analysis for France and Germany.
Competitive Landscape
Competition balances legacy equipment giants against inventive challengers. Huawei, ZTE, Nokia, Ericsson, and Samsung together shipped an estimated 55% of carrier-grade FWA radios in 2024. Their end-to-end portfolios, spanning RAN to core, resonate with operators that prefer single-vendor integration. Yet specialists such as Tarana Wireless differentiate with interference-cancellation algorithms suited for congested suburbs, while Starlink’s LEO constellation offers hybrid satellite-FWA packages to outlying archipelagos.
Strategic alliances dominate go-to-market tactics. Nokia inked multi-year managed-service contracts with carriers in India and Indonesia to operate entire FWA stacks, bundling AI-driven OSS tools that guarantee 99.95% uptime. Infrastructure investors like DigitalBridge finance neutral-host small-cell grids, letting rival carriers lease capacity without duplicating street furniture. Vertical-specific integrators, such as ports, oil refineries, and open-pit mines, often collaborate with private-network specialists who preload deterministic quality of service profiles and OT security features.
Regulation also shapes the vendor field. Meeting power-density and cybersecurity audits across 17 jurisdictions favors incumbents that maintain in-house compliance teams. Meanwhile, chip vendors are entering the turnkey CPE design market. Qualcomm offers reference boards with pre-certified radio stacks, thereby compressing the time-to-market for white-label ODMs. Price wars persist at the low end, yet premium enterprise segments value SLA-backed performance and integrated support, a niche where legacy multinationals still hold sway.
Asia-Pacific Fixed Wireless Access Industry Leaders
Huawei Technologies Co., Ltd.
ZTE Corporation
Nokia Oyj
Telefonaktiebolaget LM Ericsson
Samsung Electronics Co., Ltd.
- *Disclaimer: Major Players sorted in no particular order

Recent Industry Developments
- May 2025: Globe Telecom has expanded its 5G FWA coverage to 9.5 million Philippine premises, a 40% increase over 2024 coverage.
- February 2025: NBN Co completed an AUD 750 million upgrade that expanded Australian fixed wireless footprints to 345,000 km² and introduced 400/40 Mbps tiers.
- March 2024: KKR invested USD 400 million in Philippine tower assets, cutting single-tenant deployment costs by 40-50%.


Asia-Pacific Fixed Wireless Access Market Report Scope
| Hardware | Consumer Premise Equipment (CPE) |
| Access Units (Femto and Pico-cells) | |
| Services |
| Residential |
| Commercial |
| Industrial |
| Sub-6 GHz |
| mmWave (> 24 GHz) |
| Indoor CPE |
| Outdoor CPE |
| China |
| India |
| Japan |
| South Korea |
| Australia and New Zealand |
| Rest of Asia Pacific |
| By Type | Hardware | Consumer Premise Equipment (CPE) |
| Access Units (Femto and Pico-cells) | ||
| Services | ||
| By Application | Residential | |
| Commercial | ||
| Industrial | ||
| By Frequency Band | Sub-6 GHz | |
| mmWave (> 24 GHz) | ||
| By Deployment Mode | Indoor CPE | |
| Outdoor CPE | ||
| By Country | China | |
| India | ||
| Japan | ||
| South Korea | ||
| Australia and New Zealand | ||
| Rest of Asia Pacific |


Key Questions Answered in the Report
What is the 2025 value of the Asia Pacific fixed wireless access market?
The market stands at USD 23.93 billion in 2025.
How fast is the market expected to grow?
It is forecast to expand at a 17.31% CAGR through 2030.
Which country contributes the most revenue?
China leads with 37.11% share as of 2024.
Which segment grows fastest by application?
Commercial deployments are projected to rise at 23.41% CAGR to 2030.
Why are services outpacing hardware sales?
Operators favor recurring revenue, owning CPE and layering value-added offerings that lift lifetime ARPU.
What limits adoption in rural areas?
High up-front CPE costs that can equal several months of household income in markets like Indonesia.
Page last updated on:


