Africa Fixed Wireless Access Market Size and Share
Market Overview
| Study Period | 2019 - 2030 |
|---|---|
| Forecast Data Period | 2025 - 2030 |
| Historical Data Period | 2019 - 2023 |
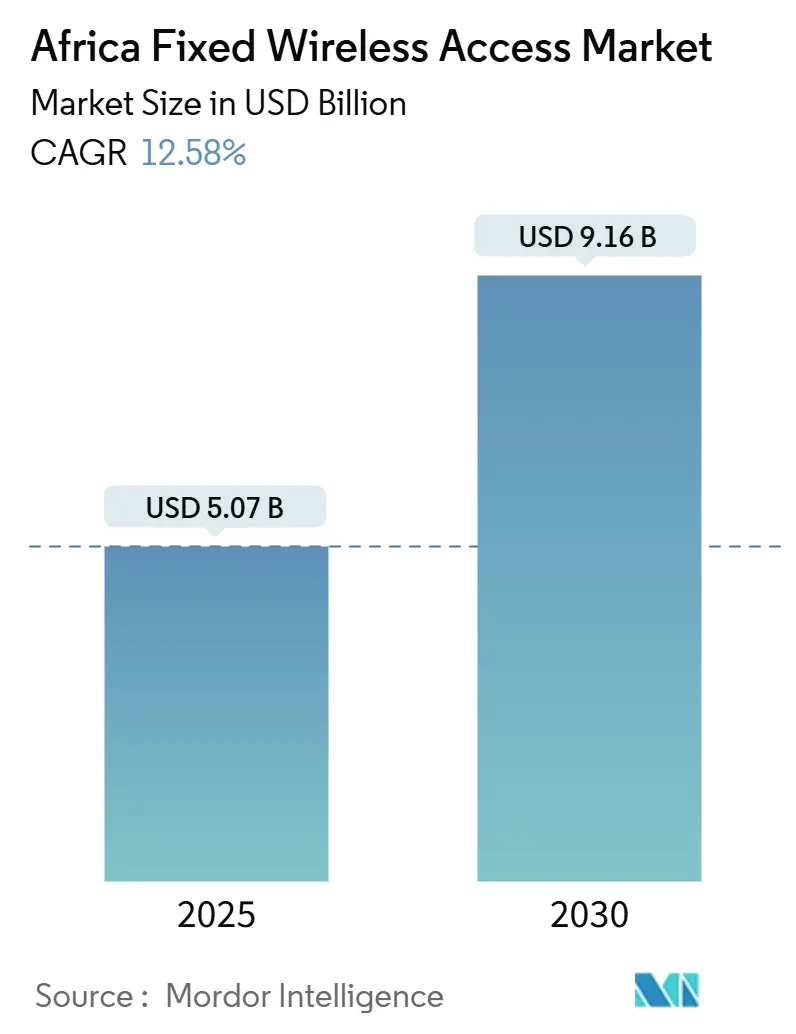
| Market Size (2025) | USD 5.07 Billion |
| Market Size (2030) | USD 9.16 Billion |
| Growth Rate (2025 - 2030) | 12.58% CAGR |
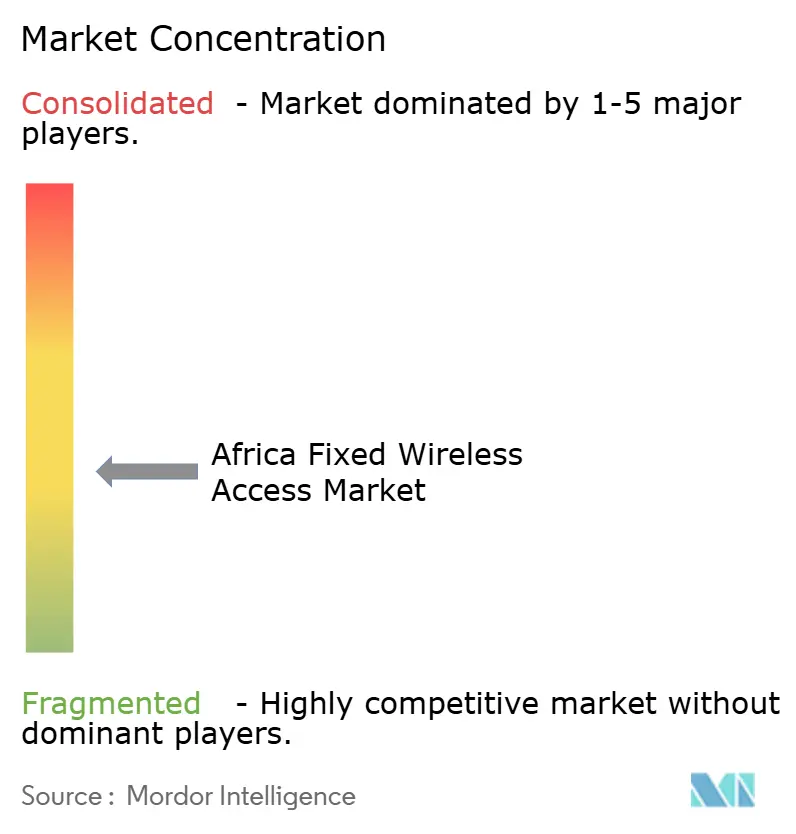
| Market Concentration | Medium |
Major Players *Disclaimer: Major Players sorted in no particular order Image © Mordor Intelligence. Reuse requires attribution under CC BY 4.0. | |
Africa Fixed Wireless Access Market Analysis by Mordor Intelligence
The Africa Fixed Wireless Access Market size is estimated at USD 5.07 billion in 2025, and is expected to reach USD 9.16 billion by 2030, at a CAGR of 12.58% during the forecast period (2025-2030).
Explosive demand for cost-effective broadband, spectrum liberalization in more than 18 countries, and rapid 5G CPE price declines anchor this expansion. Governments now view wireless broadband as the quickest path to shrink the digital divide, prompting operators to accelerate roll-outs that bypass fiber’s high last-mile costs. Heightened competition—especially after Starlink’s entry—pushes incumbents toward uncapped data plans and larger network-sharing deals, while solar-powered rural towers reduce opex by over 35% in off-grid areas. Rising enterprise demand from mining, oil & gas, and manufacturing further broadens the revenue base, ensuring long-term momentum for the Africa Fixed Wireless Access market.
Key Report Takeaways
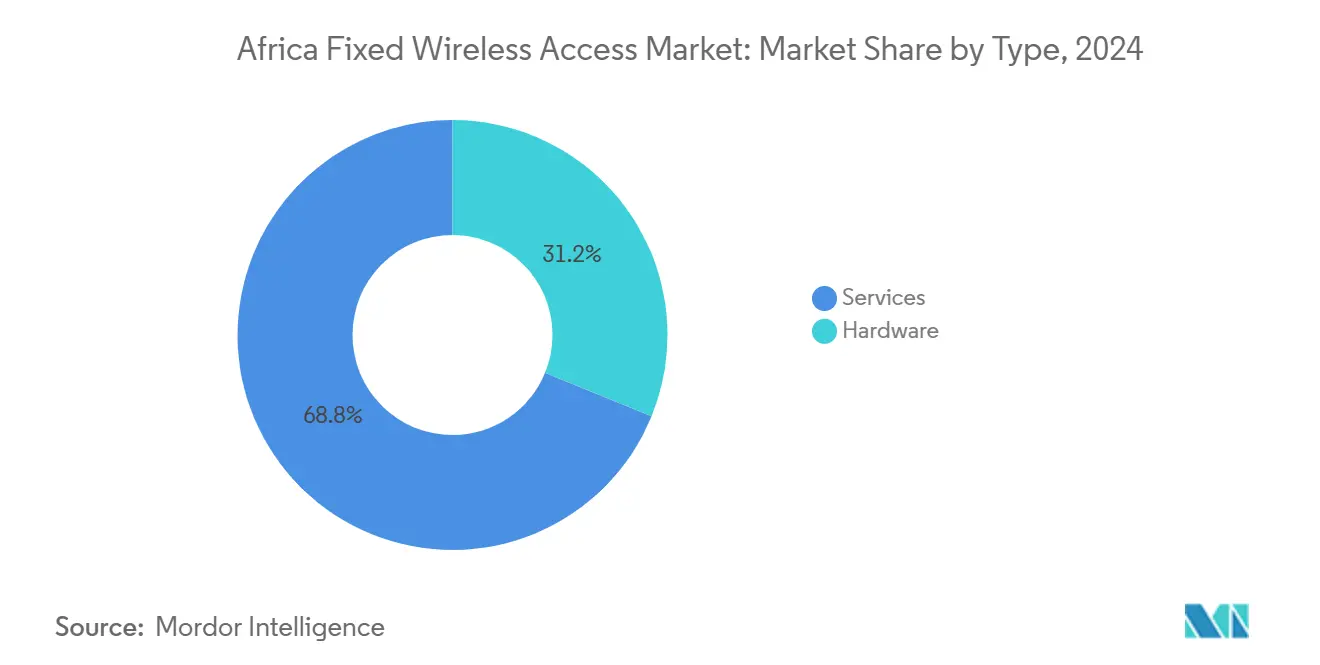
- By type, services captured 68.84% of the Africa Fixed Wireless Access market share in 2024; hardware is forecast to grow at 14.39% CAGR through 2030.
- By application, residential held 62.68% of the Africa Fixed Wireless Access market size in 2024, while industrial applications are advancing at a 21.04% CAGR to 2030.
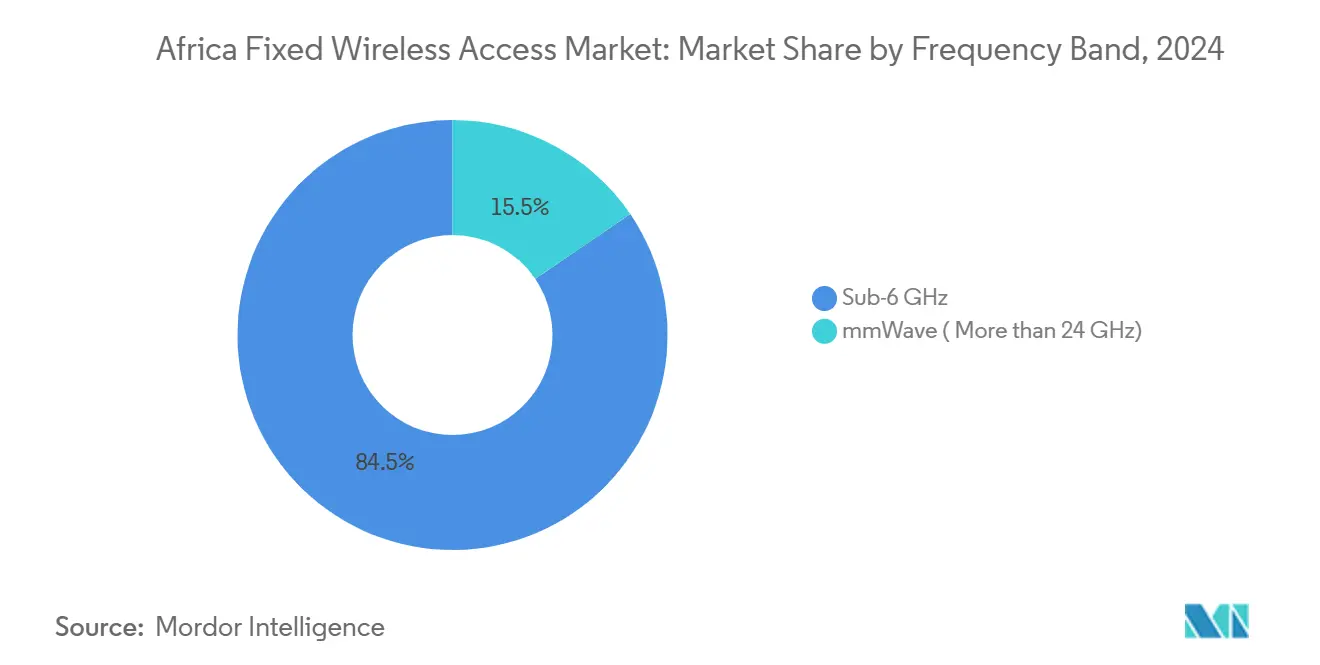
- By frequency band, sub-6 GHz accounted for 84.52% share of the Africa Fixed Wireless Access market size in 2024; mmWave frequencies are projected to expand at 24.56% CAGR through 2030.
- By deployment mode, indoor CPE commanded 73.05% share in 2024; outdoor CPE is the fastest-growing at 19.80% CAGR to 2030.
- By country, South Africa led with 23.48% revenue share in 2024, whereas Kenya posts the highest expected CAGR at 18.43% to 2030.
Competitive positioning in Africa includes both locally based firms and those operating across multiple regions. The market landscape in the global fixed wireless access industry research shows how these players are arranged internationally.
Africa Fixed Wireless Access Market Trends and Insights
Drivers Impact Analysis*
| Driver | (~) % Impact on CAGR Forecast | Geographic Relevance | Impact Timeline |
|---|---|---|---|
| Mid-band 3.5 GHz spectrum release | +3.2% | Continental focus on South Africa, Nigeria, Kenya, Egypt | Medium term (2-4 years) |
| 5G CPE prices falling below USD 80 | +2.8% | South Africa & Nigeria core | Short term (≤ 2 years) |
| Solar-powered rural sites | +2.1% | Rural Nigeria, South Africa, Kenya | Long term (≥ 4 years) |
| Performance-based FWA vouchers | +1.9% | Eastern & Southern Africa | Medium term (2-4 years) |
| Starlink-driven pricing shifts | +1.7% | Urban centers in 18 markets | Short term (≤ 2 years) |
| Open-access metro-fiber roll-outs | +1.5% | Kenya, Egypt, Côte d’Ivoire | Medium term (2-4 years) |
| Source: Mordor Intelligence | |||
Accelerated Mid-Band Spectrum Liberalization Drives Network Modernization
Systematic 3.5 GHz allocations across 18+ jurisdictions help operators sidestep fiber bottlenecks, cutting last-mile connection costs that often exceed USD 1,000 in low-density zones. [1]Connecting Africa, “Spectrum Liberalisation and FWA Growth,” connectingafrica.comEgypt’s USD 675 million multi-operator 5G licensing round illustrates policymakers’ push to monetize spectrum while stimulating broadband access. Harmonized tariff schedules inside the East African Community speed cross-border equipment flows, further lowering deployment friction for regional operators. As licenses mandate population-coverage targets, carriers prioritize fixed wireless roll-outs that meet obligations faster than fiber. These aligned incentives keep spectrum releases a top driver for the Africa Fixed Wireless Access market.
Solar-Powered Rural Sites Transform FWA Economics
Hybrid solar-battery towers slash opex by more than 35% versus diesel as demonstrated by IHS Nigeria’s partnership with Jaza Energy on 250 rural sites. [2]MyBroadband, “Starlink Capacity Constraints in Africa,” mybroadband.co.zaA levelized cost of energy of USD 0.106 per kWh and 96.3% renewable penetration recorded in Nigerian pilots prove commercial viability. Lower power costs widen the business case for serving villages previously deemed uneconomical, unlocking new addressable households. Operators also gain ESG credibility, easing access to blended-finance facilities that fund network growth. In turn, this renewable paradigm underpins robust rural uptake within the Africa Fixed Wireless Access market.
CPE Price Compression Accelerates Consumer Adoption
Retail prices for 5G-enabled CPE dipped below USD 80 in South Africa and Nigeria during 2025, eliminating a key affordability hurdle. Vendors achieve these levels through economies of scale and new chipsets, allowing operators to bundle devices with data plans at minimal upfront outlay. Entry-level outdoor units designed for African climates maintain performance under extreme heat and voltage fluctuations, ensuring reliability. As household budgets in tier-two cities improve, low-cost CPE spurs faster subscriber additions, reinforcing service-led revenue models. The resulting uptick in activations feeds directly into the Africa Fixed Wireless Access market’s growth trajectory.
Starlink Competition Reshapes Operator Strategies
Starlink’s launches in 18 markets compelled MNOs to introduce uncapped data offerings and deepen network-sharing pacts to match satellite QoS promises. Yet sporadic service suspensions in Lagos, Nairobi, and Harare expose capacity gaps that terrestrial providers swiftly exploit. Incumbents capitalize on regulatory delays facing satellite operators—such as equity-equivalent rules in South Africa—to cement market positions. Bundled entertainment, fintech, and cloud services further differentiate operator portfolios. These strategic shifts heighten competition but, overall, increase broadband adoption, supporting the expanding Africa Fixed Wireless Access market.
Restraints Impact Analysis*
| Restraint | (~) % Impact on CAGR Forecast | Geographic Relevance | Impact Timeline |
|---|---|---|---|
| Slow 6 GHz licensing for Wi-Fi 6E/7 backhaul | -1.8% | Continental | Long term (≥ 4 years) |
| 5-35% import duties on CPE | -2.3% | West & Central Africa | Medium term (2-4 years) |
| Load-shedding & unreliable grids | -1.5% | South Africa, Nigeria, Ghana | Short term (≤ 2 years) |
| Fragmented right-of-way rules | -1.1% | Major urban centers | Medium term (2-4 years) |
| Source: Mordor Intelligence | |||
Import Duty Barriers Constrain Equipment Accessibility
Tariffs averaging 25% in Kenya and similar levies across 26 other states inflate end-user device prices, slowing mass take-up. Operators either absorb margin erosion or raise tariffs, both of which impede subscriber growth. Sensitive-item classifications under EAC’s common tariff keep many telecom SKUs in higher-duty bands despite industry lobbying. The Africa Fixed Wireless Access market therefore expands more slowly in duty-heavy regions, underscoring the case for harmonized, lower customs regimes.
Power Grid Instability Elevates Operational Complexity
South Africa endured 280 days of power cuts recently, inflating site opex by 8-12% even after solar retrofits. MTN’s USD 101.3 million supplemental spend on generators and batteries highlights scale of resilience investments. [3]Developing Telecoms, “MTN Invests in Power Resilience,” developingtelecoms.com New tariff structures that favor high fixed charges raise breakeven thresholds for rural nodes, delaying network densification. Although hybrid power solutions lower long-term costs, upfront capex strains cash flows. Persistent grid unreliability thus tempers the near-term growth rate of the Africa Fixed Wireless Access market.
*Our forecasts treat driver/restraint impacts as directional, not additive. The impact forecasts reflect baseline growth, mix effects, and variable interactions.
Segment Analysis
By Type: Services Command Revenue Momentum
Services accounted for 68.84% of the Africa Fixed Wireless Access market share in 2024 as monthly data bundles, managed connectivity, and value-added solutions formed the core monetization engine. Subscription-based cash flows improve operators’ leverage for capex financing, enabling faster coverage expansion. Hardware revenue remains necessary for ecosystem health yet faces deflationary pressure from intensified vendor competition. As wholesalers introduce white-label offerings, smaller ISPs can resell capacity without large inventory risks, bolstering total addressable demand.
With the services model, operators cross-sell mobile money and cloud collaboration, raising average revenue per user. Distribution platforms such as Airtel’s 117,000 new agents widen rural reach, supporting incremental conversions. Over 2025-2030, services revenue is forecast to compound at 14.39% CAGR, outpacing hardware and contributing the largest share to the Africa Fixed Wireless Access market size through the period.


By Application: Industrial Uptick Signals B2B Pivot
Residential uses retained 62.68% share in 2024, reflecting pent-up household demand for streaming and remote work. However, industrial deployments will register a 21.04% CAGR to 2030 as mines, refineries, and factories digitalize operational technology. Automated haul-trucks, safety sensors, and real-time SCADA systems rely on low-latency links, positioning FWA as a cost-effective alternative to private fiber. The Africa Fixed Wireless Access market size for industrial customers is projected to leap sharply as multi-site contracts materialize.
Carriers now bundle edge computing, cybersecurity, and managed Wi-Fi with connectivity, yielding higher margins than consumer data. MTN leverages its enterprise portfolio to upsell dedicated links that guarantee service-level agreements. In turn, these specialized applications diversify revenue and cushion operators against consumer price wars, cementing industrial use cases as a critical growth pillar.
By Frequency Band: mmWave Gains Traction
Sub-6 GHz held 84.52% share in 2024 thanks to its propagation prowess across sprawling settlements. Yet mmWave links above 24 GHz, while initially niche, are projected to post a 24.56% CAGR, especially for multi-gigabit corporate campuses. ZTE testbeds recording 30 Gbps throughput validate feasibility once line-of-sight challenges are mitigated. Regulators in Kenya, Egypt, and Côte d’Ivoire are drafting mmWave frameworks that balance high-capacity promise with manageable interference.
As metro fiber densifies, operators deploy short-haul mmWave backhaul to avoid costly trenching. Enterprises pay premiums for bandwidth peaks unattainable on sub-6 GHz, lifting average selling prices. Consequently, the Africa Fixed Wireless Access market will reflect a dual-band strategy: wide-area coverage via sub-6 GHz and capacity overlays via mmWave.
By Deployment Mode: Outdoor CPE Extends Rural Reach
Indoor CPE dominated 73.05% of 2024 shipments due to simple self-install kits suitable for urban apartments. Nonetheless, outdoor units—projected at 19.80% CAGR—solve line-of-sight obstacles in fringe villages. Solar-integrated antennas and weather-hardened enclosures withstand harsh climates, ensuring uptime. Carriers use outdoor gear to comply with universal service obligations, leveraging voucher programs subsidized by development banks.
Advances such as Nokia’s Wi-Fi 7-ready gateways enhance user experience, pushing monthly household usage beyond 250 GB. As costs fall, some operators will transition indoor legacy customers to outdoor variants to uplift speeds, thereby increasing stickiness and lowering churn in the Africa Fixed Wireless Access market.
Geography Analysis
South Africa retained 23.48% share in 2024 owing to mature infrastructure and supportive regulation. Large carriers commit sizable budgets—MTN invested USD 101.3 million in resilience upgrades—to counter load-shedding and maintain service quality. Yet rising fixed electricity charges and equity ownership requirements for foreign players deter new entrants, keeping competitive pressure moderate.
Kenya, forecast at 18.43% CAGR, benefits from Safaricom’s aggressive roll-outs and open-access metro-fiber that cuts backhaul costs. Import duties averaging 25% still weigh on device affordability, but clear licensing rules reduce market uncertainty USITA. World Bank-backed voucher schemes further stimulate rural demand, making Kenya the bright spot within the Africa Fixed Wireless Access market.
Nigeria, Egypt, Ghana, Tanzania, Morocco, and Algeria show varied momentum shaped by currency risk, spectrum fees, and energy pricing. Nigeria’s naira depreciation squeezes margins even as Airtel adds 2,800 sites. Egypt’s USD 675 million spectrum auction brings all four operators into 5G, spurring competitive packages that accelerate household adoption. Morocco’s collaborative fiber and 5G ventures offset capital intensity, while Ghana’s shared-infra model lowers duplication. Collectively, these markets underpin the next wave of additions to the Africa Fixed Wireless Access market size.
Mordor Intelligence tracks the fixed wireless access market across other major regions such as Middle East, South America, and North America, with additional country-level coverage spanning France and Germany, each reflecting localized structural drivers, restraints and more.
Competitive Landscape
The Africa Fixed Wireless Access market features moderate concentration with legacy MNOs leveraging spectrum and tower portfolios against niche FWA specialists. MTN, Vodacom, and Airtel combine to cover most urban centers, using network-sharing to cut costs and accelerate 5G roll-outs. Starlink introduces satellite competition, but regulatory delays and capacity constraints limit its urban footprint, giving terrestrial players a near-term edge.
Equipment vendors shape performance differentiation. Nokia’s Wi-Fi 7 FastMile Gateway and ZTE’s mmWave trials offer higher throughputs that tempt premium subscribers. Huawei and Samsung focus on integrated power-efficient chipsets suitable for off-grid towers. Local assemblers may gain policy incentives to reduce import duty burdens, altering the hardware value chain. Collectively, strategic capex, technology innovation, and policy navigation dictate positioning within the Africa Fixed Wireless Access market.
Africa Fixed Wireless Access Industry Leaders
MTN Group
Vodacom Group
Telkom South Africa
Rain Networks
Airtel Africa
- *Disclaimer: Major Players sorted in no particular order

Recent Industry Developments
- April 2025: MTN Nigeria issued its 2024 annual report, outlining FWA expansion priorities across West Africa.
- March 2025: Daystar Power, RMI, and USTDA funded hybrid solar pilots for 20 telecom-reliant businesses, saving clients 26% on energy costs.
- February 2025: Vodafone Group posted 11.6% organic Africa service-revenue growth in Q3 FY25, citing fixed connectivity momentum.
- January 2025: MTN Group reported 30.4% data traffic growth and 17.9% data revenue upturn in Q1 2025, hitting 161.7 million active data customers.


Africa Fixed Wireless Access Market Report Scope
| Hardware | Consumer Premise Equipment (CPE) |
| Access Units (Femto and Pico Cells) | |
| Services |
| Residential |
| Commercial |
| Industrial |
| Sub-6 GHz |
| mmWave (above 24 GHz) |
| Indoor CPE |
| Outdoor CPE |
| Algeria |
| Kenya |
| Morocco |
| South Africa |
| Nigeria |
| Ghana |
| Egypt |
| Tanzania |
| Rest of Africa (Tunisia, Uganda, Zambia, Senegal, and Others) |
| By Type | Hardware | Consumer Premise Equipment (CPE) |
| Access Units (Femto and Pico Cells) | ||
| Services | ||
| By Application | Residential | |
| Commercial | ||
| Industrial | ||
| By Frequency Band | Sub-6 GHz | |
| mmWave (above 24 GHz) | ||
| By Deployment Mode | Indoor CPE | |
| Outdoor CPE | ||
| By Country | Algeria | |
| Kenya | ||
| Morocco | ||
| South Africa | ||
| Nigeria | ||
| Ghana | ||
| Egypt | ||
| Tanzania | ||
| Rest of Africa (Tunisia, Uganda, Zambia, Senegal, and Others) |


Key Questions Answered in the Report
How large is the Africa Fixed Wireless Access market in 2025?
The Africa Fixed Wireless Access market size stands at USD 5.07 billion in 2025.
What is the forecast CAGR of Africa’s fixed wireless segment?
The market is projected to grow at a 12.58% CAGR between 2025 and 2030.
Which country leads in revenue share?
South Africa leads with 23.48% share as of 2024.
Which application segment is growing the fastest?
Industrial applications are forecast to expand at a 21.04% CAGR through 2030.
Why are outdoor CPE shipments increasing?
Operators use weather-hardened outdoor units to extend coverage into rural and semi-urban areas where indoor CPE cannot guarantee signal quality.
What is driving CPE affordability?
Retail prices for 5G-enabled CPE have fallen below USD 80 in key markets, aided by economies of scale and fiercer vendor competition.
Page last updated on:


