Market Overview
| Study Period | 2017 - 2029 |
|---|---|
| Forecast Data Period | 2025 - 2029 |
| Historical Data Period | 2017 - 2023 |
| Market Size (2025) | USD 0.77 Billion |
| Market Size (2029) | USD 1.3 Billion |
| Growth Rate (2025 - 2029) | 14.16% CAGR |
| Market Concentration | High |
Major Players*Disclaimer: Major Players sorted in no particular order Image © Mordor Intelligence. Reuse requires attribution under CC BY 4.0. | |

North America Electric Bus Market Analysis by Mordor Intelligence
The North America Electric Bus Market size is estimated at 0.77 billion USD in 2025, and is expected to reach 1.3 billion USD by 2029, growing at a CAGR of 14.16% during the forecast period (2025-2029).
The North American electric bus industry is experiencing a transformative phase driven by substantial manufacturing investments and technological advancements. Major automotive players are establishing robust production capabilities, exemplified by Toyota's December 2022 announcement of a USD 1.29 billion investment in a battery manufacturing facility in North Carolina. This facility, featuring four production lines, is designed to produce 800,000 batteries annually when operations commence in 2025. The strategic positioning of manufacturing facilities across the region demonstrates a long-term commitment to domestic production capabilities and supply chain optimization. These investments are complemented by technological innovations in battery efficiency, charging infrastructure, and vehicle performance, positioning North America as an emerging hub for electric bus manufacturers.
The industry landscape is being reshaped by strategic partnerships and collaborations among electric bus manufacturers, technology providers, and infrastructure developers. Leading manufacturers are forming alliances to enhance their technological capabilities and market presence. For instance, in September 2023, Daimler Trucks & Buses US, PACCAR, and Accelera by Cummins announced a partnership to localize battery cell production in the United States. These collaborations are facilitating knowledge transfer, resource optimization, and accelerated innovation in electric bus technology. The industry is witnessing a shift from traditional competition to collaborative approaches in addressing common challenges related to technology development and infrastructure deployment.
The market is characterized by rapid technological evolution, particularly in battery technology and charging solutions. Currently, while battery-charged electric buses typically offer a driving range of 70-100 miles, advanced models can achieve up to 265 miles before requiring a recharge. This technological progression is particularly significant when compared to traditional diesel buses that average a range of 690 miles. The industry's focus on technological advancement is evident in the continuous improvement of battery capacity, charging efficiency, and overall vehicle performance, making battery electric buses increasingly viable for diverse operational requirements.
The global context provides important perspective on North America's market potential, with current statistics indicating that approximately 386,000 electric buses are in operation worldwide, though China dominates with a 99% market share. However, projections indicate a significant shift in market dynamics, with estimates suggesting that by 2030, 84% of new municipal bus sales will be electric, and by 2025, half of the global municipal bus fleet will be electric. This global transition is influencing the North America Electric Bus Market development, with cities increasingly recognizing electric buses as an ideal fit for urban transportation due to their shorter travel distances and the convenience of centralized depot charging infrastructure.
North America Electric Bus Market Trends and Insights
Growing demand for electric vehicles in North America driven by government support and growing environmental concerns
- The CVP in Russia has experienced significant fluctuations in recent years. It climbed steadily from USD 208.2 million in 2017, peaking in 2019. However, it dipped to USD 193.9 million in 2020, largely due to the economic challenges brought on by the COVID-19 pandemic. Notably, the market rebounded sharply in 2022, reaching USD 269.8 million. This resurgence highlights both the resilience of the Russian automotive sector and the potential impact of economic stimulus measures and heightened consumer demand.
- Government incentives and subsidies are proving to be a strong draw for customers, particularly logistics and e-commerce firms, in their adoption of electric commercial vehicles. A case in point is Canada and North America, where, in April 2022, the government unveiled federal rebates of USD 5000 for electric light- and medium-duty vehicles. These initiatives are expected to significantly bolster the demand for electric commercial vehicles in North America from 2024 to 2030.
- Government initiatives, including plans for EV deployment, attractive incentives, and foreign investment allowances, are set to propel the electric vehicle market across North American nations. In a notable move, in March 2022, Volkswagen committed a staggering USD 7 billion to establish an electric car manufacturing facility in North America. By 2030, the automaker plans to roll out 25 new EV models, catering to customers in the US, Mexico, and Canada. As a result, the demand for electric vehicles is projected to witness a notable surge across various North American countries from 2024 to 2030.


OTHER KEY INDUSTRY TRENDS COVERED IN THE REPORT
- North America's demographic story highlights steady growth and adaptability, with each nation contributing uniquely to the region's vibrant mosaic, underlining its continued global significance
- North America exhibits diverse trends in CVP, with Canada experiencing a slight decrease, the US seeing an increase, and Mexico showing significant growth
- In North America, from 2017 to 2023, auto loan interest rates displayed varied trends: Canada's rates gradually increased, Mexico's showed significant volatility, and the US experienced modest fluctuations
- North America is showcasing a strong commitment to expanding its EV infrastructure, with both slow and fast charging stations seeing significant growth
- The rising demand for electric vehicles spurs new product launches and market entry in North America, driving the demand for battery packs
- In 2023, Ford led the North American light commercial van market, followed by Chevrolet, while Hyundai witnessed significant growth.
- Despite challenges in 2020, by 2023, the US experienced growth, Mexico displayed a robust recovery, while Canada witnessed a dip
- From 2017 to 2023, North America, particularly countries like the US and Canada, navigated inflationary spikes, especially post-pandemic in 2022
- The North American MaaS sector is thriving and witnessing growth, with future prospects in shared mobility
- Declining prices of lithium-ion batteries drive the demand for electric vehicles in North America
- Fuel prices are fluctuating in North America
Segment Analysis: Fuel Category
HEV Segment in North America Electric Bus Market
Hybrid Electric Vehicles (HEV) maintain their dominance in the North American electric bus market, commanding approximately 52% of the total market share in 2024. This substantial market presence can be attributed to the segment's ability to offer a balanced solution between traditional internal combustion engines and fully electric powertrains. HEV buses have gained significant traction among transit authorities and operators due to their proven reliability, lower initial investment costs compared to fully electric alternatives, and reduced range anxiety. The segment's success is further bolstered by the extensive existing infrastructure that supports hybrid technology, making it a practical choice for operators transitioning from conventional buses to more sustainable options. Additionally, HEV buses offer operational flexibility in various weather conditions and route types, which has contributed to their widespread adoption across different regions in North America.
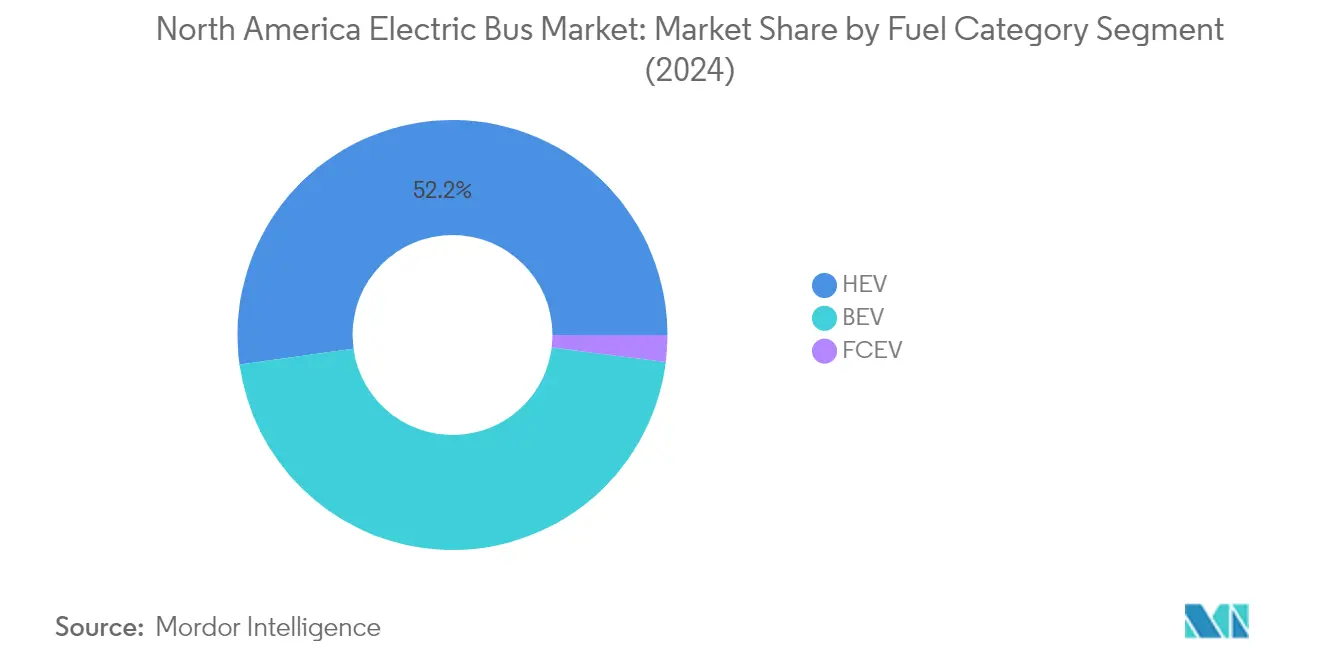

FCEV Segment in North America Electric Bus Market
The Fuel Cell Electric Vehicle (FCEV) segment is emerging as the fastest-growing category in the North American electric bus market, with a projected growth rate of approximately 24% during 2024-2029. This remarkable growth trajectory is driven by increasing investments in hydrogen infrastructure and growing recognition of fuel cell technology's advantages in heavy-duty applications. The segment's expansion is supported by technological advancements in hydrogen fuel cell systems, which have significantly improved efficiency and reduced operational costs. Transit authorities are increasingly considering FCEV buses for their zero-emission fleets due to their quick refueling capabilities, longer range compared to battery-electric alternatives, and consistent performance in varying weather conditions. The segment's growth is further accelerated by supportive government policies and funding initiatives aimed at promoting hydrogen technology in public transportation.
Remaining Segments in Fuel Category
The Battery Electric Bus (BEV) segment represents a significant portion of the North American electric bus market, offering completely zero-emission solutions for urban transit operations. BEV buses are particularly attractive for short to medium-range routes in urban environments where charging infrastructure can be strategically placed. The segment's growth is driven by improving battery technology, decreasing battery costs, and an increasing focus on reducing urban air pollution. Transit authorities are increasingly adopting BEV buses for their lower operating costs, reduced maintenance requirements, and alignment with stringent environmental regulations. The segment continues to evolve with innovations in fast-charging technology and battery management systems, making it an increasingly viable option for various transit applications.
North America Electric Bus Market Geography Segment Analysis
North America Electric Bus Market in United States
The United States electric bus market dominates the North American electric bus market, commanding approximately 58% of the total market value in 2024. The nation's leadership position stems from its robust infrastructure development, comprehensive government support programs, and strong presence of major bus manufacturers in USA. The Federal Transit Administration's strategic initiatives, particularly through its Low-No Program, have been instrumental in accelerating the adoption of zero-emission buses across various states. The country's commitment to sustainable public transportation is evident in its extensive network of charging infrastructure and supportive policy framework. Major metropolitan areas are increasingly transitioning their public transit fleets to electric alternatives, driven by both environmental considerations and long-term cost benefits. The market's dynamism is further enhanced by continuous technological innovations, particularly in battery technology and charging solutions, making electric buses in USA increasingly viable for diverse operational requirements. The presence of established manufacturers and emerging players has created a competitive environment that fosters innovation and market growth.
North America Electric Bus Market in Canada
Canada has emerged as a significant player in the North American electric bus market, driven by its ambitious climate action goals and comprehensive electrification initiatives. The country's approach to electric bus adoption is characterized by strong federal-provincial collaboration and innovative funding mechanisms. The Canadian Infrastructure Bank's dedicated zero-emission bus program has been particularly influential in accelerating market development. The nation's cold-weather expertise has led to the development of specialized electric bus solutions capable of performing efficiently in extreme weather conditions. Urban centers across Canada are increasingly integrating electric buses into their public transportation networks, supported by robust charging infrastructure development. The country's manufacturing capabilities, particularly in Quebec and Ontario, have strengthened its position in the electric bus value chain. Canadian cities are also leveraging their experience with electric trolleybuses to facilitate the transition to battery-electric buses, while simultaneously developing expertise in maintenance and operations.
North America Electric Bus Market in Mexico
Mexico's electric bus market is experiencing a transformative phase, characterized by increasing urbanization and growing environmental consciousness. The country's strategic position as a manufacturing hub has attracted significant investment from international electric bus manufacturers looking to establish production facilities. Mexico City's pioneering role in implementing restrictions on diesel vehicles has set a precedent for other major urban areas. The nation's focus on developing domestic manufacturing capabilities has created opportunities for local component suppliers and technical expertise development. The integration of electric buses aligns with Mexico's broader goals of reducing urban air pollution and modernizing public transportation infrastructure. The country's unique market dynamics, including its proximity to the United States and competitive labor costs, have positioned it favorably in the regional electric bus ecosystem. The development of supporting infrastructure, including charging stations and maintenance facilities, continues to evolve in parallel with fleet expansion plans.
North America Electric Bus Market in Other Countries
The broader North American electric bus market encompasses various territories and regions beyond the major markets, each with its unique characteristics and development trajectories. These areas are witnessing growing interest in electric bus adoption, driven by a combination of environmental regulations, operational cost benefits, and increasing public demand for sustainable transportation solutions. Local governments and transit authorities in these regions are developing tailored approaches to fleet electrification, considering their specific geographical, climatic, and operational requirements. The market in these areas is characterized by pilot projects and gradual fleet transitions, supported by various funding mechanisms and technical assistance programs. The development of charging infrastructure and maintenance capabilities in these regions is progressing in tandem with fleet electrification plans, creating opportunities for both established players and new entrants in the electric bus ecosystem.

Competitive Landscape
Top Companies in North America Electric Bus Market
The electric bus market in North America is witnessing significant transformation through various strategic initiatives by key players. Manufacturers are increasingly focusing on technological innovation, particularly in battery technology and charging infrastructure development, to enhance vehicle performance and operational efficiency. Electric bus companies are demonstrating operational agility by establishing new manufacturing facilities and expanding their production capabilities to meet growing demand. Strategic partnerships and collaborations, especially between OEMs and technology providers, are becoming increasingly common to accelerate product development and market penetration. Market leaders are also investing heavily in research and development to improve battery capacity, range, and charging solutions while simultaneously expanding their service networks across the region. These electric bus companies are actively pursuing government contracts and transit authority partnerships, while also developing comprehensive after-sales support systems to strengthen their market positions.
Market Dominated by Established Global Players
The North American electric bus market exhibits a highly consolidated structure, with major global players holding significant market share. The competitive landscape is characterized by a mix of established automotive conglomerates and specialized electric bus manufacturers, each leveraging their unique strengths to capture market opportunities. Traditional bus manufacturers have successfully pivoted towards electric mobility through strategic acquisitions and internal development programs, while pure-play electric vehicle companies have carved out their niches through technological innovation and specialized product offerings. The market has witnessed several strategic partnerships and joint ventures, particularly between vehicle manufacturers and battery technology providers, aimed at strengthening competitive positions and expanding market reach.
The industry is experiencing a wave of consolidation through mergers and acquisitions, as companies seek to combine complementary capabilities and achieve economies of scale. Major players are actively pursuing vertical integration strategies, particularly in critical components like battery systems and charging infrastructure, to maintain competitive advantages and control over the value chain. The market is also seeing increased participation from international players, especially from Asia and Europe, who are establishing local manufacturing facilities and forming strategic alliances with regional partners to strengthen their presence in the North American market.
Innovation and Sustainability Drive Future Success
Success in the North American electric bus market increasingly depends on companies' ability to innovate while maintaining cost competitiveness. Incumbent players must focus on developing advanced battery technologies, improving vehicle range, and enhancing charging infrastructure to maintain their market positions. Companies need to establish strong relationships with transit authorities and leverage government incentives while building robust supply chains to ensure consistent production and delivery capabilities. The ability to provide comprehensive fleet management solutions, including maintenance services and charging infrastructure, will become increasingly crucial for market success. Manufacturers must also focus on localizing production and developing strong dealer networks to provide better after-sales support and maintain customer relationships.
For emerging players and contenders, success lies in identifying and exploiting specific market niches while building strong technological capabilities. Companies must focus on developing innovative financing solutions to help transit authorities overcome the higher initial costs of electric buses. The ability to provide customized solutions for specific route requirements and operating conditions will become increasingly important. Future success will also depend on companies' ability to navigate evolving regulations and environmental standards while maintaining operational efficiency. Building strong partnerships with charging infrastructure providers and battery manufacturers will be crucial for new entrants to establish themselves in the market. Additionally, companies must invest in developing comprehensive training programs for operators and maintenance staff to ensure successful fleet electrification.
North America Electric Bus Industry Leaders
BYD Auto Co. Ltd.
GreenPower Motor Company Inc.
Lion Electric Company
NFI Group Inc.
Proterra INC.
- *Disclaimer: Major Players sorted in no particular order


Recent Industry Developments
- September 2023: PSTA awarded USD18 million for electric buses. PSTA will use these funds to purchase 60 Gillig all-electric buses over the next five years, which was approved by the board of directors in December 2021.
- September 2023: Daimler Buses launched the next generation Setra TopClass and ComfortClass touring coaches that meet the highest standards of safety, economy, and flexibility.
- September 2023: Volvo Energy signed a letter of intent with Connected Energy with the ambition to jointly develop a battery energy storage system (BESS).


North America Electric Bus Market Report Scope
BEV, FCEV, HEV are covered as segments by Fuel Category. Canada, Mexico, US are covered as segments by Country.Fuel Category
| BEV |
| FCEV |
| HEV |
Country
| Canada |
| Mexico |
| US |
| Fuel Category | BEV |
| FCEV | |
| HEV | |
| Country | Canada |
| Mexico | |
| US |


Market Definition
- Vehicle Type - The category includes Medium and Heavy Duty Buses.
- Vehicle Body Type - This include Bus category.
- Fuel Category - The category exclusively covers electric propulsion systems, including various types such as HEV (Hybrid Electric Vehicles), PHEV (Plug-in Hybrid Electric Vehicles), BEV (Battery Electric Vehicles), and FCEV (Fuel Cell Electric Vehicles).
| Keyword | Definition |
|---|---|
| Electric Vehicle (EV) | A vehicle which uses one or more electric motors for propulsion. Includes cars, buses, and trucks. This term includes all-electric vehicles or battery electric vehicles and plug-in hybrid electric vehicles. |
| BEV | A BEV relies completely on a battery and a motor for propulsion. The battery in the vehicle must be charged by plugging it into an outlet or public charging station. BEVs do not have an ICE and hence are pollution-free. They have a low cost of operation and reduced engine noise as compared to conventional fuel engines. However, they have a shorter range and higher prices than their equivalent gasoline models. |
| PEV | A plug-in electric vehicle is an electric vehicle that can be externally charged and generally includes all-electric vehicles as well as plug-in hybrids. |
| Plug-in Hybrid EV | A vehicle that can be powered either by an ICE or an electric motor. In contrast to normal hybrid EVs, they can be charged externally. |
| Internal combustion engine | An engine in which the burning of fuels occurs in a confined space called a combustion chamber. Usually run with gasoline/petrol or diesel. |
| Hybrid EV | A vehicle powered by an ICE in combination with one or more electric motors that use energy stored in batteries. These are continually recharged with power from the ICE and regenerative braking. |
| Commercial Vehicles | Commercial vehicles are motorized road vehicles designed for transporting people or goods. The category includes light commercial vehicles (LCVs) and medium and heavy-duty vehicles (M&HCV). |
| Passenger Vehicles | Passenger cars are electric motor– or engine-driven vehicles with at least four wheels. These vehicles are used for the transport of passengers and comprise no more than eight seats in addition to the driver’s seat. |
| Light Commercial Vehicles | Commercial vehicles that weigh less than 6,000 lb (Class 1) and in the range of 6,001–10,000 lb (Class 2) are covered under this category. |
| M&HDT | Commercial vehicles that weigh in the range of 10,001–14,000 lb (Class 3), 14,001–16,000 lb (Class 4), 16,001–19,500 lb (Class 5), 19,501–26,000 lb (Class 6), 26,001–33,000 lb (Class 7) and above 33,001 lb (Class 8) are covered under this category. |
| Bus | A mode of transportation that typically refers to a large vehicle designed to carry passengers over long distances. This includes transit bus, school bus, shuttle bus, and trolleybuses. |
| Diesel | It includes vehicles that use diesel as their primary fuel. A diesel engine vehicle have a compression-ignited injection system rather than the spark-ignited system used by most gasoline vehicles. In such vehicles, fuel is injected into the combustion chamber and ignited by the high temperature achieved when gas is greatly compressed. |
| Gasoline | It includes vehicles that use gas/petrol as their primary fuel. A gasoline car typically uses a spark-ignited internal combustion engine. In such vehicles, fuel is injected into either the intake manifold or the combustion chamber, where it is combined with air, and the air/fuel mixture is ignited by the spark from a spark plug. |
| LPG | It includes vehicles that use LPG as their primary fuel. Both dedicated and bi-fuel LPG vehicles are considered under the scope of the study. |
| CNG | It includes vehicles that use CNG as their primary fuel. These are vehicles that operate like gasoline-powered vehicles with spark-ignited internal combustion engines. |
| HEV | All the electric vehicles that use batteries and an internal combustion engine (ICE) as their primary source for propulsion are considered under this category. HEVs generally use a diesel-electric powertrain and are also known as hybrid diesel-electric vehicles. An HEV converts the vehicle momentum (kinetic energy) into electricity that recharges the battery when the vehicle slows down or stops. The battery of HEV cannot be charged using plug-in devices. |
| PHEV | PHEVs are powered by a battery as well as an ICE. The battery can be charged through either regenerative breaking using the ICE or by plugging into some external charging source. PHEVs have a better range than BEVs but are comparatively less eco-friendly. |
| Hatchback | These are compact-sized cars with a hatch-type door provided at the rear end. |
| Sedan | These are usually two- or four-door passenger cars, with a separate area provided at the rear end for luggage. |
| SUV | Popularly known as SUVs, these cars come with four-wheel drive, and usually have high ground clearance. These cars can also be used as off-road vehicles. |
| MPV | These are multi-purpose vehicles (also called minivans) designed to carry a larger number of passengers. They carry between five and seven people and have room for luggage too. They are usually taller than the average family saloon car, to provide greater headroom and ease of access, and they are usually front-wheel drive. |


Research Methodology
Mordor Intelligence follows a four-step methodology in all its reports.
- Step-1: Identify Key Variables: To build a robust forecasting methodology, the variables and factors identified in Step-1 are tested against available historical market numbers. Through an iterative process, the variables required for market forecast are set and the model is built based on these variables.
- Step-2: Build a Market Model: Market-size estimations for the historical and forecast years have been provided in revenue and volume terms. Market revenue is calculated by multiplying the sales volume with their respective average selling price (ASP). While estimating ASP factors like average inflation, market demand shift, manufacturing cost, technological advancement, and varying consumer preference, among others have been taken into account.
- Step-3: Validate and Finalize: In this important step, all market numbers, variables, and analyst calls are validated through an extensive network of primary research experts from the market studied. The respondents are selected across levels and functions to generate a holistic picture of the market studied.
- Step-4: Research Outputs: Syndicated Reports, Custom Consulting Assignments, Databases & Subscription Platforms.


