
Iris Recognition Market Size and Share
Market Overview
| Study Period | 2021 - 2031 |
|---|---|
| Market Size (2026) | USD 6.15 Billion |
| Market Size (2031) | USD 15.09 Billion |
| Growth Rate (2026 - 2031) | 19.68 % |
| Fastest Growing Market | Middle East and Africa |
| Largest Market | North America |
| Market Concentration | Medium |
Major Players
*Disclaimer: Major Players sorted in no particular order Image © Mordor Intelligence. Reuse requires attribution under CC BY 4.0. |
|
Iris Recognition Market Analysis by Mordor Intelligence
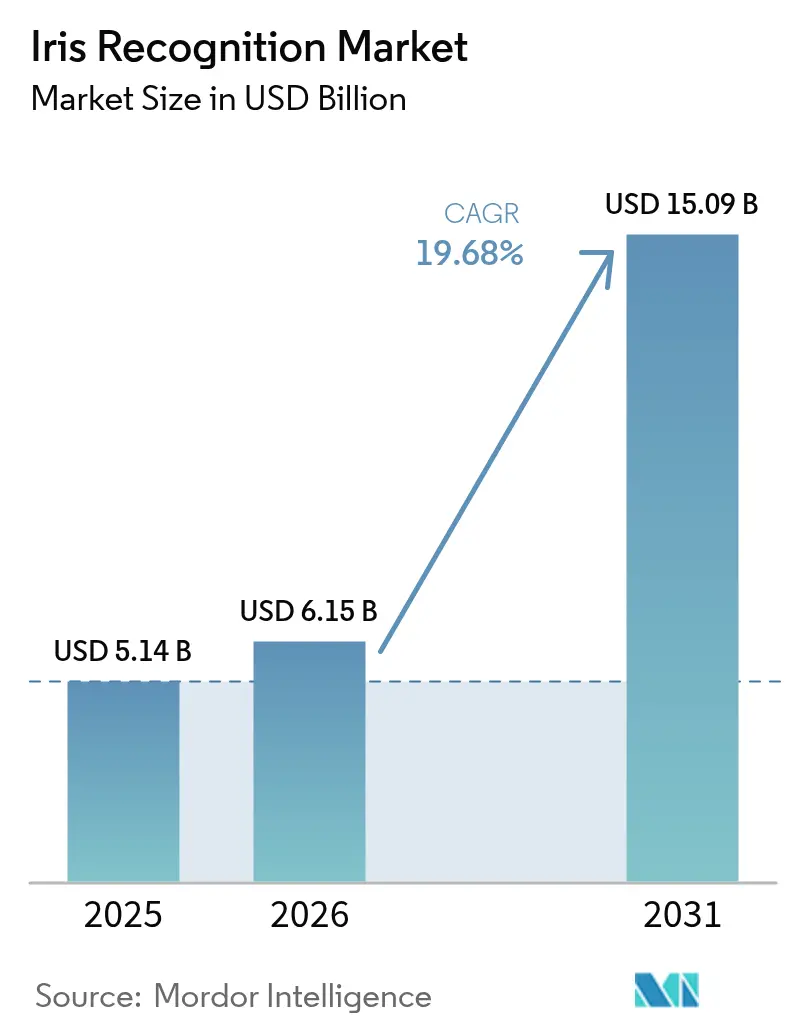
The iris recognition market size is expected to grow from USD 5.14 billion in 2025 to USD 6.15 billion in 2026 and is forecast to reach USD 15.09 billion by 2031 at 19.68% CAGR over 2026-2031. This robust trajectory shows how the technology has moved beyond niche government deployments into everyday consumer environments. Heightened demand for contact-free authentication, rising cyber-threat exposure, and stronger compliance expectations from regulators have all accelerated adoption across banking, healthcare, travel, and consumer electronics. Hardware remains the largest cost center, yet software gains more strategic weight as cloud-native matching engines improve speed and lower entry barriers for mid-sized buyers. Asia-Pacific commands an early-mover advantage through scaled national identity programs, while the Middle East delivers the fastest CAGR on the back of airport modernization and tourism facilitation mandates. Intensifying competition now revolves around algorithmic accuracy, multimodal integration, and privacy-centric design features that can withstand evolving data-sovereignty rules.
Key Report Takeaways
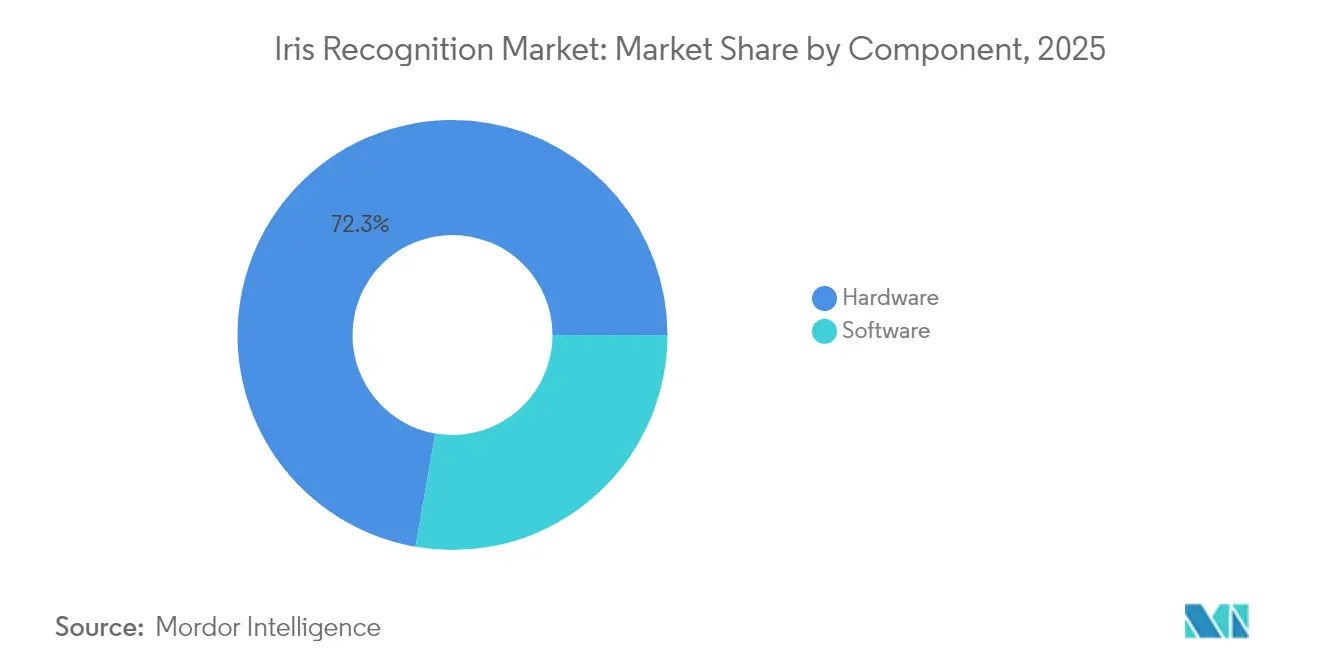
- By component, hardware captured 72.25% of iris recognition market share in 2025, while software is projected to log the highest growth at a 22.05% CAGR to 2031.
- By authentication mode, 1:N identification held 65.70% of the iris recognition market size in 2025; the 1:1 mode is set to grow the fastest at 20.15% CAGR through 2031.
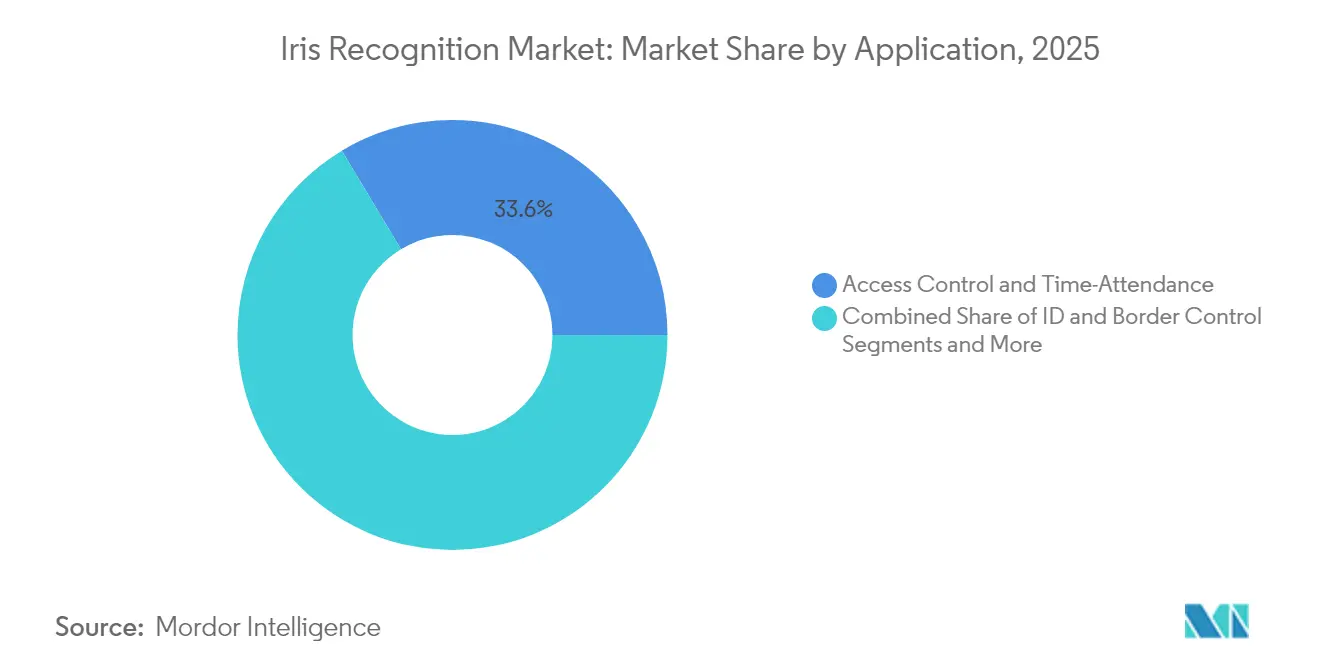
- By application, access control led with 33.60% revenue share in 2025, whereas transaction and payment authentication is forecast to advance at 22.6% CAGR between 2026-2031.
- By end-user industry, government and law enforcement dominated with 41.40% iris recognition market share in 2025; consumer electronics is poised for the quickest rise at 21.1% CAGR out to 2031.
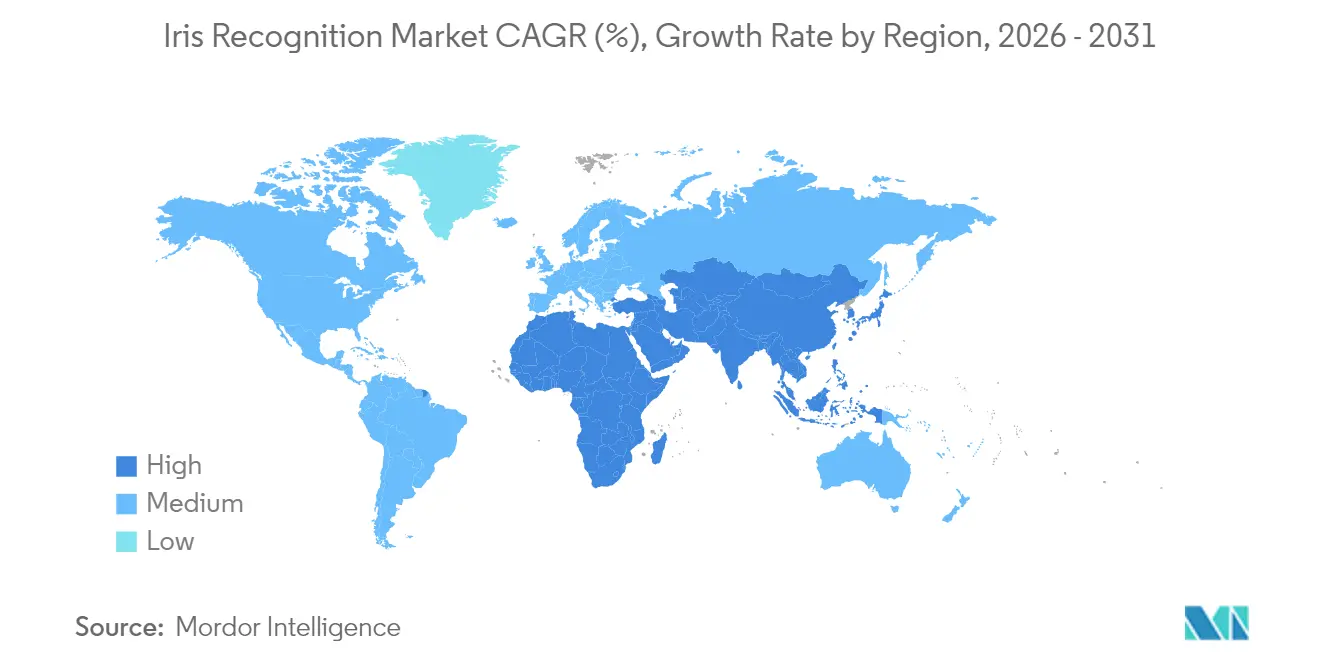
- By geography, Asia-Pacific accounted for 35.60% of global revenue in 2025, while the Middle East is projected to register a 20.75% CAGR through 2031.
Note: Market size and forecast figures in this report are generated using Mordor Intelligence’s proprietary estimation framework, updated with the latest available data and insights as of 2026.
Market Trends and Insights
Drivers Impact Analysis of Iris Recognition Market*
| Driver | (~) % Impact on CAGR Forecast | Geographic Relevance | Impact Timeline |
|---|---|---|---|
| Growing National-ID & e-Passport Programs in Asia | +3.2% | Asia-Pacific, with spillover to MEA | Medium term (2-4 years) |
| Rising Border-Control spending across Middle-East corridors | +2.8% | Middle East, North Africa | Short term (≤ 2 years) |
| Smartphone OEM Adoption of On-Device Iris Sensors (India & China) | +4.1% | Asia-Pacific core markets | Medium term (2-4 years) |
| Expansion of Contactless Patient ID mandates in U.S. Healthcare | +2.3% | North America | Long term (≥ 4 years) |
| EU Digital Wallet Initiatives accelerating e-KYC demand | +1.9% | Europe | Medium term (2-4 years) |
| Cross-Border Money-laundering Compliance in BFSI (Europe & MEA) | +2.1% | Europe, Middle East, Africa | Long term (≥ 4 years) |
| Source: Mordor Intelligence | |||


Growing National-ID & e-Passport Programs in Asia
Asia-Pacific governments keep scaling iris-enabled digital identity platforms to streamline public-service delivery and financial inclusion. India’s DigiLocker upgrade now allows corporate entities to verify staff credentials through the Aadhaar database, widening the addressable base beyond individual citizens.[1]University of Cambridge, “REF Case study search,” impact.ref.ac.ukThailand’s public-health authorities have introduced multimodal enrolment kiosks for migrant workers, linking iris scans to vaccination and benefits eligibility. Optical module costs have fallen toward single-digit USD levels in high-volume production, giving budget-constrained agencies an entry point. As enrollment momentum continues, vendors see durable revenue from maintenance contracts and periodic sensor refresh cycles that follow increased performance standards.
Rising Border-Control Spending Across Middle-East Corridors
Gulf states deploy iris recognition at scale to balance security thresholds with passenger-flow targets in flagship airports. The UAE’s eGate program, delivered with IDEMIA, employs iris-at-distance capture to process residents and visitors without touching immigration counters. Saudi Arabia’s Vision 2030 task force mandates multimodal biometrics for all new terminals, prompting suppliers such as Invixium to commit to local assembly lines for quicker customization. The resulting procurement pipeline favors high-throughput scanners and cloud-ready matching engines that can clear several thousand travelers per hour while logging audit-grade evidence for immigration officials.
Smartphone OEM Adoption of On-Device Iris Sensors
Handset makers target high-density markets by embedding miniaturized iris modules next to selfie cameras. Recent laboratory work shows 96.57% true-acceptance for visible-light capture on commodity phone optics, easing the need for dedicated infrared emitters. [2]arXiv, “Smartphone-based Iris Recognition,” arxiv.org Indian banking rules now permit face or iris verification for select transactions, which pushes handset brands to secure certification under local e-KYC guidelines. Cost reduction stems from integrating the imager within existing camera islands and re-using neural processing units for matching, letting OEMs position iris unlock as a premium privacy feature without large bill-of-materials hikes.
Expansion of Contactless Patient-ID Mandates in U.S. Healthcare
Provider groups invest in iris-based positive patient identification to curb record duplication and medical fraud. Texas Department of Public Safety expanded its contract for Iris ID terminals to accelerate real-time livescan matching across 200 additional sites. Hospitals deploy mobile kiosks that pair an iris template with electronic medical record numbers, creating an immutable link that survives name changes or fingerprint wear. The approach fits infection-control protocols because the patient never touches a device, thereby lowering cleaning cycles and staff workload.
Restraints Impact Analysis of Iris Recognition Market*
| Restraint | (~) % Impact on CAGR Forecast | Geographic Relevance | Impact Timeline |
|---|---|---|---|
| High CAPEX of Multimodal Biometric Hubs at Airports | -1.8% | Global, concentrated in major aviation hubs | Short term (≤ 2 years) |
| Accuracy Degradation under Non-cooperative Capture Scenarios | -1.4% | Global | Medium term (2-4 years) |
| Data-sovereignty & Biometric-template Storage Regulations (EU GDPR) | -2.1% | Europe, with global compliance spillover | Long term (≥ 4 years) |
| Public Perception & Civil-liberties Backlash in North America | -1.6% | North America | Medium term (2-4 years) |
| Source: Mordor Intelligence | |||
High CAPEX of Multimodal Biometric Hubs at Airports
Airports face steep upfront costs when retrofitting existing checkpoints with multimodal pods that include iris, face, and fingerprint options. U.S. Transportation Security Administration trials show passenger throughput gains yet require specialized lanes, LED-safe lighting, and dedicated fiber backhauls to central matching engines. Smaller regional airports postpone rollouts until passenger volumes justify the payback, creating a two-tier adoption curve that suppliers must navigate with modular, pay-per-use pricing models.
Data-Sovereignty & Biometric-Template Storage Regulations (EU GDPR)
Europe’s GDPR treats biometric patterns as special-category data, forcing system integrators to obtain explicit consent or prove substantial public interest before processing. The forthcoming EU AI Act adds an extra layer of classification, tagging certain remote identification setups as high risk and requiring detailed conformity assessments. [3]IAPP, "Biometrics in the EU: Navigating the GDPR, AI Act," iapp.org Vendors respond by embedding homomorphic encryption and zero-knowledge proofs in matching pipelines, but the additional compute overhead can erode response times for large gallery checks. Compliance engineering, therefore, becomes a core differentiator, not an ancillary box-tick.
*Our forecasts treat driver/restraint impacts as directional, not additive. The impact forecasts reflect baseline growth, mix effects, and variable interactions.
Iris Recognition Market Segment Analysis
By Component:
Hardware Dominance Drives Infrastructure InvestmentHardware accounted for 72.25% of 2025 revenue and continues to anchor the iris recognition market, given the need for precision optics, controlled illumination, and rugged housings. Growth, however, shifts toward software as cloud inference engines raise recognition speeds and enable agile feature updates without forklift replacements. System operators report average upgrade cycles of four to five years for cameras, yet deploy quarterly algorithm patches to improve accuracy against evolving demographic mixes.
Software’s 22.05% CAGR from 2026-2031 underscores the pivot from capital expenditure to subscription models, letting smaller enterprises trial enterprise-grade accuracy through pay-as-you-go APIs. The layered architecture supports quick rollouts when new privacy mandates emerge, a factor that materially influences procurement committees in health and finance. In parallel, component suppliers miniaturize infrared LED arrays and apply automotive-grade temperature ratings, expanding outdoor deployment windows where lighting is unpredictable. Open-API lenses invite cross-modality fusion, letting operators stream both iris and face images from a single sensor to common back ends.


By Authentication Mode:
Large-Scale Identification Systems Lead AdoptionThe 1:N mode represented 65.70% iris recognition market size in 2025, supported by border-control, voter registry, and welfare-benefit rollouts requiring one-to-many searches against multimillion-record galleries. Governments reserve significant compute budgets for peak travel seasons, validating the architecture’s resilience for concurrent queries.
Over the next five years, 1:1 verification is expected to record a 20.15% CAGR as corporates and mobile-wallet providers focus on rapid user validation rather than exhaustive de-duplication. The convenience angle resonates where latency must stay below 250 milliseconds to avoid checkout abandonment. Early adopter banks in Europe now pair iris scans with dynamic QR tokens to bind the transaction session, reducing phishing risk without noticeable user friction. As these point solutions scale, they feed data back into adaptive thresholding engines that improve false-accept/false-reject balances across culturally diverse user cohorts.
By Application:
Access Control Foundation Enables Payment InnovationAccess control retained a 33.60% share of the iris recognition market in 2025, forming the baseline use case across power plants, data centers, and public-sector offices. Turnstile integrators value iris scans for their hygiene and high throughput, especially where gloves or masks impede fingerprints and faces. The segment’s locked-in hardware footprint offers predictable replacement revenue for lens upgrades and wider-angle imagers that accelerate group entry.
Payment authentication shows the highest momentum with a 22.6% CAGR forecast between 2026-2031 as financial institutions embed iris recognition into teller stations, ATMs, and mobile wallets. A leading Indian private bank deployed iris-verified “tap-and-go” kiosks in Tier-2 cities to meet Reserve Bank of India’s stricter KYC revision, reducing manual form-filling time by 65%. The cross-border remittance market, meanwhile, explores iris tokens that avoid insecure SMS codes, aiming to attract unbanked migrants wary of traditional paperwork. These developments position iris verification as a competitive differentiator rather than a backdrop utility.
By End-user Industry:
Government Leadership Enables Commercial ExpansionPublic-sector projects delivered 41.40% iris recognition market share in 2025, establishing foundational databases and technical standards. Law-enforcement agencies increasingly link mug-shot galleries with iris vectors to accelerate suspect identification, driving procurement of live-capture terminals such as Iris ID’s iCAM TD100A units in Texas. Military programs, although smaller in unit count, demand ruggedized kits and encrypted satellite uplinks, stretching suppliers into high-spec engineering niches.
Commercial momentum now shifts toward consumer electronics, forecast to grow 21.1% CAGR as smartphone makers in China and India bundle iris unlock with digital-wallet payment flows. Automotive OEMs also invest: Fingerprint Cards granted Smart Eye a SEK 50 million licence for cabin-focused iris modules that personalize seat position and climate presets. Healthcare administrators integrate bedside tablets with iris login to cut misidentification incidents, further broadening the technology’s vertical footprint. These overlapping use cases diversify revenue away from politically dependent government budgeting cycles and mitigate policy change risk.
Geography Analysis
APAC Iris Recognition Market
Asia-Pacific held 35.60% of global revenue in 2025, underpinned by India’s Aadhaar enrollment of over 1.2 billion citizens and rapid smartphone penetration that normalizes biometric interactions. Chinese handset vendors bundle iris unlock in flagship models to underpin Alipay and WeChat Pay transfers, while Japan’s NEC commercializes its Bio-IDiom suite across transportation and retail self-checkout lanes. Regulatory clarity, strong mobile data coverage, and price-sensitive yet tech-savvy consumers create a fertile setting for sustained installation growth.
Middle East Iris Recognition Market
The Middle East records the fastest trajectory at 20.75% CAGR through 2031, fueled by Gulf airports’ shift to seamless passenger corridors and national digital-ID roadmaps. The UAE’s decision to retire physical Emirates ID cards in favor of a facial-and-iris credential highlights the policy's will to leapfrog legacy cards. Saudi Arabia’s localization drives push vendors to co-manufacture scanners, positioning the region as both a demand hub and a production base.
Europe and North America Iris Recognition Market
Europe and North America display mature yet policy-shaped demand curves. GDPR obligations force privacy-by-design architectures, prompting greater investment in in-country cloud nodes and encryption overlays. The U.S. market banks on federal funding to update border checkpoints and aviation hubs, with Customs and Border Protection extending iris capture pilots to additional crossings. Civil-liberties groups monitor deployments, so accurate liveness detection and transparent audit trails are critical to winning public acceptance.

Regulatory Landscape
Iris recognition deployments are shaped by privacy rules and technical standards that increasingly function as procurement gates. In Europe, GDPR treatment of biometrics as special-category data requires explicit consent or a substantial public-interest basis for processing, while the forthcoming EU AI Act adds conformity expectations for certain remote identification uses. This combination is pushing vendors toward privacy-by-design architectures and stronger auditability.
On the assurance side, standards and independent evaluations are also influencing system design choices across borders. ISO/IEC 39794-6 (iris image data interchange) and image-quality guidance referenced by OSAC 2024-N-0004 (issued November 2024) anchor capture and interoperability for government and forensic-grade programs. ISO/IEC 19792:2025 (published June 2025) adds security evaluation requirements for biometric systems, and NIST programs such as IREX 10 serve as a widely watched benchmark for one-to-many performance that agencies use to qualify vendors for large-scale identity and border use cases.
Value Chain Analysis
The iris recognition value chain begins with upstream semiconductor and optics suppliers providing image sensors, near-infrared illumination, and lens assemblies, followed by device OEMs building scanners, cameras, and rugged capture terminals. Midstream, algorithm developers and SDK providers deliver segmentation, liveness, matching, and quality scoring, with performance increasingly validated through programs such as NIST IREX 10. Downstream, system integrators package these components into end-to-end solutions for access control, national ID enrollment, border gates, healthcare patient identification, and BFSI e-KYC, typically bundling installation, workflow integration, and multi-year support.
Interoperability and conformance requirements shape value capture across the chain, particularly for government and airport projects. Standards such as ISO/IEC 39794-6 (data formats) and related quality and conformance frameworks influence sensor selection, capture configuration, and template exchange across heterogeneous fleets. The market also shows a pull toward multimodal deployments where iris is paired with face and/or fingerprint (for example, airport and high-throughput checkpoints), which increases the role of integrators and platform vendors that can orchestrate multiple modalities across edge devices and centralized matching infrastructure.
Competitive Landscape
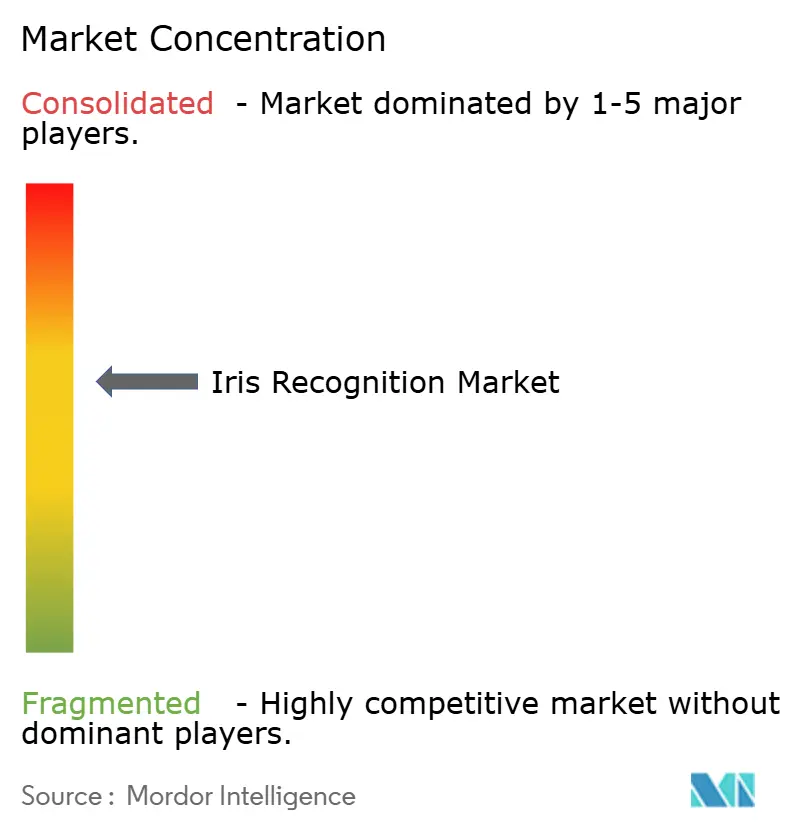
The competitive map remains moderately concentrated, with long-established players such as NEC, IDEMIA, and Thales leveraging extensive patent portfolios and benchmark-leading accuracy. NEC achieved a 99.33% rank-one match in the latest NIST evaluation, reinforcing its premium pricing power for high-throughput government contracts. IDEMIA scored top marks for fairness and liveness in the U.S. Department of Homeland Security’s 2025 RIVTD test, a credential likely to influence forthcoming federal bids.
Mid-tier challengers differentiate through cloud-native SDKs and open-architecture APIs that allow quick stack integration. Fingerprint Cards’ out-licensing to Smart Eye illustrates how IP holders target adjacent sectors through royalty-bearing partnerships rather than direct hardware sales. Start-ups often pursue niche analytics such as iris-based emotion inference, though pending EU AI regulations may narrow acceptable use cases.
Strategically, vendors converge on three priorities: (1) multimodal fusion that blends iris with face or voice to meet flexible risk tolerances; (2) edge-optimized compression to push matching onto mobile silicon and cut latency; and (3) privacy engineering to address sovereign-cloud mandates. Deal structures increasingly feature “algorithm-as-a-service” contracts, shifting revenue into recurring streams and lowering the buyer’s capital load. As these models scale, traditional box sellers must recast go-to-market tactics to protect share.
Iris Recognition Industry Leaders
-
Iris ID Inc.
-
Gemalto NV (Thales Group)
-
Iritech Inc.
-
NEC Corporation
-
HID Global
- *Disclaimer: Major Players sorted in no particular order
Iris Recognition Market Companies Covered in this Report
- NEC Corporation
- IDEMIA
- HID Global (ASSA ABLOY)
- Thales Group (Gemalto)
- Iris ID Inc.
- IriTech Inc.
- EyeLock LLC
- Princeton Identity Inc.
- BioEnable Technologies Pvt. Ltd.
- IrisGuard UK Ltd.
- Aware Inc.
- Vision-Box
- DERMALOG Identification Systems
- Cognitec Systems GmbH
- Smartmatic
- Samsung Electronics Co., Ltd.
- Fujitsu Limited
- CLEAR Inc.
- CMITech Company Ltd.
- SRI International

Market Opportunities and Future Outlook
National ID and digital public infrastructure programs keep opening large, repeatable demand pools for iris enrollment and de-duplication, particularly where beneficiaries, migrants, or remote populations require higher identity assurance than document checks alone. Recent implementations illustrate this whitespace: Uganda NIRA deployed 5,665 upgraded biometric registration kits featuring IriShield BK binocular scanners for its national ID campaign (March 2026), and Ethiopia selected IriTech as a core iris technology provider for the World Bank-funded Fayda Digital ID program (announced September 2025). These deployments also create follow-on needs for lifecycle services such as device refresh, field maintenance, template quality upgrades, and interoperability across agencies and partners.
Airports and cross-border checkpoints remain a separate commercialization track, with a focus on frictionless journeys and multimodal fusion rather than iris-only lanes. Macao SAR extended iris automated clearance services to additional non-resident cohorts at multiple checkpoints, including the Hong Kong-Zhuhai-Macao Bridge (June 2026). Vendors are also productizing longer-range and combined modalities for throughput and convenience, including Smart Eye and Fingerprint Cards developing a system integrating face and iris for simultaneous authentication at distances up to 3 meters (March 2026). In parallel, standards- and benchmarking-driven procurement, supported by improvements demonstrated in NIST IREX 10 and ecosystem readiness (for example, MOSIP certification completed by Idbio in April 2026), can reduce integration risk for government buyers and broaden the addressable market for software-centric matching engines and compliance-grade deployments.
Recent Industry Developments in Iris Recognition Market
- May 2026: Neurotechnology announced its algorithm achieved top ranking across all four accuracy metrics in the NIST IREX 10 ongoing evaluation, using a dataset reported as 1 million images from 500,000 individuals. Strong performance in a government-run benchmark supports vendor shortlisting for large-scale 1:N programs where independent testing is used as a procurement filter.
- April 2026: Thales highlighted that its Fly to Gate AI-powered biometric solution is equipped at more than 600 airport touchpoints, supporting touchless passenger flows with options that include iris-capable modalities. The scale of deployed touchpoints reinforces the move toward integrated, multimodal airport platforms that pull demand through for compatible capture devices and matching software.
- November 2024: OSAC issued 2024-N-0004, a standard guide for capturing near-infrared iris images (700 nm to 900 nm) that references ISO/IEC 29794-6 image quality compliance. Updated capture guidance influences device configuration and quality management in forensic and high-assurance identity workflows, shaping how suppliers design sensors and how integrators validate deployments.


Iris Recognition Market Report Scope and Research Methodology
Market Definition and Coverage
This market is counted as the revenue generated from iris recognition solutions used to identify or verify people, across devices, software platforms, and related deployments where the iris is the biometric trait being captured and matched.
Scope exclusions: We exclude broader identity programs and physical security spending that does not specifically use iris capture and matching, even if it sits in the same project budget.
Segments Covered in This Report
-
By Component
-
Hardware
- Iris Scanners
- Cameras
- Integrated Iris-Recognition Systems
- Other Optical Modules and Illumination
-
Software
- Stand-alone Matching Engines
- SDKs and Middleware
- Cloud-based Platforms
-
Hardware
-
By Authentication Mode
- 1:1 Verification
- 1:N Identification
-
By Application
- Access Control and Time-Attendance
- ID and Border Control
- Transaction and Payment Authentication
- Patient Identification and EMR Linkage
- Others (KYC, Surveillance, Automotive Infotainment)
-
By End-user Industry
- Government and Law-Enforcement
- Banking, Financial Services and Insurance (BFSI)
- Healthcare and Life Sciences
- Consumer Electronics
- Military and Defense
- Travel and Immigration
- Commercial and Enterprise
- Others (Education, Automotive OEMs)
-
By Geography
-
North America
- United States
- Canada
- Mexico
-
South America
- Brazil
- Argentina
- Rest of South America
-
Europe
- United Kingdom
- Germany
- France
- Italy
- Spain
- Rest of Europe
-
Asia Pacific
- China
- Japan
- South Korea
- India
- Singapore
- Australia
- New Zealand
- Rest of Asia Pacific
-
Middle East and Africa
-
Middle East
- Saudi Arabia
- United Arab Emirates
- Turkey
- Rest of Middle East
-
Africa
- South Africa
- Nigeria
- Kenya
- Rest of Africa
-
Middle East
-
North America
Data Sources, Market Sizing, and Validation
Desk Research
Desk research was used to build the first structure of the market and to anchor assumptions that can be checked repeatedly over time. We relied on public sources such as national ID and border-management program disclosures, standards and guidance from bodies such as NIST, cybersecurity and digital ID publications from agencies such as DHS, and immigration and travel statistics from sources such as UNWTO and the World Bank.
To make the inputs more realistic, we also reviewed company filings, investor presentations, product documentation, and credible press coverage tied to deployments, procurement cycles, and pricing shifts. In a few areas, paid subscriptions were used for company financials and intelligence, patent databases, and global contracts and tenders to cross-check supplier activity and demand signals. The sources listed here are illustrative only, and many other public references were also used to collect, validate, and clarify the analysis.
Primary Interviews and Surveys
Primary work focused on validating what is really being shipped and deployed, and then aligning the model to typical buying patterns across government ID, border control, BFSI onboarding, healthcare patient identification, and enterprise access control. We spoke with a mix of solution providers, component makers, system integrators, and end-user teams across major regions so that uncertain inputs like average selling prices, replacement cycles, and adoption constraints could be tightened before finalizing totals.
Distribution of primary research fieldwork respondents
| Company type | Respondent position | Region |
|---|---|---|
| Top tier: 27% | CXOs: 17% | APAC: 37% |
| Mid tier: 52% | Functional/Unit leaders: 26% | EMEA: 36% |
| Smaller Players: 21% | Managers: 57% | Americas: 27% |
Market-Sizing & Forecasting
Sizing starts with a top-down build where program rollouts and deployment intensity are reconstructed from public project disclosures, travel and border volumes, device penetration in targeted use cases, and the typical attach rate of iris as an authentication option. Those demand pools are then translated into value using market-consistent price ranges for cameras or scanners, software licenses, and ongoing platform fees, before regional totals are formed.
To keep the estimate grounded, we also run selective bottom-up checks using sampled supplier revenue exposure to iris, channel and integrator feedback, and simple unit-by-ASP approximations for high-volume deployments. Key inputs we track include deployment counts by use case, refresh and replacement cycles, share of contactless modalities in new tenders, software pricing progression (license versus subscription), and local currency movements where procurement is not USD denominated. For forecasting, scenario analysis is used alongside a light multivariate regression that ties adoption to indicators like cross-border passenger recovery, digital ID investments, and regulatory pressure on strong identity proofing, and then assumptions are refined based on what interviewees expect in near-term budgets.
Data Validation & Update Cycle
Outputs are cross-checked against independent signals such as tender volumes, patenting activity direction, and observable deployment announcements, and then variances are reviewed until the drivers are understood. If a region or use case shows an unusual jump, the inputs are re-tested and a small set of respondents are re-contacted to confirm whether it is a real shift or a timing issue.
Before release, the model and write-up go through multiple analyst reviews, including sense checks at segment and regional levels and consistency checks across years. Reports are refreshed annually, and interim updates are made when material events happen such as policy changes, major contract wins, or step-changes in device pricing, followed by a final pre-delivery review so clients receive the most current view.
Mordor Intelligence's Iris Recognition Market Size Measured Against Other Published Estimates
Published market sizes for iris recognition often differ because analysts do not treat timing and pricing in the same way, even when they appear to track similar use cases. The spread usually comes from how quickly new deployments are assumed to ramp, what gets counted as recurring software revenue, and the year when currency conversions are locked.
In this study, the main gap drivers are practical ones, including whether a source folds in adjacent biometrics budgets, whether ASPs are kept flat or stepped down as camera modules scale, and whether government program revenue is recognized when contracts are awarded or when systems go live. A refresh-led model also matters because tender pipelines and device pricing can shift within a year, which moves the current-year value more than the long-run CAGR.
Benchmark comparison
| Source | Market Size | Gaps in Research Methodology |
|---|---|---|
| Mordor Intelligence | USD 6.15 B (2026) | |
| Global Research Publisher A | USD 9.91 B (2024) | Uses an earlier base year and a broader revenue capture that can pull forward program value, and it may apply faster ASP expansion into 2025 that is not fully tied to observed tender timelines. |
| Industry Research Publisher B | USD 4.04 B (2024) | Carries a longer forecast window and tends to keep adoption and pricing more conservative, which can undercount near-term ramp in large government and travel deployments and delay software monetization. |
The table shows that timing choices and pricing progression explain a large part of the difference across published figures. By locking currency conversion to a consistent rate window, rechecking ASP steps with integrator feedback, and refreshing tender and deployment assumptions closer to the base year, Mordor Intelligence reduces drift that can come from stale inputs and mixed revenue-recognition timing.


Key Questions Answered in the Report
What is the current value of the iris recognition market?
The iris recognition market size is USD 6.15 billion in 2026 and is projected to reach USD 15.09 billion by 2031.
Which component segment is growing the fastest?
Software platforms, including cloud-hosted matching engines and developer kits, are forecast to grow at 22.05% CAGR between 2026-2031 as buyers prioritize subscription-based models.
Why are smartphone manufacturers adopting iris sensors?
On-device iris scanning offers contactless, high-accuracy authentication that meets banking e-KYC guidelines and differentiates premium handsets without significant hardware costs.
How do privacy regulations affect market deployment?
EU GDPR and the forthcoming AI Act classify iris patterns as sensitive data, requiring explicit consent, encrypted storage, and risk assessments, thereby adding compliance costs to European projects.
Which region is expected to record the highest growth?
The Middle East is set to achieve a 20.75% CAGR through 2031, driven by aviation modernization and national digital-ID programs.
What strategic moves are leaders making to stay competitive?
Established vendors focus on multimodal fusion, cloud-native algorithm delivery, and privacy-by-design architectures, while also forging licensing deals, such as Fingerprint Cards’ partnership with Smart Eye, to access adjacent verticals.
Page last updated on:





