Market Overview
| Study Period | 2020 - 2031 |
|---|---|
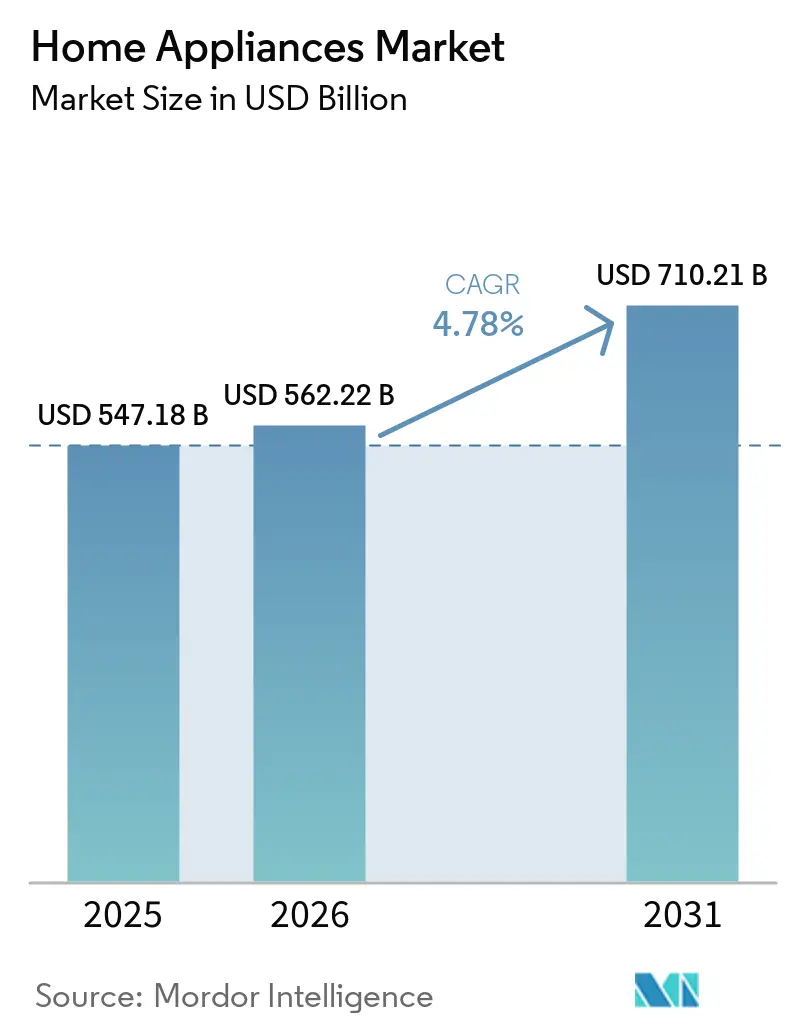
| Market Size (2026) | USD 562.22 Billion |
| Market Size (2031) | USD 710.21 Billion |
| Growth Rate (2026 - 2031) | 4.78% CAGR |
| Fastest Growing Market | Middle East and Africa |
| Largest Market | Asia Pacific |
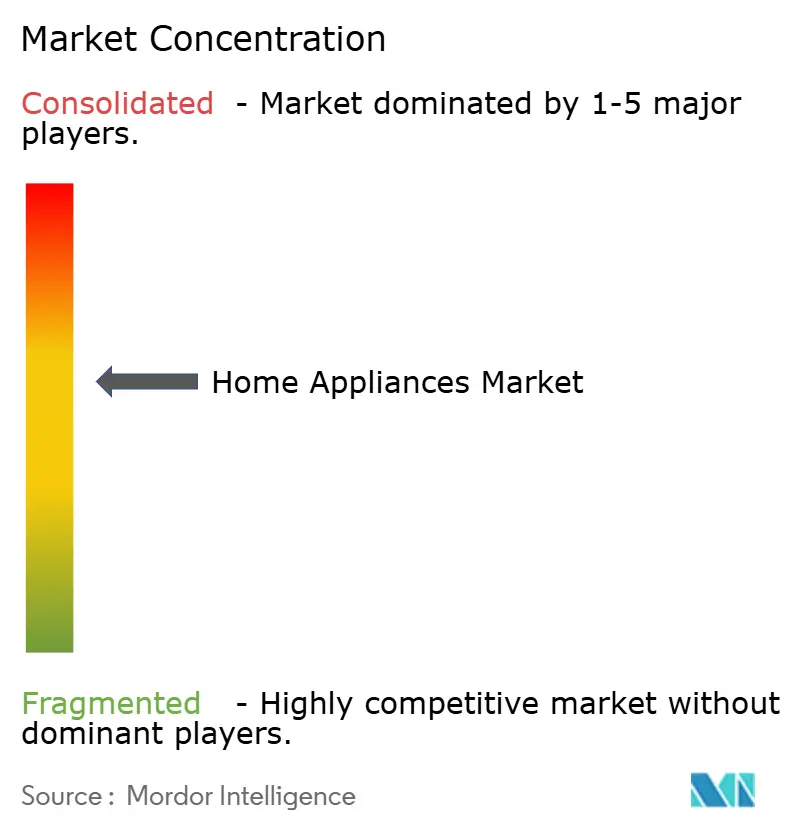
| Market Concentration | Medium |
Major Players *Disclaimer: Major Players sorted in no particular order Image © Mordor Intelligence. Reuse requires attribution under CC BY 4.0. | |
Home Appliances Market Analysis by Mordor Intelligence
The Home Appliances Market size is expected to grow from USD 547.18 billion in 2025 to USD 562.22 billion in 2026 and is forecast to reach USD 710.21 billion by 2031 at 4.78% CAGR over 2026-2031.
Momentum in the home appliances market is supported by steady replacement cycles, digital feature adoption, and rising preference for energy savings that cut operating costs for households. Demand patterns in the market stabilize after pandemic-era volatility, with growth anchored in structural drivers such as urbanization and income gains rather than short-lived surges. Competitive positioning in the market is shifting toward localized manufacturing and ecosystem-centric product strategies that reduce tariff exposure and deepen customer lock-in. Retail realignment in the home appliances industry favors digitally enabled paths to purchase, while service quality and installation support remain decisive for large-format products.
Key Report Takeaways
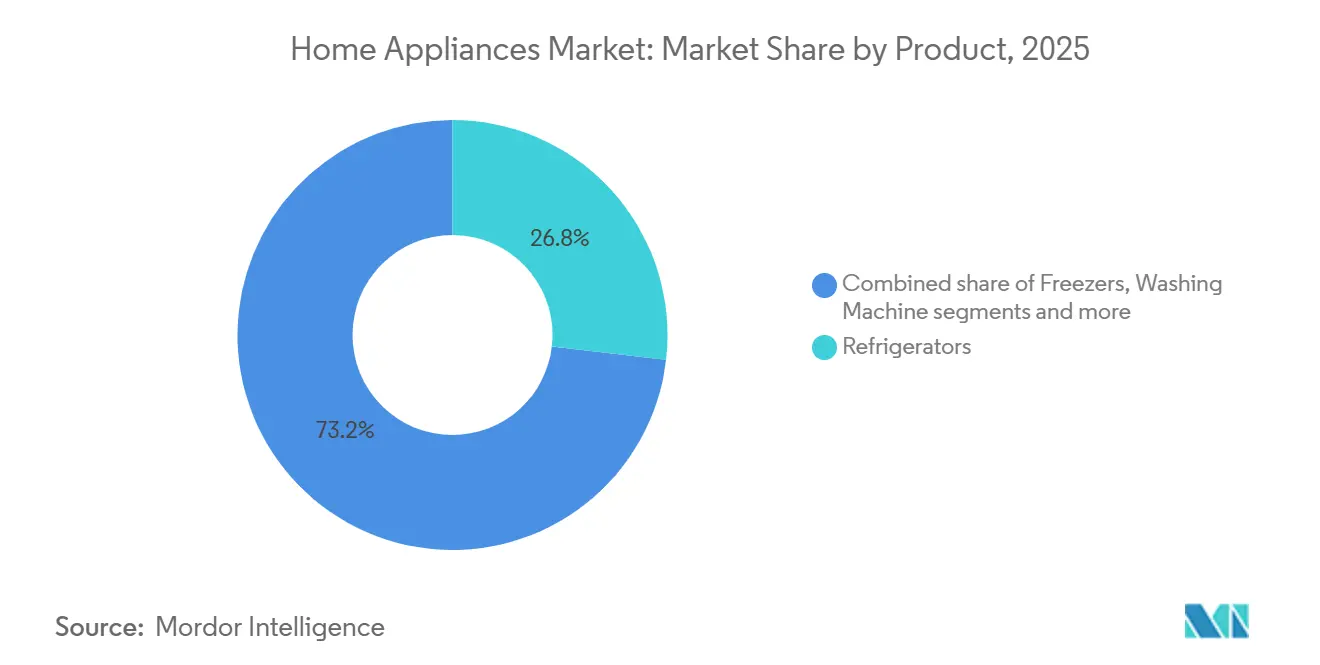
- By product, refrigerators led with 26.83% of the home appliances market share in 2025, while air fryers in small home appliances posted an 8.0% CAGR.
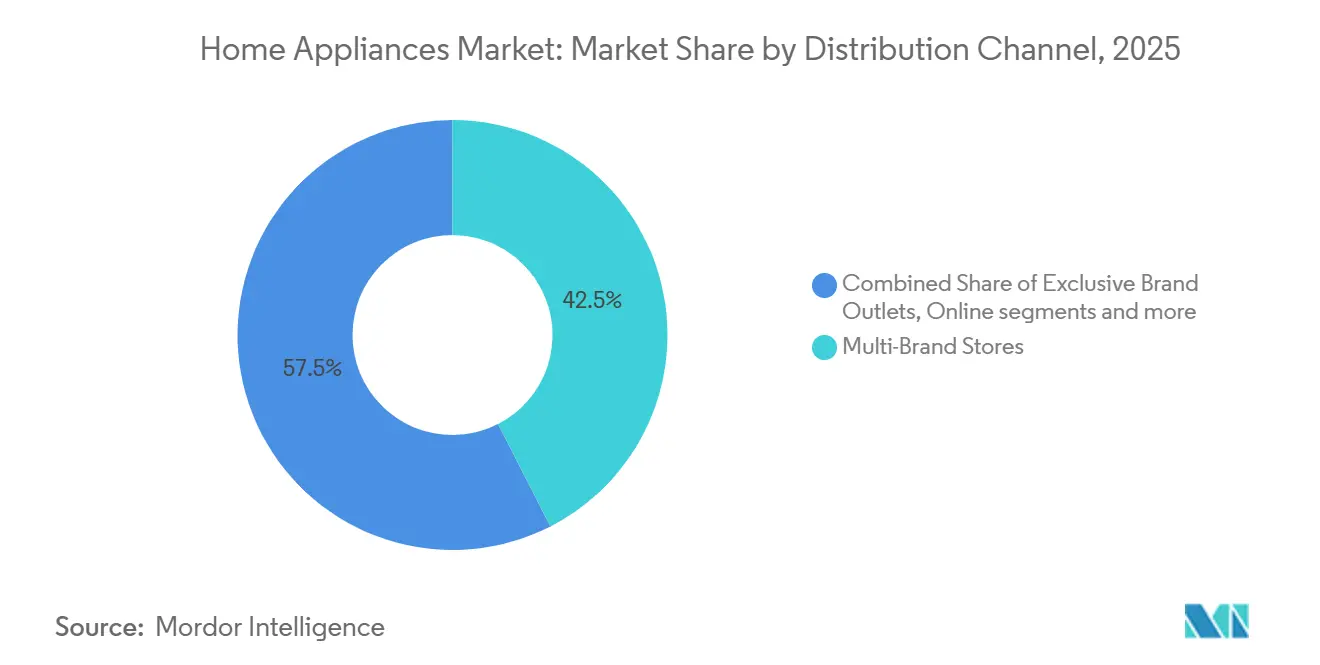
- By distribution channel, multi-brand stores accounted for 42.47% of the home appliances market share in 2025, and the online channel expanded at a 6.20% CAGR.
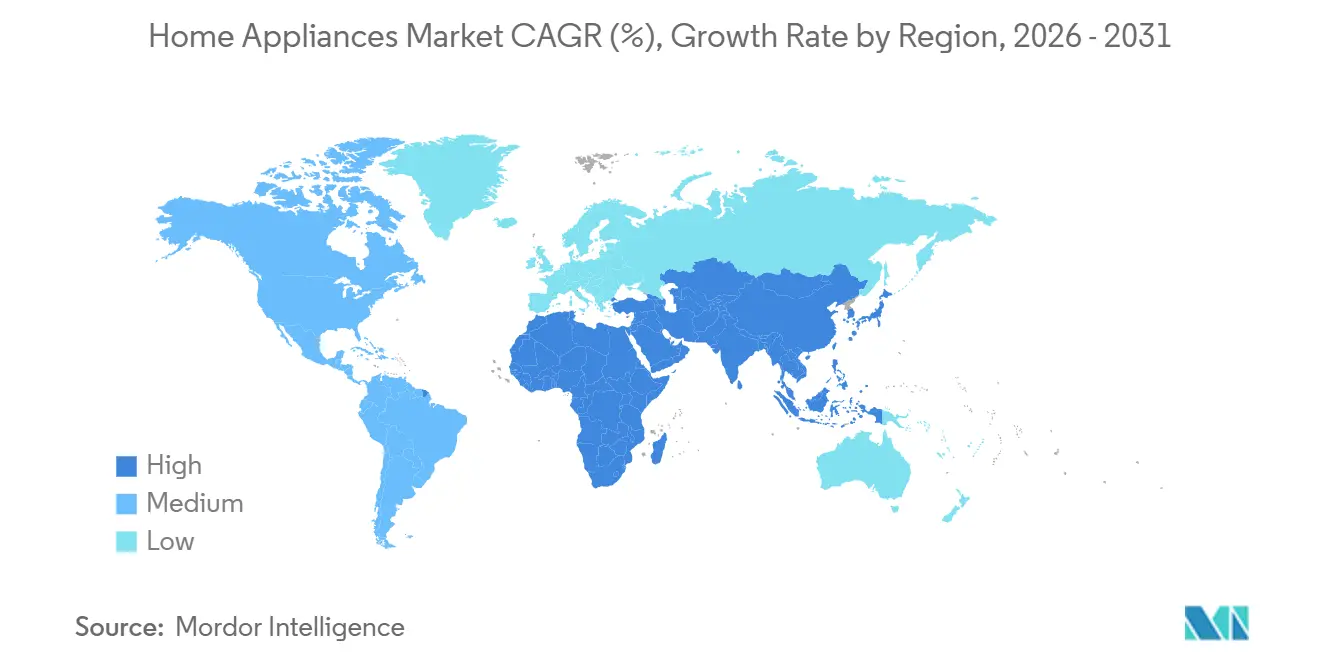
- By geography, Asia-Pacific held 48.35% of the home appliances market size in 2025, while the Middle East and Africa region recorded the fastest growth at 8.19% CAGR.
- The global home appliances market is moderately concentrated, with large international brands holding significant positions. However, competition from regional players and localized manufacturing strategies prevents market dominance by any single group.
Note: Market size and forecast figures in this report are generated using Mordor Intelligence’s proprietary estimation framework, updated with the latest available data and insights as of January 2026.
Global Home Appliances Market Trends and Insights
Drivers Impact Analysis*
| Driver | (~) % Impact on CAGR Forecast | Geographic Relevance | Impact Timeline |
|---|---|---|---|
| Rising disposable income and consumer spending power | +1.2% | Global, India, Southeast Asia, Latin America | Medium term (2-4 years) |
| IoT-enabled convenience and home automation boom | +0.9% | North America, Europe, China, Japan, South Korea | Short term (≤ 2 years) |
| Stricter energy-efficiency mandates are spurring replacement demand | +0.8% | Europe, the United States, China, India | Short term (≤ 2 years) |
| Growth of e-commerce and online sales channels | +0.7% | Global, especially APAC, North America, and Europe | Medium term (2-4 years) |
| Urbanization and changing lifestyles | +0.6% | India, China, Sub-Saharan Africa, Southeast Asia | Long term (≥ 4 years) |
| Premiumization and demand for feature-rich appliances | +0.8% | Urban consumers in North America, Europe, China, and GCC countries | Medium term (2-4 years) |
| Source: Mordor Intelligence | |||


Rising Disposable Income and Consumer Spending Power
Rising disposable income across many economies supports upgrades and first-time purchases, which sustain unit volumes and enable trading up to premium features that save time and energy. Growth in real household income across several OECD economies in 2025 reinforced durable goods demand and created headroom for higher efficiency and smart-enabled appliances that reduce operating costs. Middle-class expansion in Asia and Latin America continues to influence the composition of the home appliances market, with household budgets tilting toward products that deliver tangible convenience or health benefits in daily routines. Policy support in large markets such as China has also encouraged replacement activity, lifting sales for compliant models and setting higher expectations for energy performance standards. As household budgets expand and urban lifestyles compress time available for chores, the adoption of dishwashers, efficient washers, and compact cooking appliances becomes more frequent in new-to-category cities. Income-led upgrades thus remain a durable catalyst for the home appliances market through 2031.[1]https://www.oecd.org/en/data/indicators/household-disposable-income.htmlOECD.ORG
IoT-Enabled Convenience & Home Automation Boom
The proliferation of connected devices is fundamentally altering appliance value propositions, as consumers increasingly expect remote diagnostics, voice control, and integration with home energy-management platforms. The global count of connected IoT devices reached 21.1 billion in 2025, up 14% year-over-year, with Wi-Fi IoT claiming a 32% share of connections thanks to low-power Wi-Fi 6 features that enable battery-powered sensors and appliances.[2]https://iot-analytics.com/number-connected-iot-devices/IoT Analytics. Home Energy Management Systems (HEMS) markets are projected to triple from USD 3.5 billion in 2023 to USD 10-12 billion by 2030, driven by clean-energy transitions and the need for demand flexibility in grids increasingly reliant on variable renewables.[3]https://www.iea-4e.org/wp-content/uploads/2025/01/DF6_HEMS-market-scan_Final.pdf IEA. Smart home appliance penetration in U.S. households jumped from 13% to 22% in 2021 following pandemic-driven digital adoption, with manufacturers like LG and Samsung embedding AI chips directly into refrigerators and ovens to enable predictive maintenance alerts and automated recipe suggestions.
Growth of E-Commerce and Online Sales Channels
Digital commerce expands assortment and convenience for small appliances while supporting hybrid journeys for large appliances that still rely on scheduling, delivery, and installation. Mobile-first shopping compresses price discovery and shortens decision cycles for repeat categories such as countertop cooking devices and handheld cleaning equipment, often supported by visual content and quick comparisons. For major appliances, omnichannel models are consolidating, with research and financing online combined with in-store verification and services that reduce post-purchase anxiety. Over the forecast horizon, the online share of the home appliances market is expected to keep rising, supported by investments in last-mile services, integrated returns, and extended warranties that replicate the assurance of specialty retail. Logistics reliability and damage prevention remain essential differentiators, as consistent delivery performance and service coordination protect margins for bulky items. Platforms and OEMs that pair strong digital experiences with dependable fulfillment and installation will be best positioned to capture the next wave of growth.
Stricter Energy-Efficiency Mandates Spurring Replacement Demand
Regulatory tightening across advanced economies is accelerating the obsolescence of legacy appliances, creating a replacement cycle distinct from natural end-of-life dynamics. The United States Department of Energy finalized efficiency standards in 2024 that are expected to save Americans over USD 1 billion annually in utility bills and nearly USD 20 billion over 30 years of shipments, with compliance dates starting in 2026 for commercial water heaters and extending through 2029 for residential boilers.[4]https://www.energy.gov/articles/doe-announces-efficiency-standards-save-americans-more-1-billion-annually-utility-bills DOE. India's Bureau of Energy Efficiency (BEE) implemented stricter star-rating norms for refrigerators, air conditioners, ceiling fans, and solar inverters effective January 1, 2026, compelling manufacturers to refresh product lineups and offer trade-in incentives to clear non-compliant inventory. The European Union's Ecodesign for Sustainable Products Regulation (ESPR) and updated Energy Performance of Buildings Directive (EPBD) are pushing manufacturers toward embedded software updates and higher energy-efficiency ratings, with heat-pump dryer retrofits subsidized under Germany's BEG program.
Restraints Impact Analysis*
| Restraint | (~) % Impact on CAGR Forecast | Geographic Relevance | Impact Timeline |
|---|---|---|---|
| Commodity and freight-cost volatility is compressing margins | -0.9% | Global, concentrated in import-dependent markets | Medium term (2-4 years) |
| High initial costs of smart and energy-efficient appliances | -0.7% | Emerging markets, especially India, Southeast Asia, and Sub-Saharan Africa | Medium term (2-4 years) |
| Chip-set supply bottlenecks are disrupting production | -0.5% | Global, especially affecting smart appliance SKUs | Short term (≤ 2 years) |
| Intense price competition and product commoditization | -0.6% | Highly competitive markets in Asia-Pacific, Europe, and North America | Medium term (2-4 years) |
| Source: Mordor Intelligence | |||
Commodity & Freight-Cost Volatility Compressing Margins
Input cost swings and logistics disruptions raise the delivered cost of appliances, prompting OEMs to balance pricing, promotion, and SKU mix. Commodity markets have shown intermittent tightness across base metals and energy, complicating cost planning and placing pressure on bill-of-materials for motors, compressors, and structural components. Freight networks have improved from peak congestion yet remain vulnerable to route disruptions and port delays that can create sporadic spikes in container costs. Manufacturers are expanding regional production and sourcing to cut shipping exposure and shorten lead times, which also improves service responsiveness in key end markets. Over the medium term, cost risk management and more localized manufacturing footprints are expected to remain core to margin resiliency in the home appliances market.
High Initial Costs of Smart and Energy-Efficient Appliances
Premium pricing for connected features and high-efficiency technologies slows adoption where household budgets are stretched and utility tariffs mute payback. In emerging economies with lower per-capita incomes, consumers often favor robust, lower-cost options that meet basic needs, particularly where service networks are still developing. Clear communication of tangible benefits, such as measurable energy savings and reduced maintenance, becomes critical to justify the added upfront cost. Financing innovations, including embedded installment plans and builder partnerships, can ease sticker shock for first-time buyers. OEMs are also simplifying feature sets and pursuing localized value engineering to bring connectivity and efficiency to entry tiers without undermining reliability. As these measures scale, cost-to-value alignment should improve and expand the reachable base for smart and efficient SKUs in the home appliances market.
*Our forecasts treat driver/restraint impacts as directional, not additive. The impact forecasts reflect baseline growth, mix effects, and variable interactions.
Segment Analysis
By Product: Major Appliances Anchor Value, Air Fryers Lead Growth Sprint
Refrigerators accounted for 26.83% of the 2025 market size, reflecting their central role in replacement-driven demand and premiumization toward higher-efficiency formats. Refrigerators remain the single largest subcategory due to essential needs and long service lives that support upgrade cycles with better insulation, compressors, and connectivity. Laundry and cooling categories benefit from feature-led differentiation, including lower energy use and enhanced care modes, which help sustain higher average selling prices. Growing awareness of lifecycle running costs backs incremental trade-ups in large appliances, especially in urban middle-income households. With demand still tied to housing formation and renovations, the category’s growth profile is steady rather than explosive, yet it underpins a large share of revenue in the home appliances market.
Small home appliances continue to outpace the overall market on unit growth, with air fryers registering an 8.0% CAGR as consumers seek healthier, space-saving cooking solutions. The category’s appeal extends across demographics because it pairs quick preparation with lower energy use, a combination that is compelling for busy households. Robotic and cordless cleaning devices gain share as navigation improves and maintenance becomes more autonomous, lifting perceived value in daily use. Coffee makers and food preparation devices retain steady demand, supported by convenience and incremental smart features that simplify routines. This balance of accessible price points and visible utility keeps small appliances central to category expansion in the home appliances market.


By Distribution Channel: Multi-Brand Stores Dominate, Online Surges at 6.8% CAGR
Multi-brand stores held 42.47% of the 2025 market size by offering side-by-side comparisons, hands-on experience, and bundled services that are decisive for large-format purchases. For high-consideration products, knowledgeable sales assistance and reliable installation scheduling reduce risk and support conversion at healthy price points. Specialty formats in key regions curate premium assortments and provide experiential zones where new cooking or fabric-care features can be evaluated before purchase. Financing options and extended warranties also help both first-time buyers and upgraders manage budgets for major appliances. These factors keep multi-brand networks integral to the path-to-purchase in the home appliances market, even as digital share rises.
Online channels are expanding at a 6.20% CAGR, scaling fastest in small appliances and steadily gaining in major appliances as delivery, installation, and service coordination improve. Digital shoppers compare features quickly and often complete financing online, then use store visits or virtual consultations to confirm choices for complex products. Brands are enhancing web experiences with clearer energy-use information and service inclusions to reduce post-purchase friction. Builder partnerships and pre-install programs add a complementary path for default brand selection in new homes, anchoring share ahead of replacement cycles. The result is an omnichannel equilibrium where e-commerce grows while service-heavy retail remains an important conversion node within the home appliances market.
Geography Analysis
Asia-Pacific led with 48.35% of the 2025 market size, confirming its role as the growth anchor for scale manufacturing, first-time ownership, and upgrading in key urban corridors. China’s policy support for trade-ins and efficiency upgrades has encouraged replacement cycles that align with higher energy-performance thresholds. India’s urbanization continues to expand the base of households purchasing frost-free refrigerators, split air conditioners, and front-load washers for the first time. Japan and South Korea show strong adoption of connected features, though replacement cycles are extending as repair services and warranties improve. Across the region, localization of manufacturing and targeted value engineering are central to price-accessible innovation in the home appliances market.
North America remains a high-value region characterized by replacement intensity and steady premiumization in efficiency and connected features. Expansions of United States manufacturing footprints by leading OEMs strengthen supply resilience, shorten lead times, and support service coverage in major categories. Domestic investments in air conditioning, water heating, and laundry lines also position manufacturers to capture demand from households upgrading for both comfort and energy savings. Retail remains a hybrid environment where research is often digital, but conversion and scheduling still favor trusted store formats for large items. This mix supports an environment where the home appliances market grows on the back of replacements, new construction, and targeted remodel activity.
Europe shows a large installed base under active efficiency and sustainability policies that shape product features and labeling across categories. Ecodesign frameworks and energy labels influence merchandising and consumer choice, which encourages replacement toward higher efficiency classes in refrigeration, laundry, and dishwashing. Specialty retail remains an important channel for premium brands, while e-commerce continues to gain share in smaller appliances. Product modularity and serviceability are rising priorities as right-to-repair initiatives move forward. This policy and retail context keep Europe central to innovation in energy efficiency within the home appliances market.

Competitive Landscape
The competitive landscape is moderately concentrated at the global brand level, but category dynamics vary by region and product type. Large integrated players continue to localize production to manage tariff exposure and improve service responsiveness, complementing global platforms with regionalized product lines. Investment in United States manufacturing capacity highlights a reshoring trend that emphasizes supply security for high-volume categories. Chinese brands leverage cost engineering and rapid iteration to increase presence in Latin America, Eastern Europe, and parts of the Middle East and Africa. Across the home appliances market, leadership increasingly reflects the ability to combine cost discipline, reliable service, and feature-rich portfolios.
Competitive strategy is shifting toward ecosystem lock-in that unifies cooking, cooling, and laundry experiences under a common interface and app layer. Embedded AI and connectivity enable proactive maintenance, simplified setup, and energy-aware automation that coordinates with home energy management. Vendors are prioritizing interoperability to reduce friction in multi-brand homes and to future-proof installed bases with software-delivered feature updates. Portfolio updates in Europe showcased integrated cooking and climate offerings that target both comfort and decarbonization goals. This convergence of appliances and home energy systems raises the switching costs and supports premium positioning in the home appliances market.
White-space opportunities remain in compact multifunctional formats for dense urban housing and in robust, wide-voltage designs where grids are less stable. Partnerships with developers and builders create early brand defaults in new homes, pre-installing ecosystems that anchor service relationships from first occupancy. Regional innovation hubs and selective acquisitions expand product breadth into adjacent comfort categories that integrate with core appliances. Localized manufacturing and targeted supplier development support agile product refreshes close to demand centers. These moves align with the broader direction of the home appliances market, where execution on reliability, service, and energy performance determines durable share gains.
Home Appliances Industry Leaders
Whirlpool Corporation
Haier Group Corporation
LG Electronics, Inc.
Samsung Electronics Co., Ltd
Midea Group
- *Disclaimer: Major Players sorted in no particular order

Recent Industry Developments
- November 2025: GE Appliances awarded more than USD 150 million in supplier contracts to support new laundry capacity, including USD 40 million to four Kentucky plastics suppliers to expand component availability.
- September 2025: Midea unveiled “Master Your Home” innovations at IFA 2025 in Berlin, highlighting AI-integrated appliances, advanced refrigeration platforms, dual-zone air fryers, and energy optimization features.
- August 2025: GE Appliances announced a USD 3 billion multi-year expansion to boost United States manufacturing across air conditioning, water heating, and laundry, including new investment in robotic automation and insourcing of selected models.


Research Methodology Framework and Report Scope
Market Definitions and Key Coverage
Our study defines the global home appliances market as all newly manufactured electrical or gas-powered equipment used for domestic tasks such as food preservation, cooking, laundry care, room comfort, and cleaning, covering refrigerators, freezers, washing machines, dishwashers, ovens, air conditioners, vacuum cleaners, coffee makers, and similar countertop devices.
Scope exclusion: audio-visual consumer electronics (televisions, set-top boxes, smart speakers) fall outside this assessment.
Segmentation Overview
- By Product
- Major Home Appliances
- Refrigerators
- Freezers
- Washing Machines
- Dishwashers
- Ovens (Incl. Combi & Microwave)
- Air Conditioners
- Other Major Home Appliances (range hoods, cooktops, etc.)
- Small Home Appliances
- Coffee Makers
- Food Processors
- Grills and Roasters
- Electric Kettles
- Juicers and Blenders
- Air Fryers
- Vacuum Cleaners
- Other Small Home Appliances (waffle makers, toasters, tea makers, rice cookers, etc.)
- Major Home Appliances
- By Distribution Channel
- Multi-Brand Stores
- Exclusive Brand Outlets
- Online
- Other Distribution Channels
- By Geography
- North America
- Canada
- United States
- Mexico
- South America
- Brazil
- Peru
- Chile
- Argentina
- Rest of South America
- Europe
- United Kingdom
- Germany
- France
- Spain
- Italy
- BENELUX (Belgium, Netherlands, and Luxembourg)
- NORDICS (Denmark, Finland, Iceland, Norway, and Sweden)
- Rest of Europe
- Aisa-Pacific
- India
- China
- Japan
- Australia
- South Korea
- South East Asia (Singapore, Malaysia, Thailand, Indonesia, Vietnam, and Philippines)
- Rest of Asia-Pacific
- Middle East And Africa
- United Arab of Emirates
- Saudi Arabia
- South Africa
- Nigeria
- Rest of Middle East And Africa
- North America
Detailed Research Methodology and Data Validation
Primary Research
Mordor analysts interviewed appliance OEM managers, regional distributors, big-box retail buyers, and after-sales service providers across Asia-Pacific, North America, Europe, and the Middle East to cross-check shipment volumes, price moves, and technology-adoption assumptions.
Desk Research
We began with public macro datasets anchoring demand fundamentals; for example, World Bank household income tables, United Nations urbanization bulletins, and Eurostat dwelling completions. Trade-level inputs came from customs shipment codes, AHAM production releases, and ENERGY STAR efficiency registries. Company 10-Ks, investor decks, and press releases guided average selling price and channel-mix estimates. Select proprietary platforms, including D&B Hoovers and Dow Jones Factiva, supplied firm-level financials and news. The sources listed illustrate our approach, and many additional references supported data collection, validation, and research clarification.
Market-Sizing & Forecasting
A top-down consumption model links household formation, appliance-penetration rates, and replacement cycles. Then, results are sense-checked through sampled bottom-up roll-ups of manufacturer shipments and retail sell-through data. Key variables include new housing starts, electricity-tariff trends, disposable income per capita, e-commerce share of durables, regulatory energy-rating thresholds, and average product lifespans. Multivariate regression produces the forecast, and scenario analysis captures commodity-cost swings. When bottom-up evidence is thin, region-specific ASP benchmarks derived from primary calls bridge the gaps.
Data Validation & Update Cycle
Outputs run through variance filters, peer review, and senior sign-off. We refresh the dataset annually, while any material event such as tariff shifts or major plant closures triggers a rapid revision before release, ensuring clients always receive our latest view.
Why Mordor's Home Appliances Baseline Commands Reliability
Published numbers often diverge because firms blend smart entertainment devices with white goods, apply divergent ASP ladders, or freeze exchange rates at outdated levels.
The most visible gap drivers we observe are broader product scope, optimistic replacement-cycle assumptions, and infrequent model refreshes that some publishers follow.
Benchmark comparison
| Market Size | Anonymized source | Primary gap driver |
|---|---|---|
| USD 534.70 B (2025) | Mordor Intelligence | |
| USD 755.72 B (2025) | Global Consultancy A | Counts audio-visual electronics and uses retail sales values |
| USD 523.60 B (2025) | Trade Journal B | Limited store panel and undercounts online channels |
| USD 687.74 B (2025) | Research Publisher C | Uniform ASP uplift and five-year refresh cadence |
This comparison shows that Mordor's disciplined scope selection, annual refresh, and dual-path modeling give decision makers a balanced, transparent baseline they can confidently build upon.


Key Questions Answered in the Report
What is the home appliances market size in 2026, and how fast is it growing to 2031?
The home appliances market size is USD 562.22 billion in 2026 and is projected to reach USD 710.21 billion by 2031 at a 4.78% CAGR.
Which product segments are leading, and which are growing the fastest in the home appliances market?
Refrigerators lead by value, while air fryers in Small Home Appliances are the fastest growing with an 8.0% CAGR.
How are distribution channels evolving in the home appliances market?
Multi-Brand Stores hold the largest share, while the Online channel is growing at a 6.20% CAGR as logistics and installation services improve.
Which regions contribute most to demand in the home appliances market?
Asia-Pacific holds the largest share, and the Middle East and Africa are the fastest-growing regions, reflecting urbanization and rising electrification.
What regulatory trends are shaping the home appliances market?
Tighter energy-efficiency standards and labelling across major economies are accelerating replacement cycles and elevating baseline performance.
What factors most influence premium adoption in the home appliances market?
Clear energy savings, reliable service, and interoperable ecosystems that simplify daily use are the key drivers of premium adoption.
Page last updated on:


