Market Overview
| Study Period | 2021 - 2031 |
|---|---|
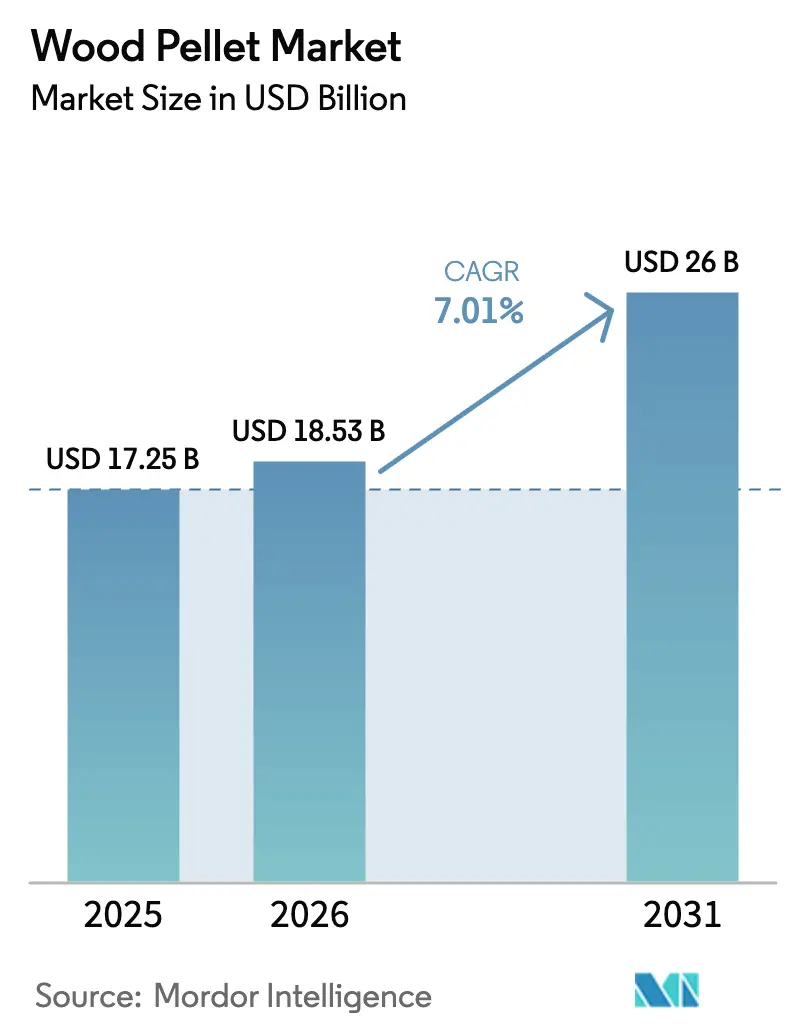
| Market Size (2026) | USD 18.53 Billion |
| Market Size (2031) | USD 26 Billion |
| Growth Rate (2026 - 2031) | 7.01% CAGR |
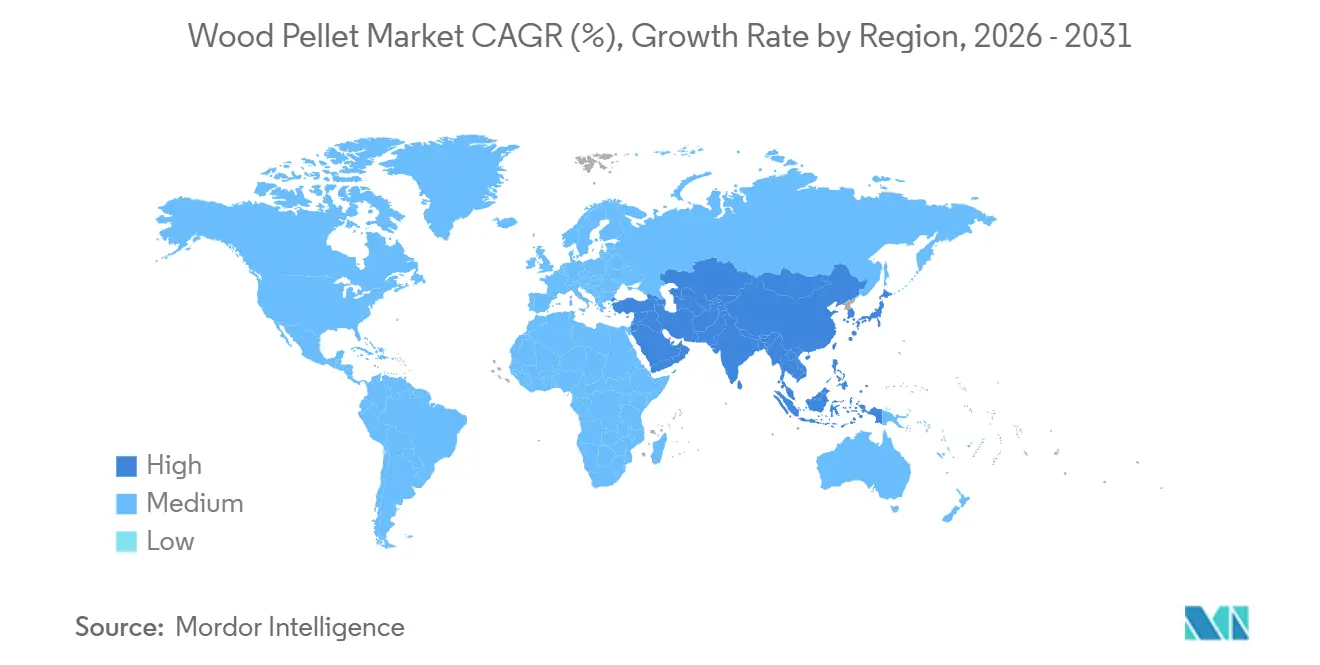
| Fastest Growing Market | Asia Pacific |
| Largest Market | Europe |
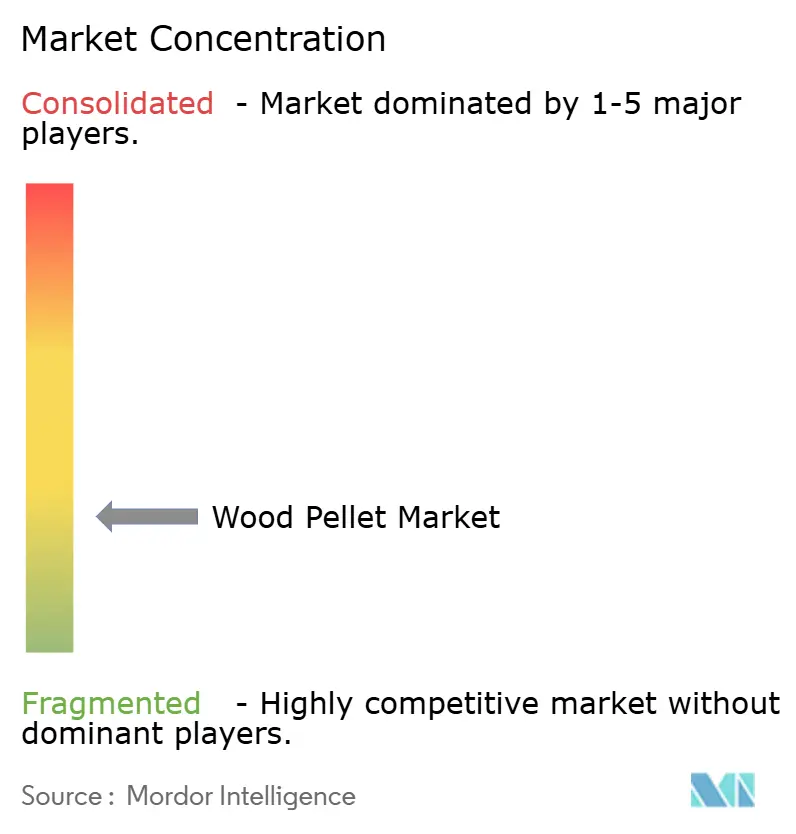
| Market Concentration | Low |
Major Players *Disclaimer: Major Players sorted in no particular order Image © Mordor Intelligence. Reuse requires attribution under CC BY 4.0. | |
Wood Pellet Market Analysis by Mordor Intelligence
The Wood Pellet Market was valued at USD 17.25 billion in 2025 and expected to grow from USD 18.53 billion in 2026 to reach USD 26 billion by 2031, at a CAGR of 7.01% during the forecast period (2026-2031).
Robust demand stems from utilities seeking dispatchable, low-carbon generation, district-heating operators upgrading legacy oil boilers, and corporations locking in biomass offtake to hedge against fossil-fuel price swings. Europe still anchors global trade flows, but rising imports by Japan and South Korea, together with early co-firing pilots in China and India, are tilting incremental growth toward the Asia-Pacific. Supply diversification is accelerating as producers commercialize agricultural residues, energy crops, and torrefied products to ease pressure on forest fiber baskets and satisfy new EU REDIII chain-of-custody rules. Bankruptcy-driven asset reshuffling in the United States, combined with vertically integrated expansions in Canada and the Baltics, is redrawing competitive boundaries across the wood pellet market.
Key Report Takeaways
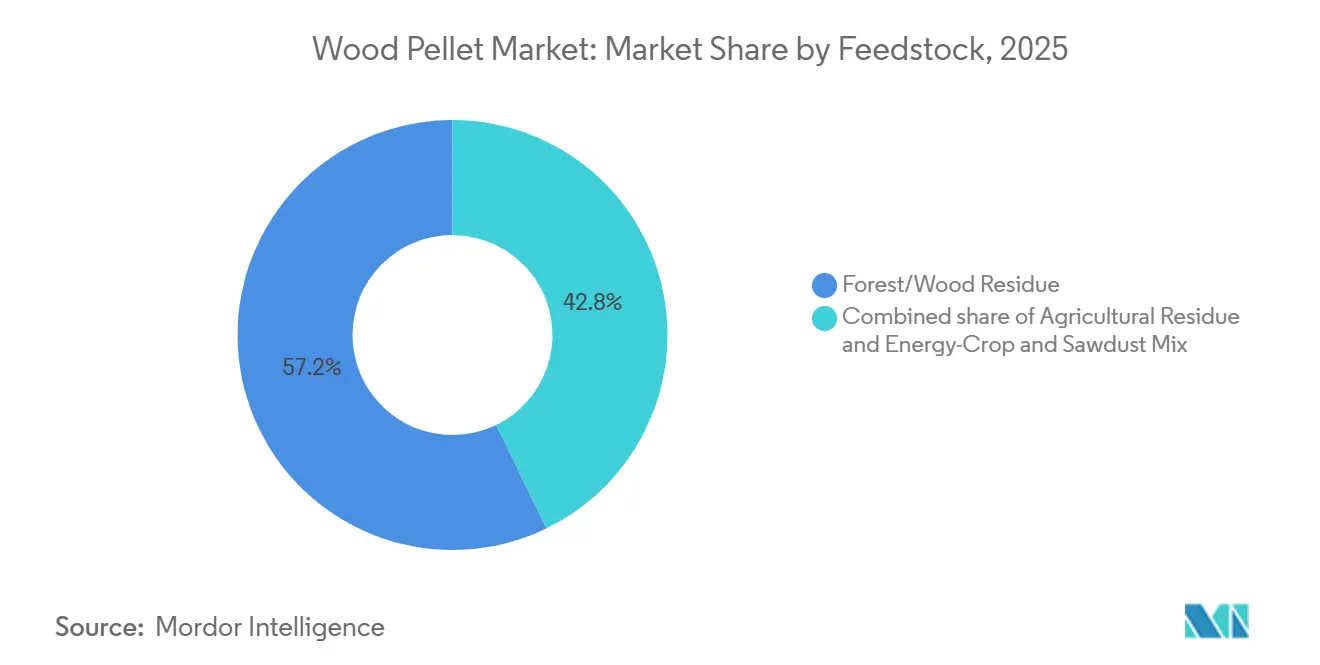
- By feedstock, forest and wood residue captured 57.2% of the wood pellet market share in 2025, while agricultural residue is forecast to expand at a 7.2% CAGR through 2031.
- By grade, utility-grade white pellets led with 56.7% volume share in 2025; torrefied black pellets are projected to grow at a 9.0% CAGR to 2031.
- By application, heating accounted for 59.2% of the wood pellet market size in 2025, whereas power generation is advancing at a 7.1% CAGR over the outlook period.
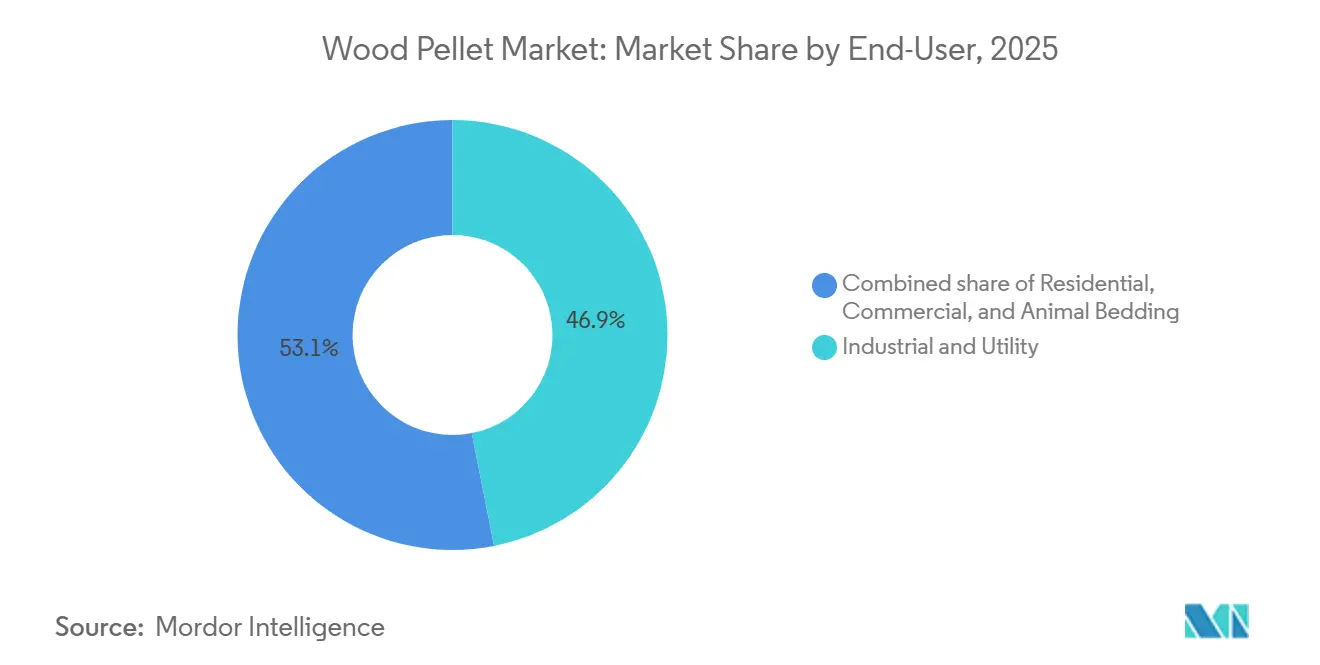
- By end-user, industrial and utility buyers held 46.9% of the wood pellet industry size in 2025, yet the commercial segment exhibits the fastest trajectory at a 7.9% CAGR to 2031.
- By geography, Europe commanded 72.4% of 2025 demand, but Asia-Pacific is poised for a 14.3% CAGR to 2031 as regional co-firing mandates intensify.
Note: Market size and forecast figures in this report are generated using Mordor Intelligence’s proprietary estimation framework, updated with the latest available data and insights as of January 2026.
Global Wood Pellet Market Trends and Insights
Drivers Impact Analysis*
| Driver | ( ~ ) % Impact on CAGR Forecast | Geographic Relevance | Impact Timeline |
|---|---|---|---|
| Japan-South Korea biomass co-firing mandates accelerating industrial pellet imports | +0.9% | Asia-Pacific (Japan, South Korea), spillover to North America export hubs | Medium term (2-4 years) |
| EU REDIII sustainability criteria fueling demand for certified premium pellets | +1.2% | Europe (EU27, UK), North America (export supply base) | Long term (≥ 4 years) |
| Corporate net-zero contracts boosting U.S. export-grade production | +1.0% | North America (U.S., Canada), Europe, Asia-Pacific | Medium term (2-4 years) |
| District-heating build-out in Nordics propelling pellet boiler adoption | +0.7% | Europe (Nordic countries: Sweden, Denmark, Finland, Norway) | Long term (≥ 4 years) |
| Volatile European gas prices driving residential stove conversions | +0.5% | Europe (Germany, France, Italy, Central Europe) | Short term (≤ 2 years) |
| Emergence of torrefied black pellets for coal-plant retrofits | +0.8% | Global (Europe, Asia-Pacific coal-dependent utilities) | Long term (≥ 4 years) |
| Source: Mordor Intelligence | |||
Japan-South Korea Biomass Co-Firing Mandates Accelerating Industrial Imports
Japanese utilities import nearly 3 million t of industrial pellets each year under the national feed-in tariff, and South Korean generators are obligated to source certified biomass through the renewable portfolio standard despite a 2024 subsidy haircut. Long-term, take-or-pay contracts signed with U.S. and Canadian suppliers lock in volumes to 2029, providing revenue certainty that underpins new mill investments along the Gulf and Atlantic coasts. Regional buyers are demanding flexible clauses that hedge freight and currency risk because the yen and won remain volatile against the U.S. dollar. Import volumes also hinge on the relative price of palm-kernel shells and ammonia, two competing alternatives under review by Asian utilities planning 2030 decarbonization pathways. If the co-firing mandates survive scheduled policy reviews in 2027, the wood pellet market could secure a durable Asian demand floor that buffers any cyclical softness in Europe.[1]Drax Group, “Biomass Sourcing Policy v1.1,” drax.com
EU REDIII Sustainability Criteria Fueling Demand for Certified Premium Pellets
The Renewable Energy Directive III embeds strict chain-of-custody obligations that de-risk biodiversity and land-use change, effectively bifurcating supply into certified and non-certified streams. Vertically integrated producers holding Sustainable Biomass Program and Forest Stewardship Council credentials now command 5%–10% price premiums, a margin uplift that offsets higher logistics and compliance costs. European utilities are inserting pass-through provisions that claw back penalties if suppliers fall out of compliance, reinforcing a two-tier procurement ecosystem. North American mills have responded by upgrading monitoring technology and expanding catchment-area audits to meet new transatlantic tender requirements. The higher bar for documentation is capital-intensive, but it also locks smaller, non-certified operators out of long-term contracts, consolidating volume among the top five players.
Corporate Net-Zero Contracts Boosting U.S. Export-Grade Production
Hard-to-abate sectors such as aviation, cement, and steel are signing multi-year offtake contracts to secure negative-emission feedstocks that can generate tradable carbon credits, strengthening demand in the wood pellet market. Drax’s 1 million tons per year heads-of-terms with Pathway Energy for sustainable aviation fuel exemplifies this pivot, with deliveries slated to begin in 2029 from expanded capacity in the U.S. Southeast. Contract structures now include inflation pass-through and price-reset mechanisms to avoid the fixed-price traps that sank Enviva during the 2022 spot-price spike. Corporate buyers also prefer shorter tenors of 5–7 years so they can recalibrate sourcing strategies as new decarbonization technologies mature. These shifts diversify end-market exposure for pellet producers and insulate cash flows from regional policy risk.[2]
District-Heating Build-Out in Nordics Propelling Pellet Boiler Adoption
Over 500 district-heating networks across Sweden, Denmark, and Finland supplied roughly 60% of residential heat in 2025, supporting demand in the wood pellet industry. Municipalities are decommissioning oil boilers and installing pellet-fired combined heat-and-power units to comply with carbon-neutrality targets set for 2045–2050. Because Denmark imports about 75% of its pellet needs, certified premium pellets sourced from the Baltics and Canada enjoy reliable baseload demand. Equipment vendors are introducing modular boilers that can toggle between pellets, chips, and agricultural residues, boosting system resiliency against feedstock scarcity. National carbon taxes, alongside bans on new fossil-fuel heating in urban buildings, keep pellet prices competitive even when natural-gas prices revert to pre-crisis levels.
Restraints Impact Analysis*
| Restraint | (~) % Impact on CAGR Forecast | Geographic Relevance | Impact Timeline |
|---|---|---|---|
| Subsidy rollbacks in U.K./Netherlands over lifecycle-emission concerns | -0.8% | Europe (UK, Netherlands, spillover to EU27) | Short term (≤ 2 years) |
| Sustainable feedstock bottlenecks in U.S. Southeast | -0.6% | North America (U.S. Southeast), global supply chains | Medium term (2-4 years) |
| Competition from palm-kernel-shell biomass in ASEAN power mix | -0.4% | Asia-Pacific (Indonesia, Malaysia, Thailand) | Medium term (2-4 years) |
| High-interest-rate capex burden for new pellet mills | -0.5% | Global (North America, Europe, emerging markets) | Short term (≤ 2 years) |
| Source: Mordor Intelligence | |||
Subsidy Rollbacks in U.K./NL over Lifecycle-Emission Concerns
The United Kingdom scrapped direct biomass subsidies in April 2024, removing roughly GBP 500 million in annual support and triggering a 15% drop in pellet imports during H2 2024. Drax is negotiating a bridging contract-for-difference to keep its 3 million tons per year plant running until carbon-capture infrastructure is commissioned post-2027, but policy uncertainty has depressed investor sentiment and narrowed refinancing options. Dutch regulators are conducting a parallel review focused on near-term carbon intensity, and early drafts suggest stricter limits on forest-sourced pellets could take effect in 2027. Baltic producers that once relied on Benelux utilities now face volume risk, prompting them to court Korean and Japanese buyers instead. The subsidy changes fragment regional demand and complicate long-range capacity planning for the wood pellet market.
Competition from Palm-Kernel-Shell Biomass in ASEAN Power Mix
Palm-kernel shells (PKS), a by-product of palm-oil milling, cost 20%–30% less than imported white pellets on a delivered-energy basis in Indonesia and Malaysia in the wood pellet market. Coal plants equipped with simple crushing lines can co-fire up to 10% PKS without major capex, satisfying renewable-portfolio quotas at minimal operating cost. The sustainability credentials of PKS are debated, yet local policymakers still classify it as agricultural waste, allowing plants to claim renewable credits. Wood-pellet exporters must therefore target premium segments such as residential heating and industrial boilers that cannot tolerate PKS’s higher ash content. Limited European acceptance of PKS for REDIII compliance also constrains trans-continental trade, capping global volume displacement.[3]
*Our forecasts treat driver/restraint impacts as directional, not additive. The impact forecasts reflect baseline growth, mix effects, and variable interactions.
Segment Analysis
By Feedstock: Agricultural Residue Broadens Supply Optionality
Forest and wood residue generated 57.2% of the 2025 volume, bolstered by expansive fiber baskets in the U.S. Southeast and British Columbia that supply low-grade roundwood and sawmill chips on multi-year contracts. Agricultural residues, notably wheat straw, rice husks, and corn stover, are forecast to post a 7.2% CAGR to 2031 as pelletizers in the U.S. Midwest, Eastern Europe, and India commercialize densification lines that handle higher silica content. The wood pellet market size for agricultural residues is expected to approach 12 million t by 2031, improving regional supply resilience.
In practice, straw-based pellets suffer from slagging at high furnace temperatures, prompting equipment makers to install refractory linings and automated soot-blowing systems that add capex but preserve boiler uptime in the wood pellet industry. Producers offset lower bulk density by co-locating mills near farm clusters, trimming inbound logistics. Forest residue retains an intrinsic advantage in energy density and ash chemistry, yet its growth ceiling is constrained by biodiversity safeguards and competing demand from pulp mills. A rising share of crop-waste pellets, therefore, diversifies risk and aligns with circular-economy narratives that resonate with corporate buyers seeking verifiable waste valorization claims.


By Grade: Torrefied Pellets Target Coal-Retrofit Niche
Utility-grade white pellets held 56.7% of shipments in 2025 under long-term supply deals with European and Japanese generators. Premium residential pellets, certified to ENplus A1, captured a niche 18% slice, commanding a 10%–15% price uplift that shields margins during commodity cycles. The highest growth resides in torrefied black pellets, slated for a 9.0% CAGR through 2031, a forecast underpinned by Asian coal-fleet retrofits eager to raise biomass substitution ratios without new pulverizers. Torrefied throughput is expected to surpass 6 million t by 2031, equal to about 3% of the global wood pellet market size.
Market acceptance hinges on scaling pilot plants into 250,000-t commercial modules that spread fixed costs and mitigate the 20%–30% feedstock mass loss intrinsic to torrefaction. Premium-grade white pellets still anchor residential demand because strict ash thresholds avoid chimney fouling and meet urban emission caps. Standard-grade pellets service small industrial boilers and district-heating grids that balance cost and performance. Utility-grade dominance persists, yet policy-driven coal phase-outs in Europe could flatten growth unless torrefied solutions gain a wider footing.
By Application: Power Generation Edges Toward Parity With Heat
Heating remained the top use case at 59.2% of 2025 deliveries, fueled by Nordic district networks and 6 million residential stoves across Germany, France, and Italy. The power sector is projected to clock a 7.1% CAGR, lifting its share to nearly 40% by 2031 as utilities secure long-dated contracts to bridge intermittency gaps until large-scale storage or carbon capture matures. The wood pellet market size for power generation is forecast to top 130 terawatt-hours of output by 2031, equivalent to the annual consumption of Sweden.
Combined heat and power (CHP) plants occupy a steady niche where municipal steam loads or process-heat demand justify higher upfront capex. Corporate offtakes for sustainable aviation fuel, green steel, and bio-cement introduce a nascent but strategic demand wedge that could unlock premium pricing for negative-emission pellets. Heat’s supremacy faces competition from air-source heat pumps subsidized under EU Fit-for-55, yet pellet boilers retain an edge in older building stock lacking ductwork or three-phase electrical upgrades.
By End-User: Commercial Facilities Accelerate Conversion
Industrial and utility customers consumed 46.9% of 2025 volumes, anchored by a dozen European and Asian generators under take-or-pay obligations. Commercial establishments, hotels, hospitals, and universities are predicted to grow at a 7.9% CAGR as carbon taxes and green finance shorten boiler payback to five years. The segment’s share of the wood pellet market is set to approach 23% by 2031, up from 18% in 2025.
Residential demand swings with fossil-fuel price volatility: surging when gas spikes, ebbing when prices normalize. Animal bedding remains a minor but stable outlet, uncorrelated with energy markets, providing producers a hedge against cyclical heating demand. Utilities’ concentrated purchasing power compresses margins, driving suppliers to court commercial buyers that value service quality and emissions branding over lowest cost. Still, any sudden utility exit, as seen in the U.K., can ripple through supply chains, underscoring the importance of diversified customer portfolios.
Geography Analysis
Europe controlled 72.4% of global demand in 2025, supported by legacy coal-to-biomass conversions in the U.K., Sweden’s and Denmark’s district-heating backbone, and Germany’s subsidy-backed stove installations. Policy risk rose after the U.K. ended biomass subsidies in 2024 and Dutch regulators launched a lifecycle-emission review, but certified supply still enjoys compliance advantages under EU REDIII. The wood pellet market share for Europe is projected to slip modestly as imports plateau, yet its absolute volume remains the world’s largest through 2031.
Asia-Pacific is the fastest riser, forecast to expand at a 14.3% CAGR, propelled by Japan’s 20-year feed-in tariff for biomass co-firing and South Korea’s renewable-portfolio auctions. Japan imported roughly 3 million t in 2024, while Korean utilities sought 1.8 million t despite subsidy cuts. Pilot projects in China’s coastal coal fleet and India’s ag-residue densification initiatives add long-tail upside if policy support matures. Competition from palm-kernel shells caps penetration in Indonesia and Malaysia, but torrefied products could alter the equation once commercial volumes scale.
North America acts chiefly as an export platform, operating 12 million t of annual capacity in 2024.[4]USDA Foreign Agricultural Service, “Denmark Bioenergy Update 2025,” fas.usda.gov Enviva’s restructuring cast a spotlight on leverage risk, yet Canadian mills in British Columbia and Alberta continue to benefit from sawmill residuals and railway access to Prince Rupert and Vancouver ports. Mexican consumption is negligible today, though abundant corn stover offers latent supply potential pending supportive regulation. Domestic U.S. demand is limited outside niche CHP sites, but decarbonization credits in California and New York could birth regional offtake hubs later in the decade.

Competitive Landscape
The five largest producers, Drax Group, Graanul Invest, Enviva (under restructuring), Segezha Group, and Pinnacle assets within Drax, collectively control about 40% of global capacity, leaving a long tail of single-site operators. Vertical integration dominates strategy: Drax owns 17 mills, three deep-water terminals, and its own rail fleet, ensuring cradle-to-grave control over fiber, pellets, and power generation. Certification is the key moat; buyers increasingly reject non-certified volumes, granting premium pricing to mills with sustainable biomass or forest stewardship seals.
Contract renegotiations intensified after Enviva entered Chapter 11 in 2024, revealing fixed-price deals that became uneconomic once spot prices retreated. Producers now favor shorter terms with inflation escalators, shifting commodity risk to utilities. Torrefaction startups, though few, could disrupt the status quo if they demonstrate bankable yields and secure offtake for coal-fleet conversions in Asia. South American and Southeast Asian entrants leverage low-cost eucalyptus and acacia feedstocks, but often struggle with certification and port infrastructure, tempering their global reach.
Technology investment centers on multi-feedstock drying systems and bulk-handling automation that cut operating cost per tonne. Graanul Invest retrofitted six Baltic plants with energy-efficiency upgrades, lifting EBITDA despite soft demand. Drax’s Pathway Energy agreement signals diversification beyond power into aviation fuel feedstock, potentially unlocking higher value and insulating revenue from subsidy shifts. Overall, financial discipline and sustainability credentials outweigh sheer scale as the defining success factors for the next wave of growth in the wood pellet industry.
Wood Pellet Industry Leaders
Enviva Inc.
Drax Group PLC
AS Graanul Invest
Lignetics Inc.
Segezha Group JSC
- *Disclaimer: Major Players sorted in no particular order

Recent Industry Developments
- May 2025: Drax Group posted a record 4 million tons pellet output for 2024 and signaled USD 250 million recurring EBITDA from biomass production after 2027.
- April 2025: India’s Talwandi Sabo Power commissioned a 500 t-day torrefied pellet plant using crop residue.
- December 2024: South Korea cut biomass renewable-credit rates for new projects, gradually phasing down incentives for existing plants.
- November 2024: Vietnam exported 5.3 million t of pellets during Jan-Nov 2024, on track for 5.8 million t for the year.


Research Methodology Framework and Report Scope
Market Definitions and Key Coverage
Our study defines the wood pellet market as all revenues generated from the sale of densified biomass pellets manufactured from forestry residues, sawmill by-products, or purpose-grown energy crops and consumed for heating, power generation, or combined heat and power across residential, commercial, industrial, and utility settings worldwide.
Scope exclusion: pellets produced purely for animal bedding or barbecue applications are not counted.
Segmentation Overview
- By Feedstock
- Forest/Wood Residue
- Agricultural Residue
- Energy-Crop and Sawdust Mix
- By Grade
- Utility-Grade (White)
- Premium-Grade
- Standard-Grade
- Torrefied “Black” Pellets
- By Application
- Heating
- Power Generation
- Combined Heat and Power (CHP)
- By End-user
- Residential
- Commercial
- Industrial and Utility
- Animal Bedding
- By Geography
- North America
- United States
- Canada
- Mexico
- Europe
- United Kingdom
- Germany
- France
- Italy
- Spain
- NORDIC Countries
- Russia
- Rest of Europe
- Asia-Pacific
- China
- India
- Japan
- South Korea
- ASEAN Countries
- Rest of Asia-Pacific
- South America
- Brazil
- Argentina
- Colombia
- Rest of South America
- Middle East and Africa
- United Arab Emirates
- Saudi Arabia
- South Africa
- Rest of Middle East and Africa
- North America
Detailed Research Methodology and Data Validation
Primary Research
Mordor analysts interview pellet producers, traders, power plant fuel managers, boiler OEMs, and regional bioenergy associations across Europe, North America, and Asia-Pacific. Insights on spot pricing spreads, feedstock cost inflation, and plant utilization rates validate desk estimates and close data gaps identified in early drafts.
Desk Research
We begin by mapping supply and demand fundamentals through open datasets such as FAO forestry statistics, Eurostat trade flows, U.S. EIA biomass inventories, and Bioenergy Europe capacity reports. Policy documents, including EU RED III, Japan FIT tariffs, and U.S. Renewable Heat Incentive updates, clarify regulatory drivers. Company filings and investor decks reveal contract volumes and average selling prices. When regional volumes are unclear, paid repositories like D&B Hoovers and Dow Jones Factiva help triangulate producer shipments. This list is illustrative; many further public and subscription sources inform our desk work.
Market-Sizing and Forecasting
A top-down reconstruction starts with national production, import, and inventory balances, which are then reconciled with consumption by end use. Select bottom-up checks, sampled mill output, distributor channel checks, and premium-grade ASP times export volume calibrate totals. Key variables include residential heating degree days, announced coal-to-biomass retrofit capacity, certified sustainable forest residue availability, average industrial pellet price, and shipping costs to Europe and Northeast Asia. Multivariate regression links these drivers to historical revenue, while scenario analysis stresses policy or weather shocks before extending forecasts to 2030.
Data Validation and Update Cycle
Every draft undergoes anomaly checks versus independent indicators, followed by analyst peer review. We refresh models annually and issue interim updates whenever material events, such as policy shifts, large-scale plant outages, or significant currency swings, alter market trajectories.
Why Our Wood Pellet Baseline Commands Reliability
Published figures often diverge because firms choose different feedstock boundaries, price assumptions, and refresh rhythms.
Key gap drivers arise when other studies merge animal-bedding grades, rely on single-region ASPs, or freeze policy scenarios for multiple years, whereas Mordor updates tariffs and exchange rates each cycle and keeps non-energy pellet demand outside the core scope.
Benchmark comparison
| Market Size | Anonymized source | Primary gap driver |
|---|---|---|
| USD 12.72 bn (2025) | Mordor Intelligence | - |
| USD 19.48 bn (2024) | Global Consultancy A | Includes barbecue and bedding pellets; uses uniform global price |
| USD 13.60 bn (2024) | Industry Journal B | Applies aggressive 16 percent CAGR without recent policy moderation |
| USD 9.32 bn (2024) | Regional Consultancy C | Excludes Asia-Pacific industrial demand and counts only heating use |
Taken together, the comparison shows that Mordor's disciplined scope, live policy tracking, and dual validation steps deliver a balanced, transparent baseline that decision-makers can retrace and update with confidence.


Key Questions Answered in the Report
How large is the wood pellet market in revenue terms today?
The wood pellet market size reached USD 18.53 billion in 2026 and is forecast to reach USD 26 billion by 2031.
Which region is expanding the fastest?
Asia-Pacific is projected to grow at a 14.3% CAGR through 2031 as Japan and South Korea scale biomass co-firing mandates.
What feedstock segment shows the strongest upside?
Agricultural residue pellets, including straw and crop waste, are forecast at a 7.2% CAGR on rising interest in circular-economy solutions.
Why are torrefied pellets gaining attention?
Torrefied black pellets offer higher energy density and easier handling, enabling coal plants to raise biomass co-firing ratios without major boiler changes.
How did Enviva’s bankruptcy affect the sector?
The restructuring highlighted leverage risk, prompting tighter contract terms and reinforcing the need for diversified fiber baskets and balanced customer portfolios.
Page last updated on:


