Market Overview
| Study Period | 2021 - 2031 |
|---|---|
| Forecast Data Period | 2026 - 2031 |
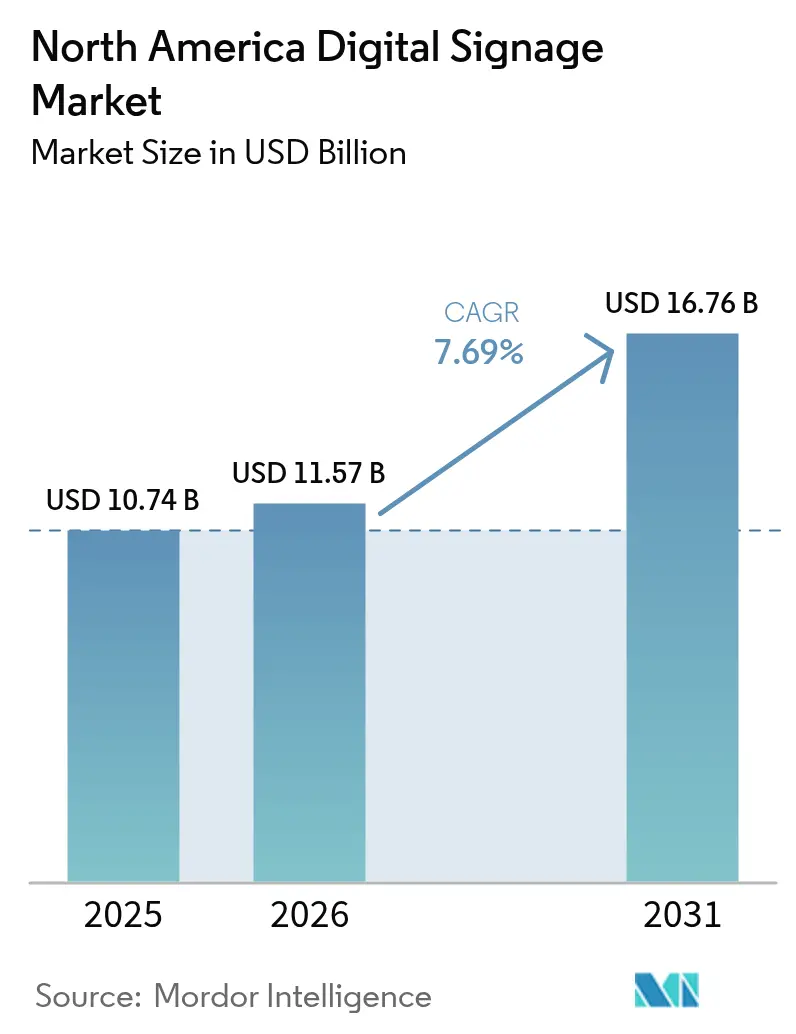
| Base Year Market Size (2025) | USD 10.74 Billion |
| Market Size (2026) | USD 11.57 Billion |
| Market Size (2031) | USD 16.76 Billion |
| Growth Rate (2026 - 2031) | 7.69% CAGR |
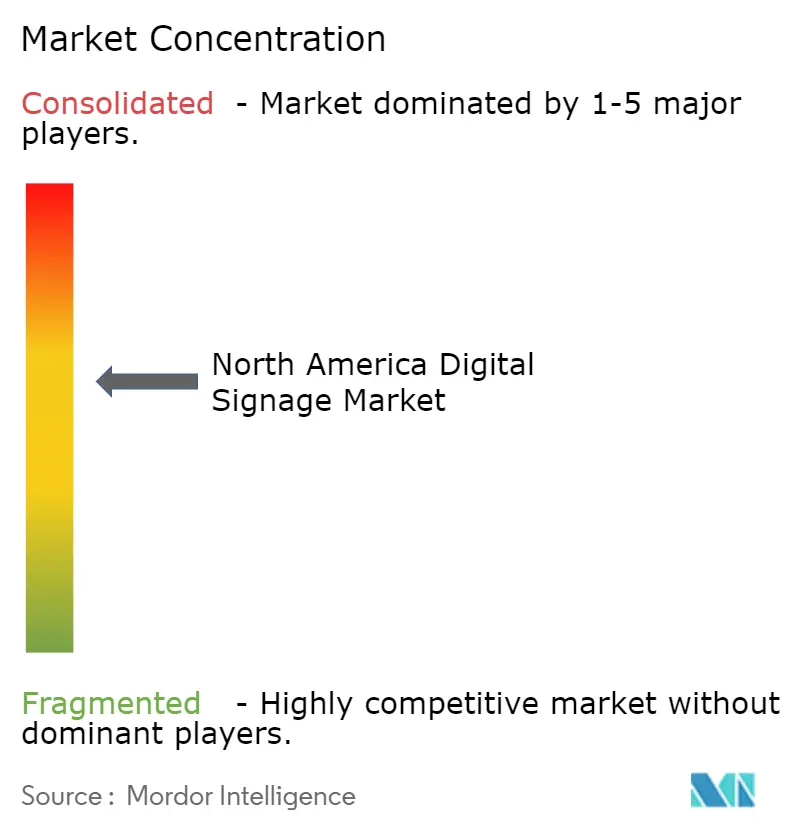
| Market Concentration | Medium |
Major Players *Disclaimer: Major Players sorted in no particular order Image © Mordor Intelligence. Reuse requires attribution under CC BY 4.0. | |
North America Digital Signage Market Analysis by Mordor Intelligence
The North America digital signage market size was valued at USD 10.74 billion in 2025 and estimated to grow from USD 11.57 billion in 2026 to reach USD 16.76 billion by 2031, at a CAGR of 7.69% during the forecast period (2026-2031). Growth comes from retailers, transportation hubs, and corporate campuses that now treat screens as data-rich tools for customer engagement rather than passive billboards. Hardware still anchors most projects, yet cloud software and analytics subscriptions are expanding margins for vendors and easing roll-outs for end-users.[1]Hughes, “Frost Radar: Digital Signage Solutions 2025,” hughes.comInteractive formats, transparent LED façades, and programmatic buying are reshaping return-on-investment calculations, while declining LCD panel costs and bundled “hardware-plus-software” offers are pulling small businesses into the upgrade cycle. Tariff shifts, energy-efficiency rules, and localized manufacturing are redrawing supplier maps, but sustained capital spending by multi-site brands keeps the demand curve intact.[2]Natural Resources Canada, “Digital Signage,” nrcan.gc.ca
Key Report Takeaways
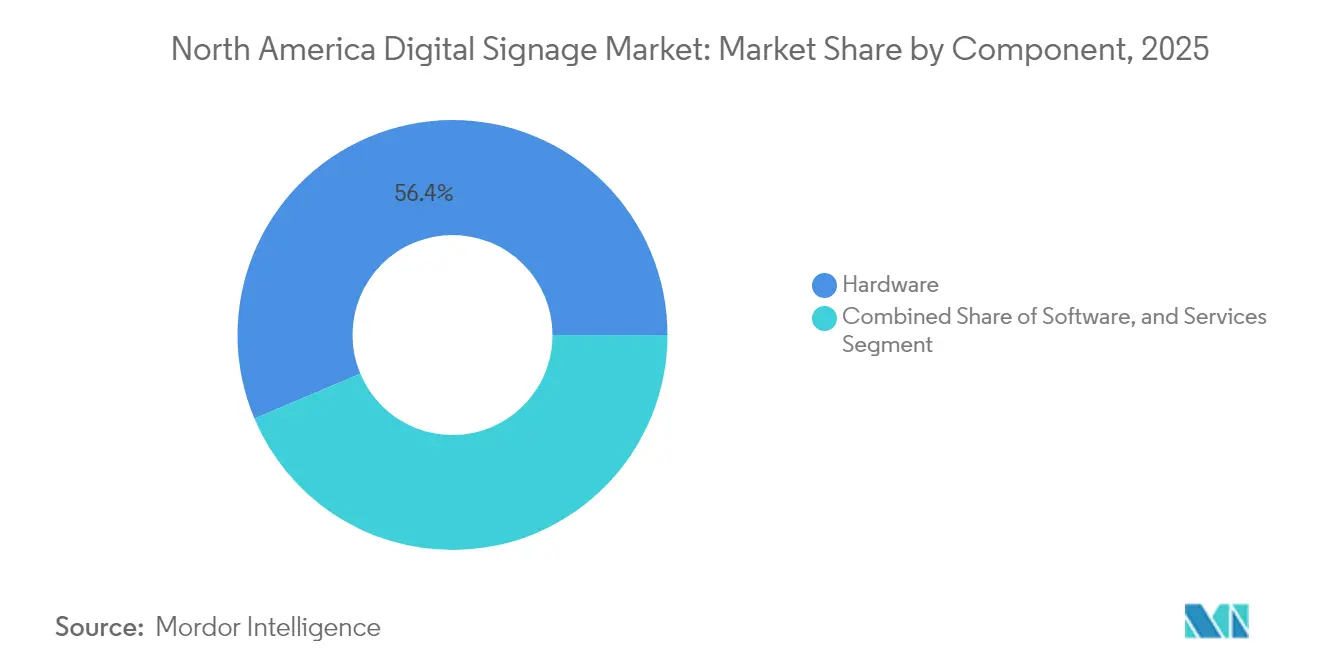
- By component, hardware commanded 56.35% of the North America digital signage market size in 2025, while software is projected to grow at an 8.73% CAGR between 2026-2031.
- By location, indoor screens led with a 67.65% revenue share in 2025; the outdoor segment is projected to advance at a 9.08% CAGR through 2031.
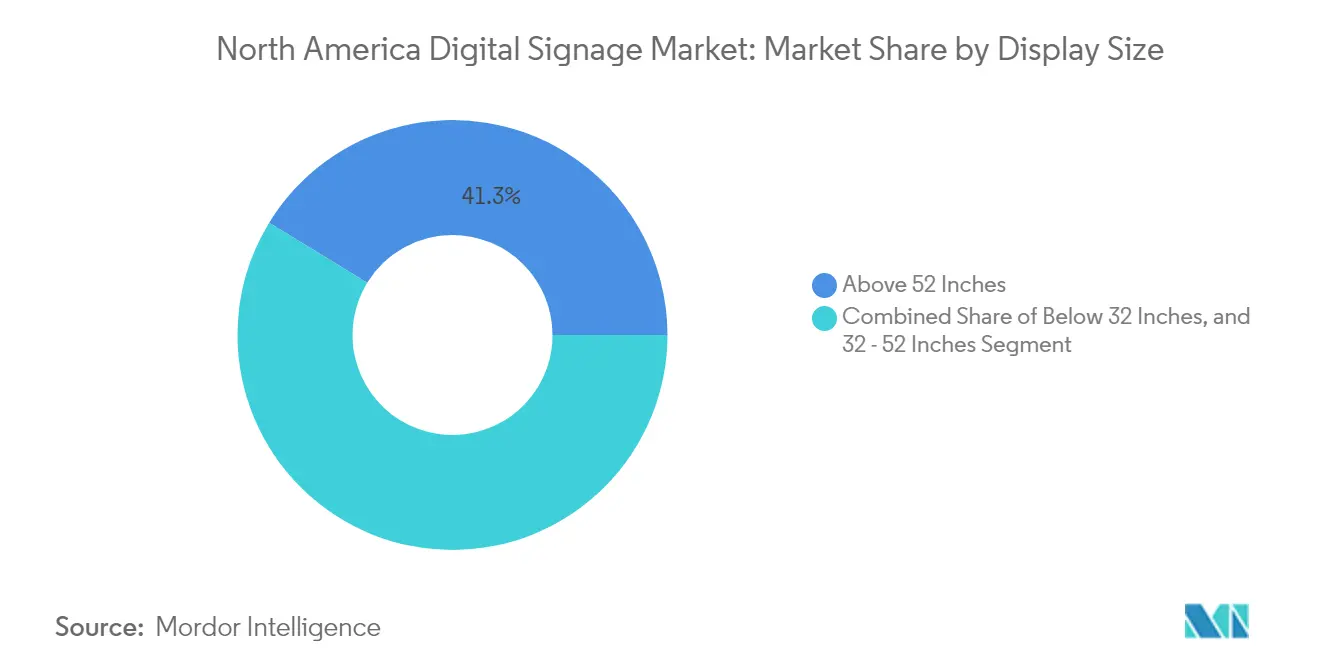
- By display size, above-52-inch formats captured 41.25% of the 2025 North America digital signage market share and are expected to expand at an 8.31% CAGR during the outlook period.
- By installation location, in-store deployments accounted for 68.80% of revenues in 2025; roadside networks are expected to grow at 8.09% CAGR.
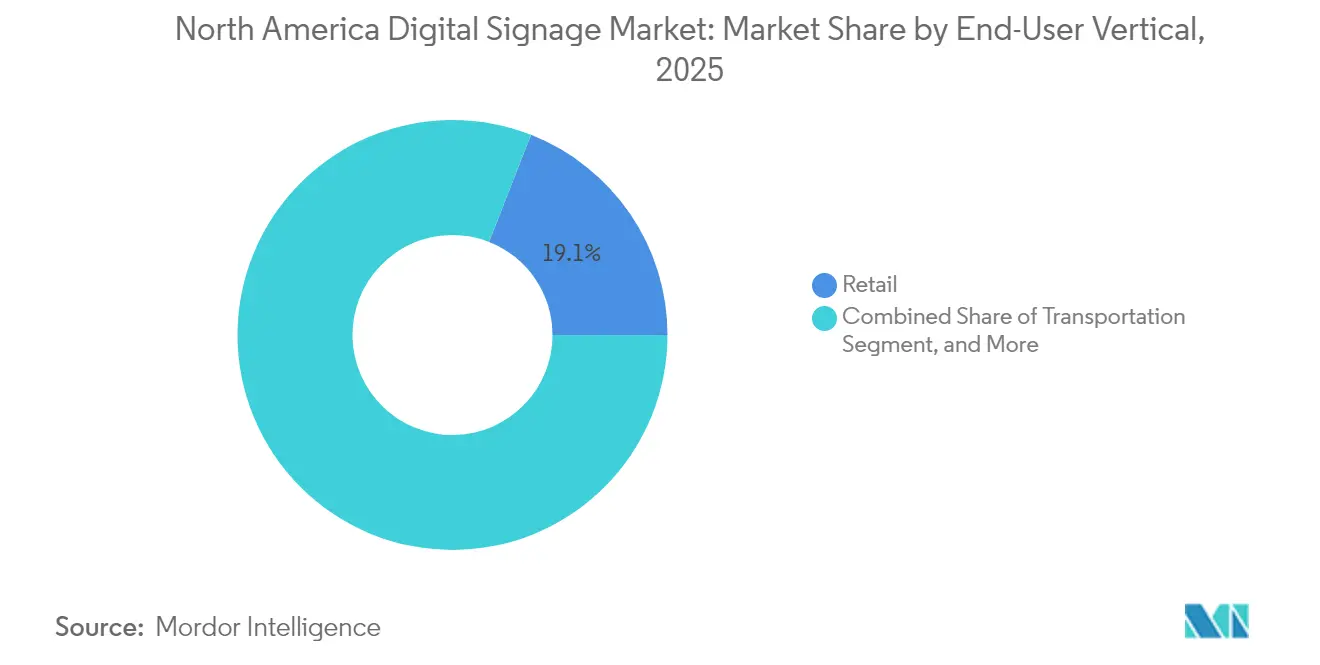
- By end-user, retail held 19.05% of the North America digital signage market size in 2025, whereas transportation records the highest forecast CAGR at 10.48% through 2031.
- By hardware type, LCD and conventional LED kept 46.25% share in the 2025 North America digital signage market share, however,transparent LED are expected to expand at an 11.05% CAGR during the outlook period.
- By country, the United States held 80.25% revenue share in 2025, while Mexico is on track for a 7.82% CAGR thanks to smart-city projects and retail chain expansion.
Note: Market size and forecast figures in this report are generated using Mordor Intelligence’s proprietary estimation framework, updated with the latest available data and insights as of 2026.
North America Digital Signage Market Trends and Insights
Drivers Impact Analysis*
| Driver | (~) % Impact on CAGR Forecast | Geographic Relevance | Impact Timeline |
|---|---|---|---|
| Evolution of turnkey solutions across U.S. retail chains | +1.2% | United States, Canada spillover | Medium term (2-4 years) |
| Context-aware advertising using mobile data | +0.9% | Canada, major U.S. metros | Medium term (2-4 years) |
| 4K/8K video walls in U.S. airports | +0.8% | United States hubs | Short term (≤ 2 years) |
| Smart-city outdoor roll-outs in Mexico | +0.7% | Mexico’s largest cities | Long term (≥ 4 years) |
| LCD price decline benefiting SMBs | +1.1% | Secondary markets across region | Short term (≤ 2 years) |
| Programmatic DOOH platforms | +1.3% | Urban North America | Medium term (2-4 years) |
| Source: Mordor Intelligence | |||
Evolution of Turnkey Solutions Accelerating Deployment Across U.S. Retail Chains
Bundled offerings that combine screens, media players, software, content templates, and remote monitoring have reduced national rollouts by 37% since 2023. Retail groups now standardize experiences across hundreds of stores while tailoring promotions to local inventory levels and conditions. Subscription pricing, rather than capital outlay, encourages the adoption of digital signage among 60% of enterprises that intend to subscribe within two years. Chains adopting this model report 22% higher engagement and an 18% increase in average basket value, confirming the pivot from a cost center to a revenue driver.
Context-Aware Advertising Leveraging Mobile Data Enhances ROI for Canadian Advertisers
Anonymized cellphone signals now feed real-time audience estimates into content schedulers. Canadian pilots show ROI gains of 41% over traditional out-of-home buying, plus 27% higher engagement and 19% conversion lifts in retail settings. Geofencing lets brands retarget exposed passers-by on their phones, knitting together physical impressions and digital follow-ups without storing personal identifiers.
Integration of 4K/8K Video Walls Powers Experiential Venues in Major U.S. Airports
Airports have installed ultra-high-definition canvases that double as art, way-finding, emergency alerts and premium ad slots that fetch 3.8× standard rates. A 10,000-square-foot installation in Dallas Fort Worth incorporates gesture tracking, lifting audience dwell time by 72%. Such dual-use systems justify higher capex through both operational utility and advertising yield.
Smart-City Initiatives Driving Outdoor Digital Signage Roll-outs in Mexican Urban Centers
Mexico City, Monterrey and Guadalajara are wiring weather-proof LED kiosks with environmental sensors, SOS alerts and municipal news feeds. Solar power and battery storage offset grid constraints, trimming operating costs by 31% while attracting private ad partners. A 2025 smart-city accord in Sonora is expected to accelerate similar networks nationwide.[3]FESPA, “Sustainable Solutions in Digital Signage,” fespa.com
Restraints Impact Analysis*
| Restraint | (~) % Impact on CAGR Forecast | Geographic Relevance | Impact Timeline |
|---|---|---|---|
| Privacy Concerns Regarding Location-Based Targeting and Facial Analytics | -0.7% | Canada and United States, particularly in urban centers | Medium term (2-4 years) |
| Rising Energy-Efficiency Regulations for Large-Format Displays | -0.5% | North America, with strongest impact in California and Canada | Long term (≥ 4 years) |
| Supply-Chain Volatility for High-Brightness LED Components | -0.8% | Global, with significant impact on North American pricing | Short term (≤ 2 years) |
| Capex Barriers for Independent QSRs in Rural Areas | -0.4% | Rural regions across North America | Medium term (2-4 years) |
| Source: Mordor Intelligence | |||
Privacy Concerns Regarding Location-Based Targeting and Facial Analytics
State-level U.S. bills and Canada’s Digital Charter are tightening consent rules, forcing vendors to shift from face recognition to anonymous demographic counts. Surveys indicate 68% of Canadian youth oppose facial analysis in commerce, prompting retailers to weigh reputational risk against personalization benefits.
Rising Energy-Efficiency Regulations for Large-Format Displays
ENERGY STAR rules require displays to improve power performance by 4%, adding component costs yet accelerating innovation such as ambient-light sensors and scheduled dimming. Manufacturers answer with e-paper menu boards and zero-power standby modes while balancing brightness demands for sunlit venues.
*Our forecasts treat driver/restraint impacts as directional, not additive. The impact forecasts reflect baseline growth, mix effects, and variable interactions.
Segment Analysis
By Component: Software Platforms Driving Recurring Revenue Models
Hardware captured 56.35% of the North America digital signage market share in 2025, anchored by capital-intensive screens and media players. Despite this lead, the software slice is advancing at an 8.73% CAGR as cloud dashboards, AI scheduling engines, and audience analytics shift buyer focus from one-time installs to lifetime value. Subscription bundles now comprise 43% of platform revenue, aligning vendor incentives with continuous content optimisation. Hardware makers are increasingly pre-loading licenses and managed services, creating a seamless procurement process and freeing retailers from the need to juggle multiple suppliers.
The services tier-covering planning, cabling, calibration, on-site maintenance, and creative design-expands steadily because end-users lack in-house bandwidth to refresh campaigns across sprawling estates. Integrators that manage networks end-to-end win multi-year contracts, locking in predictable annuities while keeping failure rates below service-level thresholds. Edge-AI features embedded in modern media players reduce bandwidth costs and enable localised decisions-such as muting audio during quiet hours or flagging malfunctioning LEDs for proactive repairs.


By Location: Outdoor Innovations Driving Above-Average Growth
Indoor venues held 67.65% of North America digital signage market size in 2025, buoyed by climate-controlled conditions and existing power/data infrastructure. Corporate headquarters, colleges and mall walkways rely on indoor screens for visitor orientation, promotional upsells and employee notices. In response to content fatigue, operators layer touch, gesture or QR interactions, merging in-person and mobile experiences into a single engagement funnel.
Outdoor networks, representing 32.35% of revenue but outpacing overall growth at 9.08% CAGR, benefit from durable casings, auto-dimming and self-cleaning glass treatments. Smart-city pilots add public Wi-Fi, environmental sensors and emergency alerts to justify municipal budgets, while solar-powered totems bring dynamic information to energy-constrained locales. The evolution of remote-diagnostic software slashes truck-roll expenses and lengthens uptime SLAs.
By Display Size: Above 52 Inches Capturing Premium Advertising Inventory
Screens above 52 inches held 41.25% share of the North America digital signage market size in 2025 and keep expanding because high-resolution panels now support near-field viewing. Airport concourses and entertainment arenas rely on tiled video walls to anchor experiential zones. Below-32-inch displays dominate shipment volume thanks to menu boards, shelf-edge tags and elevator screens where distance and physical constraints limit size. Templates emphasise concise copy and bold pricing, reinforcing impulse decisions. The 32-52-inch band balances footprint and readability, becoming the default in QSR order points, office reception areas and healthcare triage stations.
Panels exceeding 52 inches command the lion’s share of high-impact media spend despite lower unit counts. Brands convert complete walls into immersive canvases at stadiums, museums and airport concourses, pairing 4K or 8K resolution with dynamic soundscapes. As pixel density rises, these giants can be viewed at close quarters without grain, unlocking installations in boutiques and corporate atriums previously reserved for printed banners.
By Installation Location: In-Store Deployments Driving Measurable Sales Lift
Retailers report up to 33% sales uplift for items showcased on end-cap displays that rotate creative based on daypart or inventory levels. Centralised control ensures brand consistency across hundreds of branches while preserving flexibility to push local deals. Integrating stock APIs avoids consumer frustration by hiding out-of-stock SKUs and spotlighting overstocked lines.
Roadside and out-of-store units are expected to grow at 8.09% CAGR as programmatic targeting maximizes dwell-time relevance. Roadside billboards, transit shelters and fuel-station canopies are migrating to LED formats that host multiple advertisers through programmatic scheduling. Brightness sensors, redundant power supplies and rugged ratings trim downtime and safeguard safety codes. Linking mobile retargeting to exposure data provides marketers proof of incremental store visits, a metric previously elusive in out-of-home media.
By End-User Vertical: Transportation Sector Leads Growth Through Passenger Experience Enhancement
Retail retained 19.05% of North America digital signage market share in 2025, with loyalty integrations and hyper-local promotions sharpening competitive edges against e-commerce rivals. AI engines match offers to demographic heat-maps, while computer-vision modules verify planogram compliance and dwell time.
Transportation, with a forecast 10.48% CAGR, enhances journey flow through live gate updates, baggage carousel cues and entertainment loops that monetise layover time. Inside taxis and ride-share vehicles, tablets deliver surge-priced offers tied to passenger demography and trip length. Airports retrofit ageing flight-information displays with modular LED ribbons that flex between operational alerts and ad-supported lifestyle content.
By Hardware Type: Transparent LED Displays Redefining Installation Possibilities
LCD and conventional LED kept a 46.25% share in 2025, anchoring mainstream projects thanks to cost efficiency and mature supply chains. Transparent LED displays provide over 80% light transmission, enabling retailers to animate storefront windows without obstructing sightlines and driving double-digit increases in foot traffic. Their dominance secures bulk-procurement economies and simplified spares inventory. Transparent LED sheets, however, are rewriting architectural norms with over 80% light transmission, allowing retailers to animate shop windows without blocking sight-lines. Forecasting a 11.05% CAGR positions the format as the fastest-growing segment of the North America digital signage market, particularly in luxury retail, automotive showrooms, and experiential pop-ups.
OLED enters premium arenas where near-infinite contrast ratios and off-axis clarity justify higher ticket prices. Narrow pixel-pitch LEDs fill control rooms and broadcast sets that view screens at arm’s length, while ruggedised projectors still serve irregular façades and temporary events. Media players graduate from passive playback boxes to miniature edge servers capable of on-device analytics, buffering against connectivity outages, and preserving playback integrity.
Geography Analysis
The United States generated 80.25% of 2025 spending in the North America digital signage market. Robust retail footprints, major transit hubs, and enterprise campuses underpin sustained demand. Recent tariffs encourage local assembly, giving U.S. manufacturers price leverage while prompting foreign vendors to localize production. Energy-compliant hardware and cloud-managed software are penetrating corporate communication workflows, enlarging non-advertising opportunities.
Canada held roughly 12.55% of regional revenue. Advertisers there lead in context-aware campaigns that analyze anonymous mobile signals, achieving ROI lifts that outpace traditional OOH formats. National privacy and energy mandates shape both data usage and hardware specifications, with ENERGY STAR displays posting 4% efficiency gains over baseline models. Market consolidation is under way as domestic operators exit or merge, and ePaper pilots signal a push toward sustainable indoor signage.
Mexico, at 7.20%, is the fastest-growing slice of the North America digital signage market. Urban smart-city frameworks blend public information, emergency alerts, and ad funding in unified kiosks. Foxconn’s Sonora smart-city memorandum illustrates rising foreign investment in civic-tech infrastructure. Knowledge gaps among small merchants persist, yet falling hardware prices and mobile-payment tie-ins continue to expand addressable demand across retail, hospitality, and entertainment venues.
Competitive Landscape
North America digital signage market competition features a blend of diversified electronics giants, cloud-native software houses and specialty integrators. Samsung Electronics, LG Display and SHARP NEC share roughly 43% of revenue, leveraging in-house panels, media players and CMS suites that streamline procurement. Their roadmaps emphasize transparent LED, sub-1-millimeter pixel pitch and energy-optimized power rails.
Independent software vendors such as BrightSign, Poppulo and SignageOS differentiate through hardware-agnostic orchestration, advanced analytics and AI content policing that flags off-brand or outdated messaging automatically. Telecom equipment stalwarts incorporate digital signage modules into broader unified-communications portfolios, blurring lines between boardroom screens and marketing displays.
Tariffs on imported LED sub-components, energy-use caps in California and Ontario, and semiconductor supply disruptions are driving near-shoring and multi-sourcing strategies. Hardware margins compress, so vendors bundle managed services, predictive maintenance and data analytics dashboards to preserve profitability. Partnerships with cloud hyperscalers shorten time-to-market for enterprise buyers seeking elastic capacity and global uptime guarantees.
North America Digital Signage Industry Leaders
Sharp NEC Display Solutions, Ltd.
Samsung Electronics Co. Ltd
LG Display Co. Ltd
Panasonic Corporation
Sony Corporation
- *Disclaimer: Major Players sorted in no particular order

Recent Industry Developments
- March 2025: Poppulo acquired Reach Media Network, adding 9,000 corporate and campus screens plus specialized creative tools to its cloud platform.
- March 2025: Samsung Electronics introduced VXT, a cloud-native B2B suite connecting its displays with real-time monitoring and analytics.
- February 2025: Foxconn agreed to explore Sonora smart-city infrastructure, positioning outdoor kiosks as hubs for public services and commercial media.
- February 2025: LG unveiled Business Cloud, a subscription bundle targeting SMBs with simplified set-up and pre-made content templates.


Research Methodology Framework and Report Scope
Market Definitions and Key Coverage
In our study, the North America digital signage market includes every commercial-grade electronic display, LCD, LED, OLED, projection, and e-paper deployed to show dynamic text, images, or video inside retail stores, transit hubs, corporate campuses, hotels, schools, hospitals, government offices, and entertainment venues.
Scope Exclusions: Home televisions and software-only content management platforms without associated display hardware are not counted.
Segmentation Overview
- By Component
- Hardware
- Software
- Services
- By Location
- Indoor
- Outdoor
- By Display Size
- Below 32 Inches
- 32 - 52 Inches
- Above 52 Inches
- By Installation Location
- In-Store
- Out-of-Store/Roadside
- By End-user Vertical
- Retail
- Transportation
- Hospitality
- Corporate
- Education
- Healthcare
- Government
- Sports and Entertainment Venues
- Other End-user Verticals
- By Hardware Type
- LCD/LED Display
- OLED Display
- Media Players
- Projectors/Projection Screens
- Transparent LED Displays
- Other Hardware Types
- By Country
- United States
- Canada
- Mexico
Detailed Research Methodology and Data Validation
Primary Research
We interview display makers, system integrators, media network owners, and multi-site retailers across the United States, Canada, and Mexico. These conversations clarify purchase cycles, verify channel margins, and test growth assumptions revealed during desk work.
Desk Research
We gather baseline evidence from the US Census, Statistics Canada, the Bureau of Transportation Statistics, and trade bodies such as the Digital Signage Federation. Public customs filings, EnergyStar shipment data, and panel price trackers line up against company 10-Ks, investor decks, Questel patent pulls, Dow Jones Factiva news, and supplier financials on D&B Hoovers. This list is illustrative; many other sources supported data checks.
Our analysts then match import counts with retail and airport floor space data before tying those volumes to digital out-of-home ad spend series, creating an anchored demand curve that guides deeper modeling.
Market-Sizing & Forecasting
A blended top-down and bottom-up model converts shipment and installed base figures into revenue through sampled ASP × volume roll-ups. Variables such as LCD import volumes, store renovation rates, airport passenger throughput, panel price erosion, and software attach ratios feed a multivariate regression that projects demand to 2030. When supplier roll-ups miss niche segments, gap values are imputed from anonymized interview ranges.
Data Validation & Update Cycle
Our outputs face anomaly checks against independent signals like monthly retail footfall and media rate cards, undergo senior review, and refresh yearly, with interim updates triggered by material supply chain or regulatory shifts.
Why Mordor's North America Digital Signage Baseline Inspires Reliable Decisions
We recognize published estimates often diverge because each firm selects different device classes, geographic splits, and pricing ladders.
Some publishers merge Latin American sales into North America, others rely on straight GDP multipliers, and a few apply global ASPs without U.S. premiums. Mordor's yearly recalibration and full Mexico inclusion avoid such skews.
Benchmark comparison
| Market Size | Anonymized source | Primary gap driver |
|---|---|---|
| USD 10.74 B (2025) | Mordor Intelligence | - |
| USD 9.70 B (2024) | Regional Consultancy A | Excludes Mexico and roadside kiosks |
| USD 9.95 B (2024) | Global Consultancy B | Uses global ASP averages |
These contrasts show that Mordor's clear scope selection, variable level testing, and frequent refresh cadence give decision makers a balanced, transparent baseline they can readily trace and reproduce.


Key Questions Answered in the Report
What is the current value of the North America digital signage market?
The market stands at USD 11.57 billion in 2026 and is expected to grow at a 7.69% CAGR to reach USD 16.76 billion by 2031.
Which component category is growing fastest?
Software platforms are expanding the quickest, supported by an 8.73% CAGR as enterprises prefer cloud subscriptions and AI-driven content optimisation
Why are transparent LED displays gaining attention?
They provide over 80% transparency, allowing retailers and architects to turn windows into dynamic media surfaces without blocking light or views.
How do programmatic DOOH platforms improve screen utilisation?
Real-time bidding allocates ad slots based on live audience and environmental data, boosting average screen fill-rates by 32% compared with fixed-schedule selling.
What are the main regulatory challenges?
Tighter privacy laws restrict facial analytics, while ENERGY STAR and state energy codes compel manufacturers to raise power efficiency and manage brightness outdoors.
Which country is projected to grow the fastest in the region?
Mexico leads with a 7.82% CAGR through 2031, driven by smart-city projects and expanding retail footprints.
Page last updated on:


