Market Overview
| Study Period | 2020 - 2031 |
|---|---|
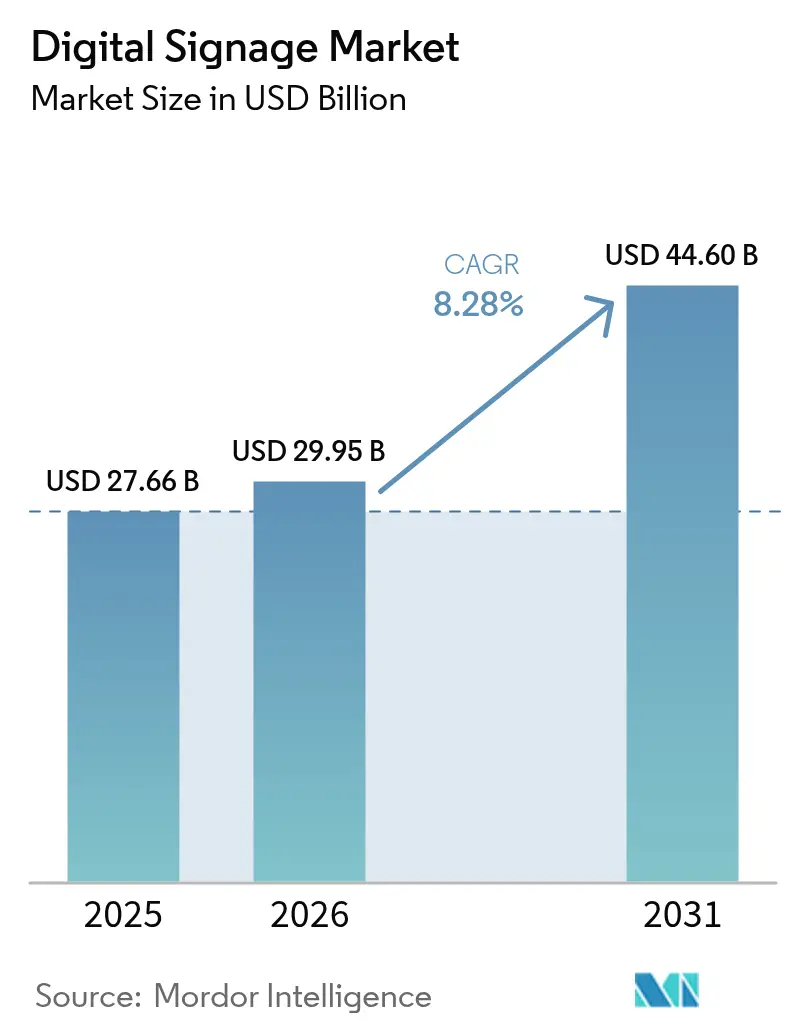
| Market Size (2026) | USD 29.95 Billion |
| Market Size (2031) | USD 44.6 Billion |
| Growth Rate (2026 - 2031) | 8.28% CAGR |
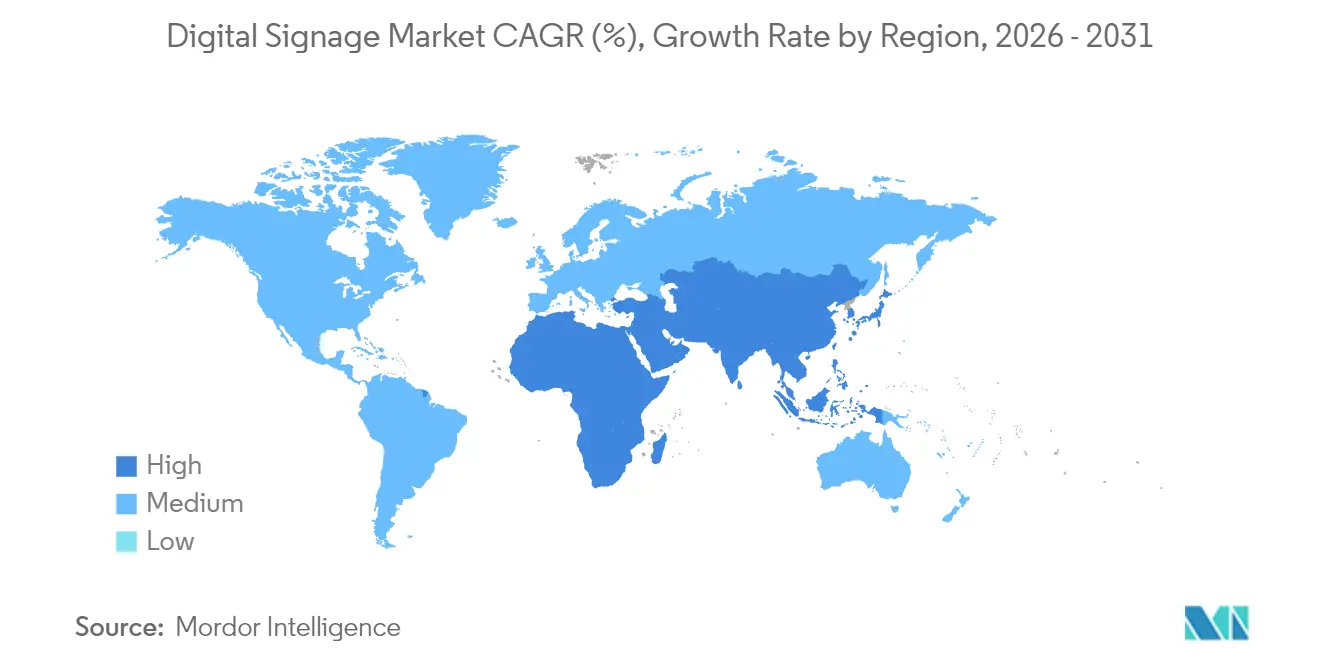
| Fastest Growing Market | Asia |
| Largest Market | North America |
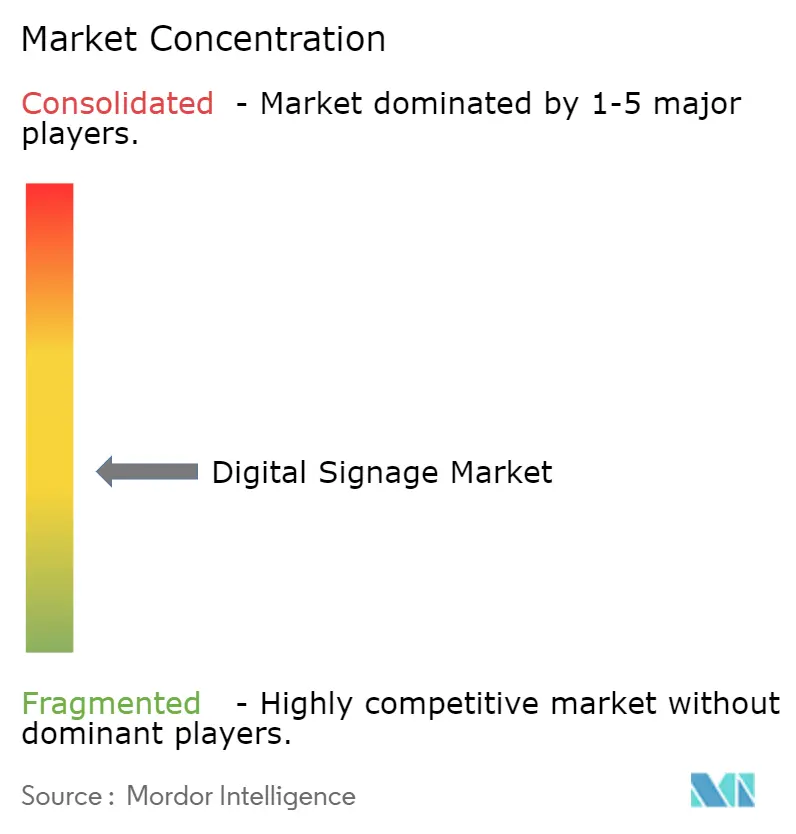
| Market Concentration | Medium |
Major Players*Disclaimer: Major Players sorted in no particular order Image © Mordor Intelligence. Reuse requires attribution under CC BY 4.0. | |
Digital Signage Market Analysis by Mordor Intelligence
Digital signage market size in 2026 is estimated at USD 29.95 billion, growing from 2025 value of USD 27.66 billion with 2031 projections showing USD 44.6 billion, growing at 8.28% CAGR over 2026-2031. Consistent uptake of AI-driven content engines, 5G-enabled edge networks and energy-frugal MicroLED screens underpins this expansion. Large enterprises are using connected displays to unify communications across hybrid workplaces, while city authorities weave interactive boards into smart-city infrastructure to streamline mobility and public safety initiatives. Retailers intensify investment as audience-analytics platforms transform in-store screens into revenue-generating retail-media assets. At the same time, transportation operators deploy real-time passenger information systems that raise service quality.
Key Report Takeaways
- By component, hardware retained 60.12% of 2025 revenue while software is advancing at a 10.39% CAGR through 2031.
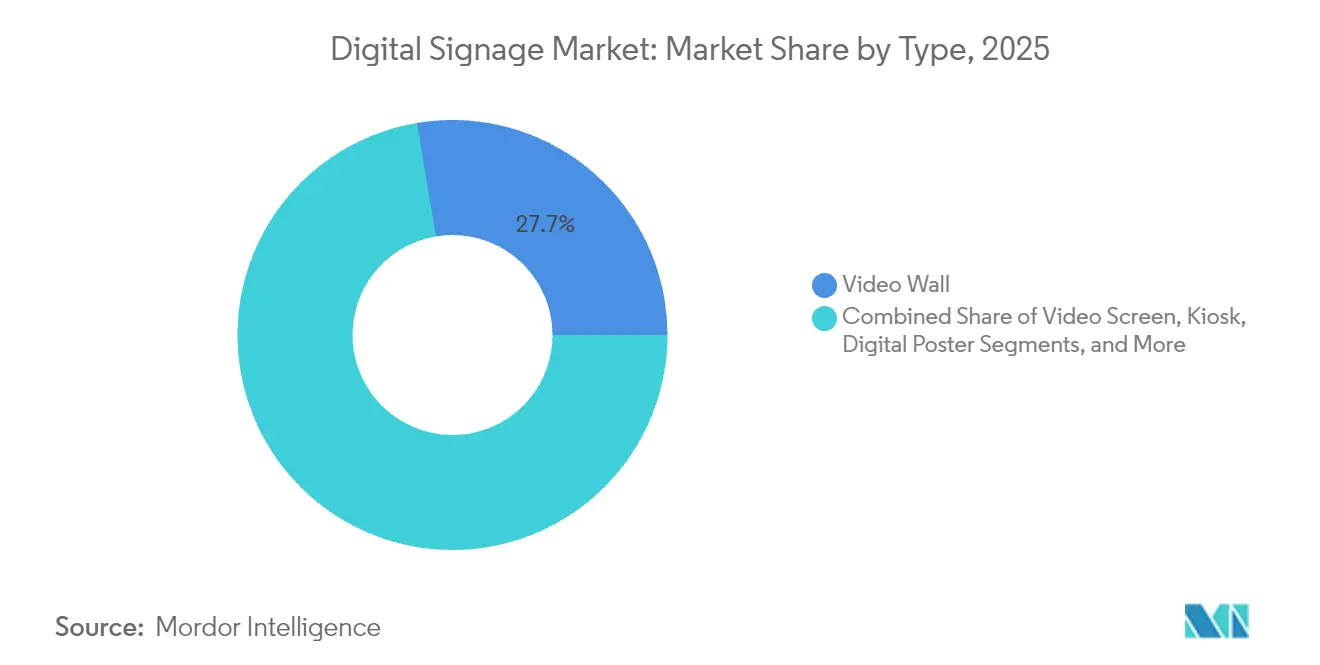
- By type, video walls accounted for 27.65% of the digital signage market share in 2025; kiosks are projected to grow 9.1% per year to 2031.
- By deployment, on-premise systems led with 69.05% revenue in 2025, yet cloud platforms show the fastest 12.54% CAGR outlook.
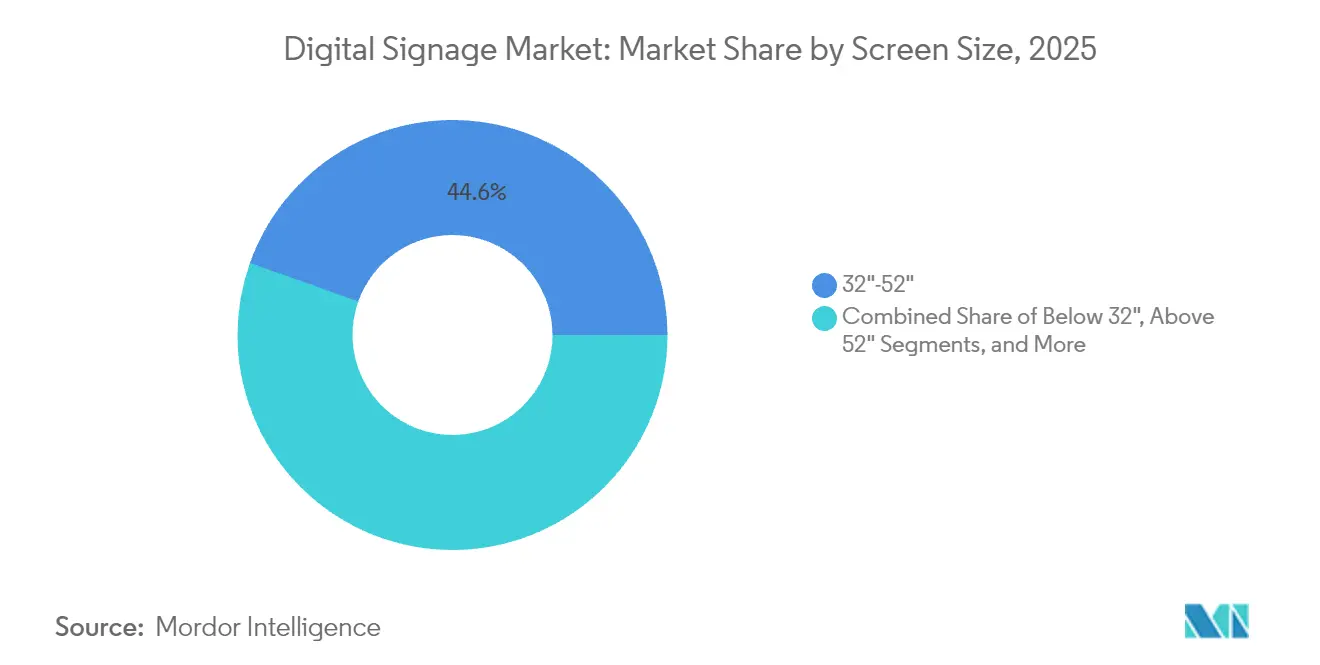
- By screen size, the 32"–52" band captured 44.55% share of the digital signage market size in 2025; screens above 52" are expanding 7.68% annually.
- By location, indoor installations generated 65.92% of 2025 sales, whereas outdoor rollouts are tracking an 8.82% CAGR.
- By end-use, retail held 21.35% revenue in 2025, while transportation displays deliver the quickest 9.19% CAGR through 2031.
- By region, North America commanded 33.08% of 2025 spend; Asia-Pacific leads growth with an 8.42% CAGR to 2031.
Note: Market size and forecast figures in this report are generated using Mordor Intelligence’s proprietary estimation framework, updated with the latest available data and insights as of 2026.
Global Digital Signage Market Trends and Insights
Drivers Impact Analysis*
| Driver | (~) % Impact on CAGR Forecast | Geographic Relevance | Impact Timeline |
|---|---|---|---|
| AI-powered audience analytics | +1.2% | North America and Europe | Medium term (2-4 years) |
| 5G plus edge computing | +1.5% | Asia-Pacific, spill-over to MEA | Short term (≤ 2 years) |
| EU sustainability mandates | +0.8% | Europe | Long term (≥ 4 years) |
| Hybrid work communication dashboards | +1.1% | North America, global spill-over | Medium term (2-4 years) |
| Smart-city mega-projects | +0.9% | Middle East | Long term (≥ 4 years) |
| Retail-media monetisation | +1.3% | Latin America | Medium term (2-4 years) |
| Source: Mordor Intelligence | |||
AI-powered audience analytics boosting dynamic content personalisation
Retailers now replace one-size-fits-all loops with AI engines that adjust messaging in real time when shoppers approach. Computer-vision modules gauge age bracket, gender and engagement length, then trigger creative variants that can lift conversion by as much as 30%. Chains in the United States, United Kingdom, Germany and France link these insights with loyalty-app data to enrich omnichannel campaigns. Agencies pay premium CPMs for such precise exposure, turning store networks into high-margin media channels. Compliance with GDPR shapes rollout pace in Europe, yet vendors embed privacy-by-design workflows that anonymise video frames locally before analysis. These factors keep the digital signage market on a solid medium-term growth path.
5G + edge computing enabling real-time outdoor streaming
Transit authorities in Tokyo, Seoul, Singapore and Sydney use millimetre-wave 5G backbones to push ultra-low-latency video and emergency alerts to outdoor LED boards. On-device edge servers pre-cache high-resolution clips, cutting data transit cost and letting campaigns switch instantly when foot-traffic sensors spike. Studies for Asian transport hubs show productivity gains from 52% to 245% and cost savings up to 90% when 5G replaces legacy fibre.[1]UK Government, “Review of the 5G Ecosystem, Adoption, and Industrial Use Cases in Asia,” assets.publishing.service.gov.uk As more metros activate standalone 5G cores, the digital signage market receives an immediate uplift.
EU corporate sustainability mandates accelerating energy-efficient displays
Brussels rules cap the Energy Efficiency Index of displays and force seven-year spare-part support, steering buyers toward MicroLED and colour e-paper screens. Analysts expect 39 TWh yearly electricity savings by 2030 and 13 million ton CO₂ cut.[2]European Commission, “TV and Electronic Displays,” energy-efficient-products.ec.europa.eu Samsung’s 2025 colour e-paper panel draws 0.00 W for static content, aligning with European procurement checklists. Eco design compliance strengthens the region’s long-term pull on the digital signage market.
Post-pandemic hybrid work models driving cloud dashboards
United States employers trim office footprints yet enhance shared areas with data-rich display clusters. Cloud consoles merge scheduling feeds, video meetings and wellbeing metrics, making multi-site management frictionless. Surveys indicate that 74% of enterprises see digital boards as a path to 50% cost cuts in facility operations. This scenario encourages recurring-revenue software subscriptions that keep the digital signage market expanding into 2027.
Restraints Impact Analysis*
| Restraint | (~) % Impact on CAGR Forecast | Geographic Relevance | Impact Timeline |
|---|---|---|---|
| Fragmented CMS standards | −0.7% | Global | Short term (≤ 2 years) |
| CAPEX and permits for outdoor LED in historical zones | −0.5% | Europe | Long term (≥ 4 years) |
| Cyber-security vulnerabilities in transit displays | −0.4% | North America, spreading globally | Medium term (2-4 years) |
| Specialty driver-IC price spikes | −0.3% | Global | Short term (≤ 2 years) |
| Source: Mordor Intelligence | |||
Fragmented CMS standards complicating multi-vendor interoperability
Global retailers often juggle screens from several brands yet find no common protocol for scheduling or analytics. The International Telecommunication Union warns that the lack of interoperability slows deployments and raises total ownership cost.[3]International Telecommunication Union, “Lack of Standards Threatens Digital Signage Market,” itwire.com Many firms therefore lock into single-vendor ecosystems, limiting competitive bids. Industry alliances are drafting APIs, but diverging roadmaps among vendors keep progress slow. This reality curbs near-term scalability for the digital signage market.
Cyber-security vulnerabilities spotlighted by ransomware on transit displays
Ransomware penetrated United States transit boards, forcing message hijacks that caused public confusion. A Federal Transit Administration advisory ranks dynamic message signs as high-risk assets and recommends network segmentation plus multi-factor access.[4]D O T – Federal Transit Administration, “Cyber and Data Security Report,” transit.dot.gov Extra safeguards add cost and stretch project timelines, briefly dampening growth momentum within the digital signage market.
*Our forecasts treat driver/restraint impacts as directional, not additive. The impact forecasts reflect baseline growth, mix effects, and variable interactions.
Segment Analysis
By Type: Kiosks Drive Interactive Engagement Revolution
Video walls dominated 2025 revenue with 27.65% share due to their immersive impact in control rooms and flagship retail settings. The digital signage market continues to favour their scale for brand theatre and corporate town-hall events. Demand also stays steady for digital posters in quick-serve restaurants because franchisees value simple content swaps.
Kiosks, however, offer the fastest 9.1% CAGR to 2031 as shoppers embrace self-checkout, wayfinding and loyalty enrollment on responsive touchscreens. Retailers in the digital signage market deploy AI modules that recommend add-ons at check-out, nudging ticket size. Transparent LCD enclosures carve a niche in luxury stores and automotive showrooms, merging product visibility with data overlays. Manufacturers now experiment with hybrid rigs that fuse multi-panel video walls and kiosk interaction for transit concourses.


By Component: Software Solutions Accelerate Cloud Migration
Hardware parts generated 60.12% of 2025 turnover and remain foundational to the digital signage market, covering LED tiles, media players and mounting kits. Falling pixel costs keep capex manageable for refresh cycles every four-to-five years.
Software revenue is growing at a double-digit 10.39% CAGR as companies discover that content orchestration and analytics drive ROI. Cloud dashboards secure fleet uptime through remote diagnostics, while AI schedulers improve campaign relevance. Vendors integrate proof-of-play ledgers so advertisers can audit exposures, raising confidence in the digital signage market.
By Deployment: Cloud-Based Solutions Transform Enterprise Operations
On-premise models held 69.05% of 2025 spend because highly regulated sectors such as finance and healthcare still prefer local custody of data. Their dominance keeps the digital signage market grounded in traditional IT patterns.
Cloud services, advancing at 12.54% per year, reshape cost structures by bundling licences, storage and analytics. Hybrid models ease the transition by keeping sensitive files on-site while exploiting elastic cloud scale for non-critical playlists. Vendors reassure buyers with ISO-27001 compliance and optional private-cloud tenants, easing cyber-risk concerns that once stalled the digital signage market.
By Screen Size: Large Formats Capture Premium Applications
Displays between 32" and 52" secured 44.55% 2025 share of the digital signage market size as they fit most gondolas, meeting rooms and hotel lobbies. Their sweet spot balances field of view and energy draw.
Panels above 52" see the highest 7.68% growth as public squares, stadiums and airports crave giant canvases for real-time feeds. New modular MicroLED blocks allow seamless walls over 100" without visible seams, elevating high-end experiences. Supply tightness for oversized LCD glass may raise prices, yet demand in the digital signage market persists because ROI from attention-grabbing impressions remains clear.
By Location: Outdoor Deployments Accelerate Smart City Integration
Indoor environments produced 65.92% 2025 sales and will stay vital for merchandising, corporate messaging and wayfinding. Stable temperatures lengthen component life and simplify service logistics within the digital signage market.
Outdoor installations, climbing 8.82% per year, ride the smart-city wave as mayors deploy connected billboards that switch from ads to evacuation instructions during emergencies. Enhanced brightness, IP-rated enclosures and smart dimming combat glare and power use. Regulations on light pollution in European heritage districts temper some projects, yet Middle-Eastern mega-cities press ahead, sustaining outdoor momentum for the digital signage market.
By End-Use Industry: Transportation Emerges as Growth Leader
Retail captured 21.35% 2025 revenue as brands monetise shelf-edge screens and aisle end-caps. Integration with point-of-sale data boosts cross-sell conversions, generating measurable gains that reinforce investment in the digital signage market.
Transportation displays crest at a 9.19% CAGR as airports, rail and metro hubs adopt journey-management boards combining wayfinding, security alerts and programmatic ads. Edge processors run AI algorithms locally to maintain service even if central links fail. Safety agencies impose cyber baselines, slightly raising costs but not enough to mute upside in the digital signage market.
Geography Analysis
North America held 33.08% 2025 income, anchored by United States corporate refurbishments that turned lobbies into digital-first showcases. Canadian retailers accelerate checkout modernisation, keeping regional demand steady. The digital signage market here benefits from mature cloud infrastructure that reduces deployment friction.
Asia-Pacific is on an 8.42% CAGR trajectory, propelled by China’s city cluster projects, Japan’s technology export push, India’s mall boom and Southeast Asia’s tourism recovery. An integrated supply chain for panels and ICs lowers unit costs, giving regional buyers price latitude that boosts the digital signage market’s penetration.
Europe records stable gains supported by ecodesign mandates and high purchasing power. Historic-district signage caps add compliance effort, yet German and Nordic corporates adopt energy-class A displays, offsetting tourist-zone pauses. Eastern European airports compete for hub status through immersive wayfinding walls, expanding the digital signage market eastward.

Competitive Landscape
Samsung has preserved leadership for 15 consecutive years by marrying proprietary SoC media players with MicroLED, OLED and colour e-paper innovations. LG Display, NEC, Panasonic and Sony contest top-tier project bids with differentiated image processing and service schemes. Their combined share exceeds 55%, giving the digital signage market moderate concentration.
Solution integrators such as Stratacache, BrightSign and Planar embed specialist software that stitches multi-vendor components into turnkey networks. They often win vertical-specific contracts in QSR, education and healthcare, demonstrating space for niche expertise alongside global manufacturers.
R&D now converges on AI-driven scheduling, security-hardened firmware and low-power substrates. Vendors with end-to-end stacks gain edge in multi-year framework deals, while partnerships with cybersecurity firms become routine. This arms race accelerates time-to-market for breakthrough features, sustaining competitive tension within the digital signage market.
Digital Signage Industry Leaders
Samsung Electronics Co. Ltd
Panasonic Corporation
Sony Corporation
NEC Corporation
LG Electronics Inc.
- *Disclaimer: Major Players sorted in no particular order

Recent Industry Developments
- June 2025: Samsung Electronics Australia launched Colour E-Paper and Interactive eBoard ranges for enterprises and schools.
- February 2025: NEOM and DataVolt agreed to build a USD 5 billion net-zero AI factory to support next-gen digital infrastructure.
- February 2025: University of Turku and Cornell University unveiled a model predicting a 10-million-fold OLED brightness leap through polariton engineering.
- January 2025: LG Electronics USA previewed CreateBoard Pro interactive displays for educators at FETC 2025.


Global Digital Signage Market Report Scope
Digital signage happens to be a sub-segment of signage. Technologies like LCD, LED, and projection are used in digital signage to display digital content such as images, video, streaming media, and information. Digital billboards are used in public spaces, transportation systems, museums, stadiums, retail stores, hotels, restaurants, corporate buildings, etc., for wayfinding, exhibitions, marketing, and outdoor advertising.
Digital Signages Market Growth and it is segmented by type (video wall, video screen, kiosk, transparent LCD screen, digital poster), by component (hardware [LCD/LED display, OLED display, media players, projector/projection screens], software, services), by size (below 32, 32 to 52, above 52), by location (in-store, outdoor), by application (retail, transportation, hospitality, corporate, education, government), and by geography (North America, Asia Pacific, Europe, Latin America, Middle East and Africa). The report offers market forecasts and size in value (USD) for all the above segments.
By Type
| Video Wall |
| Video Screen |
| Kiosk |
| Transparent LCD Screen |
| Digital Poster |
| Billboard |
| Other Types |
By Component
| Hardware | LCD/LED Display |
| OLED Display | |
| MicroLED Display | |
| Media Players | |
| Controllers | |
| Projector/Projection Screens | |
| Other Hardware | |
| Software | |
| Services | Installation and Integration |
| Managed Services | |
| Support and Maintenance |
By Deployment
| On-premise |
| Cloud-based |
| Hybrid |
By Screen Size
| Below 32" |
| 32"-52" |
| Above 52" |
| Ultra-large Above 100" |
By Location
| In-store/Indoor |
| Outdoor |
By End-use Industry
| Retail |
| Transportation |
| Hospitality |
| Corporate |
| Education |
| Healthcare |
| Government |
| Sports and Entertainment |
| Banking and Financial Services |
| Manufacturing Facilities |
By Geography
| North America | United States | |
| Canada | ||
| Mexico | ||
| Europe | Germany | |
| United Kingdom | ||
| France | ||
| Nordics | ||
| Rest of Europe | ||
| South America | Brazil | |
| Rest of South America | ||
| Asia-Pacific | China | |
| Japan | ||
| India | ||
| South-East Asia | ||
| Rest of Asia-Pacific | ||
| Middle East and Africa | Middle East | Gulf Cooperation Council Countries |
| Turkey | ||
| Rest of Middle East | ||
| Africa | South Africa | |
| Rest of Africa | ||
| By Type | Video Wall | ||
| Video Screen | |||
| Kiosk | |||
| Transparent LCD Screen | |||
| Digital Poster | |||
| Billboard | |||
| Other Types | |||
| By Component | Hardware | LCD/LED Display | |
| OLED Display | |||
| MicroLED Display | |||
| Media Players | |||
| Controllers | |||
| Projector/Projection Screens | |||
| Other Hardware | |||
| Software | |||
| Services | Installation and Integration | ||
| Managed Services | |||
| Support and Maintenance | |||
| By Deployment | On-premise | ||
| Cloud-based | |||
| Hybrid | |||
| By Screen Size | Below 32" | ||
| 32"-52" | |||
| Above 52" | |||
| Ultra-large Above 100" | |||
| By Location | In-store/Indoor | ||
| Outdoor | |||
| By End-use Industry | Retail | ||
| Transportation | |||
| Hospitality | |||
| Corporate | |||
| Education | |||
| Healthcare | |||
| Government | |||
| Sports and Entertainment | |||
| Banking and Financial Services | |||
| Manufacturing Facilities | |||
| By Geography | North America | United States | |
| Canada | |||
| Mexico | |||
| Europe | Germany | ||
| United Kingdom | |||
| France | |||
| Nordics | |||
| Rest of Europe | |||
| South America | Brazil | ||
| Rest of South America | |||
| Asia-Pacific | China | ||
| Japan | |||
| India | |||
| South-East Asia | |||
| Rest of Asia-Pacific | |||
| Middle East and Africa | Middle East | Gulf Cooperation Council Countries | |
| Turkey | |||
| Rest of Middle East | |||
| Africa | South Africa | ||
| Rest of Africa | |||


Key Questions Answered in the Report
How big is the Digital Signage Market?
The Digital Signage Market size is expected to reach USD 29.95 billion in 2026 and grow at a CAGR of 8.28% to reach USD 44.6 billion by 2031.
Who are the key players in Digital Signage Market?
Samsung Electronics Co. Ltd, Panasonic Corporation, Sony Corporation, NEC Corporation and LG Electronics Inc. are the major companies operating in the Digital Signage Market.
Which is the fastest growing region in Digital Signage Market?
Asia-Pacific is estimated to grow at the highest CAGR over the forecast period (2026-2031).
Which region has the biggest share in Digital Signage Market?
In 2026, the North America accounts for the largest market share in Digital Signage Market.
Page last updated on:


