Market Overview
| Study Period | 2021 - 2031 |
|---|---|
| Forecast Data Period | 2026 - 2031 |
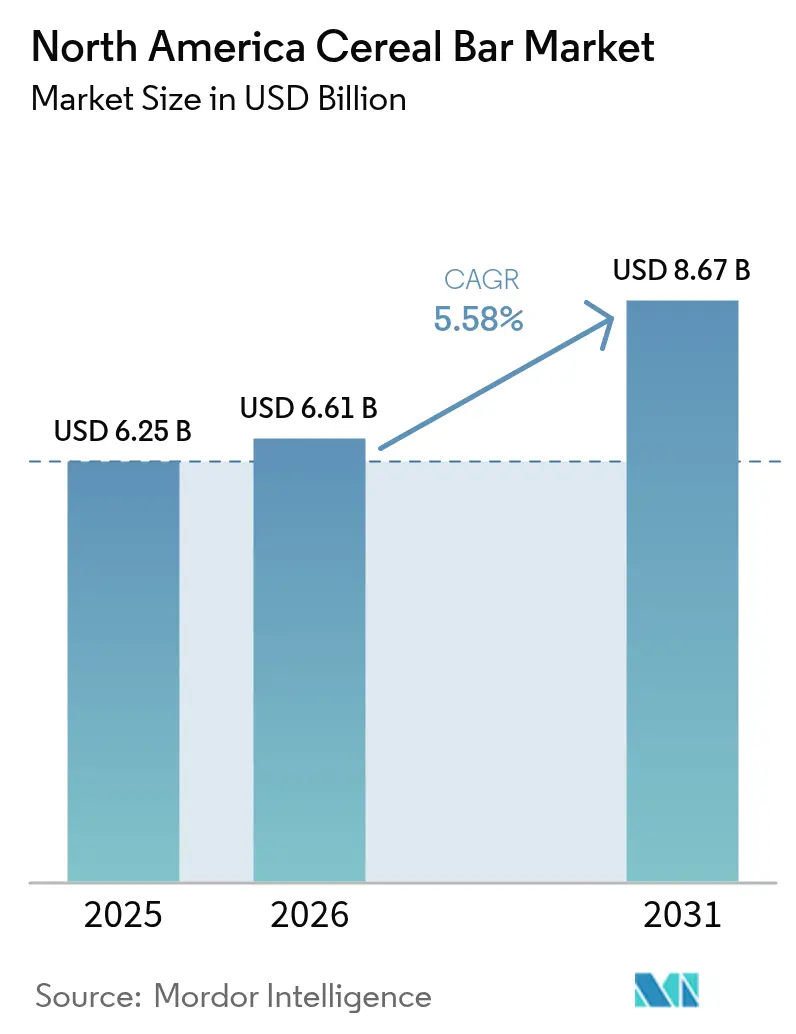
| Base Year Market Size (2025) | USD 6.25 Billion |
| Market Size (2026) | USD 6.61 Billion |
| Market Size (2031) | USD 8.67 Billion |
| Growth Rate (2026 - 2031) | 5.58% CAGR |
| Market Concentration | Medium |
Major Players
*Disclaimer: Major Players sorted in no particular order Image © Mordor Intelligence. Reuse requires attribution under CC BY 4.0. |
|
North America Cereal Bar Market Analysis by Mordor Intelligence
The North America Cereal Bar Market size is projected to be USD 6.25 billion in 2025, USD 6.61 billion in 2026, and reach USD 8.67 billion by 2031, growing at a CAGR of 5.58% from 2026 to 2031. This growth, driven by a CAGR of 5.58% from 2027 to 2031, highlights a significant shift in consumer snacking habits. Consumers now emphasize portability and functional nutrition over traditional taste preferences. The market thrives where protein density, clean-label ingredients, and minimal processing intersect. As a result, brands are removing artificial sweeteners and saturated fats while incorporating whole-food protein sources. With 71% of U.S. shoppers actively aiming to increase their protein intake, protein fortification has become a standard expectation. However, the primary challenge for brands lies in ensuring transparency in sourcing, meeting sustainability goals, and complying with regulatory standards. The competitive landscape is further shaped by major mergers and acquisitions, such as Mars' USD 35.9 billion acquisition of Kellanova and Ferrero's pending USD 3.1 billion purchase of WK Kellogg, reflecting the industry's drive to build diverse portfolios that cater to both indulgent and functional snacking needs.
Key Report Takeaways
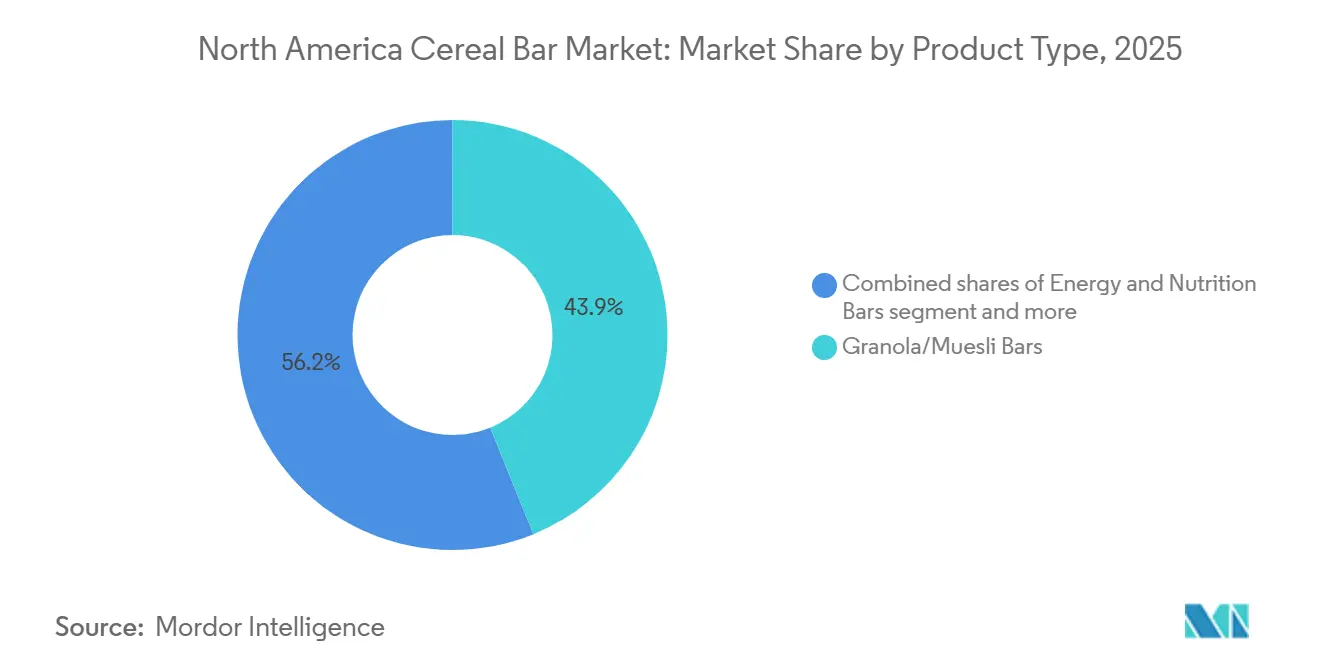
- By product type, granola and muesli bars led with 43.85% of North America cereal bar market share in 2025, while energy and nutrition bars are advancing at a 6.58% CAGR to 2031.
- By functional claim, conventional products accounted for 76.81% share of the North America cereal bar market size in 2025; organic variants are projected to expand at 7.29% CAGR through 2031.
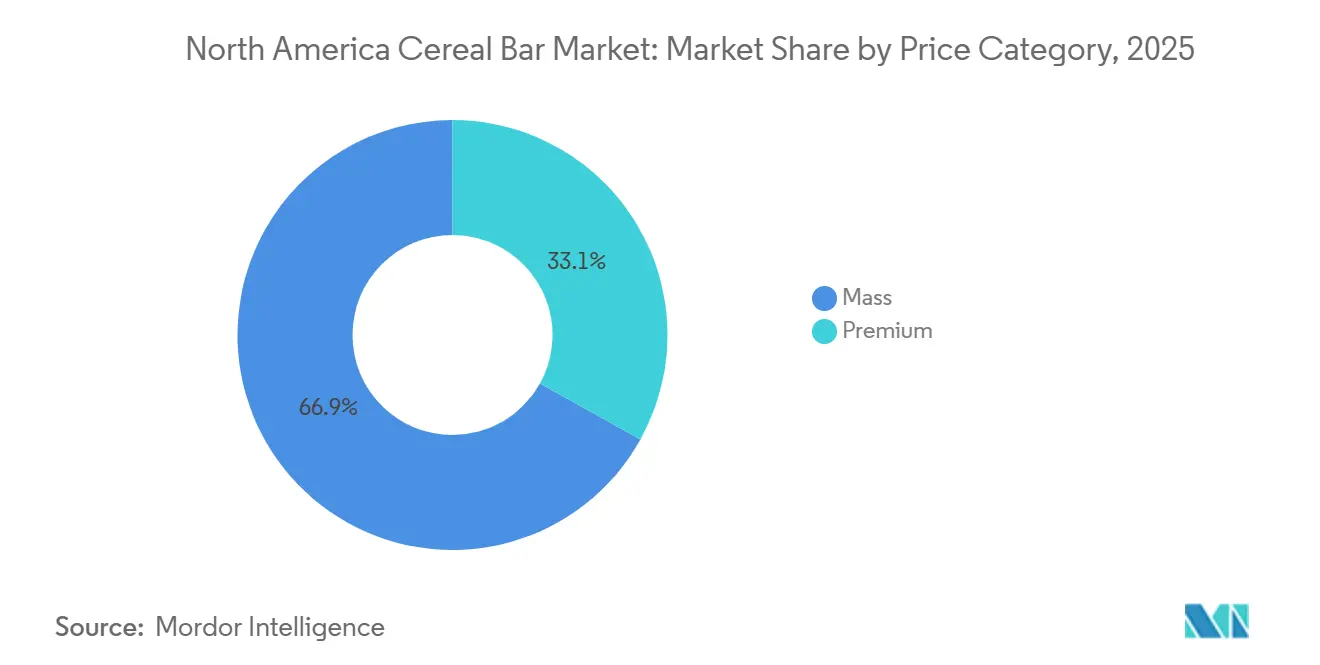
- By price category, the mass segment held 66.92% share in 2025, whereas premium bars are forecast to grow at 7.49% CAGR over 2027-2031.
- By distribution channel, supermarkets and hypermarkets represented 39.03% revenue share in 2025, and e-commerce outlets are expanding at 7.47% CAGR to 2031.
- By geography, the United States commanded 76.58% North America cereal bar market share in 2025; Mexico is set to register the fastest 7.15% CAGR through 2031.
Note: Market size and forecast figures in this report are generated using Mordor Intelligence’s proprietary estimation framework, updated with the latest available data and insights as of 2026.
North America Cereal Bar Market Trends and Insights
Drivers Impact Analysis*
| Driver | (~) % Impact on CAGR Forecast | Geographic Relevance | Impact Timeline |
|---|---|---|---|
| Busy lifestyles and on-the-go snacking boosting demand for portable, nutritionally dense products | +1.2% | United States, Canada, urban Mexico | Short term (≤ 2 years) |
| Expansion of clean label and non-GMO product offerings | +0.9% | United States, Canada, premium segments in Mexico | Medium term (2-4 years) |
| Growth in plant-based and vegan product lines | +0.8% | United States West Coast, Canada, urban centers | Medium term (2-4 years) |
| Increase in sports, fitness, and outdoor activity participation | +1.0% | United States, Canada, emerging in Mexico | Short term (≤ 2 years) |
| Rise of gluten-free, allergy-friendly, and specialty diet formats | +0.6% | United States, Canada, niche demand in Mexico | Long term (≥ 4 years) |
| Rising health consciousness and focus on functional nutrition | +1.3% | Global, strongest in United States and Canada | Short term (≤ 2 years) |
| Source: Mordor Intelligence | |||


Busy lifestyles and on-the-go snacking boosting demand for portable, nutritionally dense products
With the decline of structured meal occasions and the rise of grazing patterns, cereal bars have evolved from occasional treats to essential meal replacements. This trend is particularly evident among dual-income households and Gen Z consumers, who prioritize convenience while meeting their macronutrient needs. In 2024, the International Food Information Council reported that 56% of Americans are replacing traditional meals with snacking or smaller meals[1]Source: International Food Information Council, "American Consumer Perceptions of Snacking", ific.org . To cater to the growing preference for savory flavors, manufacturers are moving beyond traditional honey-oat formulations. For instance, General Mills launched its Nature Valley Smoky BBQ and Everything Bagel variants in January 2024. This shift toward flavor diversification is a strategic effort to capture eating occasions such as mid-morning desk snacks, post-workout refueling, and late-night cravings, which were previously dominated by chips and jerky. Additionally, the need for portability is driving advancements in single-serve packaging. Resealable pouches and portion-controlled multipacks are gaining popularity in convenience stores, where impulse purchases significantly contribute to sales volume.
Expansion of clean label and non-GMO product offerings
Ingredient transparency has shifted from being a distinctive selling point to an essential consumer demand. In the current market, the competitive advantage lies in clearly explaining the rationale behind the exclusion of specific ingredients, rather than merely listing the ones included. The FDA's revised definition of "healthy," set to take effect in February 2028, will necessitate significant reformulations across various product categories, particularly for those that rely on added sugars or saturated fats to enhance flavor. Brands that take early action to reformulate their products can leverage this compliance as a testament to their commitment to quality and health standards. Conversely, brands that delay these changes may face the risk of being removed from retailer shelves, especially as retailers increasingly prioritize healthier product assortments. Additionally, the growing clean-label movement aligns closely with the integration of upcycled ingredients. By incorporating materials such as rescued fruit pulp or spent grain, manufacturers not only minimize waste but also actively support circular-economy principles. This approach strongly appeals to environmentally conscious consumers, who are often willing to pay a premium for products that emphasize sustainability and responsible practices.
Growth in plant-based and vegan product lines
Plant-based protein fortification has shifted from being a niche vegan option to a widely adopted strategy. This change is primarily influenced by flexitarian consumers who, while not fully giving up animal products, are increasingly choosing plant-based alternatives for better digestive tolerance and environmental benefits. According to the Good Food Institute, the U.S. plant-based food industry has undergone significant growth and transformation over the past decade. In 2024, plant-based foods represented 1.1% of total retail food and beverage sales in the United States[2]Source: Good Food Institute, “U.S. retail market insights for the plant-based industry,” gfi.org. To cater to this growing audience, Nature's Path introduced its 2025 Protein Granola line, which delivers 10 grams of plant-based protein per serving, focusing on flexitarians rather than the smaller vegan market. This approach demonstrates that plant-based claims not only secure shelf space in natural and organic sections, where conventional dairy bars often face skepticism, but also create opportunities for cross-merchandising in sports nutrition aisles, traditionally dominated by whey protein. Ingredient innovations using pea, pumpkin seed, and quinoa proteins have resolved the chalky mouthfeel issues seen in earlier plant-based bars. With advancements in texture-masking technologies, these bars now match the quality of dairy-based options. However, the segment faces challenges, particularly consumer concerns about the intensive processing of many plant proteins. This can threaten clean-label positioning, making it essential for brands to transparently disclose their sourcing and extraction processes.
Increase in sports, fitness, and outdoor activity participation
In 2024, 77 million Americans, or 25% of individuals aged six and older, were members of gyms, studios, or fitness facilities, according to the Health and Fitness Association (HFA)[3]Source: Health and Fitness Association, "One in Four Americans Belonged to a Gym in 2024", healthandfitness.org. This increase in fitness participation highlights a broader trend: casual gym-goers and weekend hikers are adopting fueling strategies that were once exclusive to elite athletes. This shift is broadening the market for energy and nutrition bars, extending beyond niche specialty channels. Reflecting this evolution in sports nutrition, General Mills introduced its Nature Valley Protein Smoothie Bars in January 2024. Containing 10 grams of protein, these bars are positioned as breakfast replacements rather than solely pre-workout options. Brands are increasingly focusing on taste and convenience over pure functionality. Modern consumers prioritize flavor and portability, often accepting lower protein density to avoid the chalky texture associated with isolate-heavy formulations. Additionally, the rise in outdoor recreation has driven demand for lightweight, non-perishable snacks that can withstand temperature changes. This preference benefits bars with minimal chocolate coatings, which are less likely to melt in backpacks. While the growing adoption of GLP-1 weight-loss drugs may reduce snacking frequency and pose challenges for the category, protein-rich bars could gain traction as satiating options for managing appetite between meals.
Restraints Impact Analysis*
| Restraint | (~) % Impact on CAGR Forecast | Geographic Relevance | Impact Timeline |
|---|---|---|---|
| Regulatory changes for labeling, health claims, and allergens | -0.5% | United States, Canada, Mexico (NOM-051) | Medium term (2-4 years) |
| Fluctuating raw material costs | -0.7% | Global, particularly United States and Canada | Short term (≤ 2 years) |
| Challenges in scaling new formulations for mass production | -0.4% | United States, Canada, innovation-focused brands | Medium term (2-4 years) |
| Consumer skepticism over processed food health benefits | -0.6% | United States, Canada, educated urban consumers | Long term (≥ 4 years) |
| Source: Mordor Intelligence | |||
Regulatory changes for labeling, health claims, and allergens
The FDA's February 2028 deadline for its updated "healthy" label compresses the reformulation timeline for brands that previously relied on fortification to compensate for nutritionally weak base recipes. This has created a divide between proactive innovators and reactive laggards, with the latter facing delisting risks as retailers prioritize healthier product assortments. In Mexico, the NOM-051 regulation requires front-of-pack warning octagons for products exceeding thresholds for calories, sugar, sodium, saturated fat, and trans fat. This has already driven significant reformulation efforts across the market. Non-compliant brands risk losing access to school cafeterias and face consumer stigma due to visible warning labels. The strategic implication is clear: regulatory compliance is becoming a competitive advantage. Brands achieving clean labels and meeting "healthy" claim criteria can command premium pricing and secure favorable shelf placement. Conversely, those delaying investments face margin pressures from last-minute reformulation costs. Smaller players without sufficient research and development budgets may exit the market or seek acquisition by larger companies with regulatory expertise, accelerating industry consolidation.
Challenges in scaling new formulations for mass production
Clean-label reformulation presents significant challenges for manufacturers. As they eliminate synthetic preservatives, emulsifiers, and flavor enhancers, ingredients previously used to mask variability, they face difficulties in extending shelf life, preserving texture, and maintaining consistent taste. To address these issues, manufacturers are adopting advanced processing technologies such as high-pressure processing, natural antimicrobials, and modified atmosphere packaging. However, these solutions require substantial capital investment, which smaller players often cannot justify without securing volume commitments from retailers. Scaling up is particularly challenging in the plant-based protein bar segment. Proteins sourced from peas and pumpkin seeds exhibit batch-to-batch variations in flavor and texture, necessitating stringent quality control and potentially leading to higher scrap rates during production ramp-up. Brands launching limited-edition or seasonal SKUs encounter additional obstacles, as frequent changeovers reduce line efficiency and increase per-unit costs. This dynamic limits profitability unless premium pricing can be achieved. Strategically, this environment indicates that innovation is increasingly dominated by larger players with dedicated research and development facilities and co-manufacturing partnerships. Meanwhile, smaller brands face longer time-to-market and higher failure rates.
*Our forecasts treat driver/restraint impacts as directional, not additive. The impact forecasts reflect baseline growth, mix effects, and variable interactions.
Segment Analysis
By Product Type: Energy Bars Overtake Legacy Granola
Energy and nutrition bars, experiencing a robust 6.58% CAGR, are steadily narrowing the gap with granola leaders. These bars are formulated with a strategic combination of 10-12 g of protein, sourced from pea, soy, or whey isolates, and 23 g of whole grains. This formulation delivers a balanced macronutrient profile that appeals not only to sports enthusiasts but also to a wider demographic seeking convenient and nutritious snack options. In contrast, granola and muesli bars, while maintaining a significant 43.85% market share, are witnessing slower growth. This slowdown is attributed to increasing competition from savory and high-protein alternatives, which are gaining traction among health-conscious consumers. To counter this trend, established players in the category are innovating by introducing grain-forward SKUs that avoid artificial binders and leverage natural humectants to enhance shelf life.
Consumer behavior trends reveal a significant shift in breakfast habits, with traditional routines giving way to more mobile and convenient formats. Parents are increasingly replacing conventional bowl-and-milk cereals with soft-baked oat bars. These bars not only fulfill whole-grain dietary requirements but also come in 90-calorie portions, making them an ideal choice for children’s lunch boxes. Additionally, evening snacking patterns are evolving, with a growing preference for nut-seed clusters marketed for their calming magnesium content. This shift underscores the rising demand for snacks that offer functional health benefits. In the North American cereal bar market, brands that clearly define their value propositions, whether focused on satiety, energy, or indulgence, are outperforming competitors that rely on generic “anytime snack” positioning.


By Functional Claim: Organic Faster, Conventional Larger
Supermarkets, supported by extensive price promotions and widespread availability, have driven conventional SKUs to dominate the market with a significant 76.81% share. In contrast, organic volumes are experiencing a strong growth trajectory, with a compound annual growth rate (CAGR) of 7.29%, reflecting a clear shift towards premiumization. Certifications such as USDA Organic and Non-GMO Project, prominently displayed on packaging, enhance the appeal of organic bars to environmentally conscious consumers who are willing to pay a higher price for quality and sustainability. By 2031, organic bars are expected to strengthen their presence in urban natural-channel retail settings, further solidifying their position in North America's cereal bar market.
Despite this growth, sourcing complexities remain a significant challenge. Organic ingredients like honey, almonds, and oats incur cost premiums ranging from 8% to 15%. However, the adoption of regenerative agriculture practices is helping to mitigate these costs by reducing fertilizer expenses and improving long-term crop yields, gradually narrowing the cost disparity. Industry leaders are addressing ingredient variability by employing in-house roasting techniques and developing proprietary flavor infusions, effectively maintaining product consistency without relying on synthetic emulsifiers. Meanwhile, conventional producers are exploring mid-cycle reformulations to comply with NOM-051 labeling regulations, which aim to avoid the use of warning octagons. This trend indicates a gradual convergence between conventional and organic claims over time, as both segments adapt to evolving consumer preferences and regulatory requirements.
By Price Category: Mass Volume Versus Premium Margins
In 2025, the mass tier accounted for a significant 66.92% market share, primarily driven by the success of private-label promotions and the popularity of multi-pack offerings. These strategies have effectively catered to cost-conscious consumers seeking value for money. On the other hand, premium bars are forecasted to grow at an impressive 7.49% CAGR, fueled by increasing consumer demand for products emphasizing ingredient transparency, small-batch production stories, and direct-to-consumer sales channels. These factors collectively justify the higher price points of premium offerings. Additionally, subscription models are gaining traction by combining the convenience of regular pantry restocking with loyalty rewards, fostering customer retention and ensuring repeat purchases at favorable profit margins.
Inflation has intensified the divide among shoppers, with cost-sensitive families shifting their preferences toward warehouse clubs and retailer brands to manage expenses. In contrast, affluent consumers are prioritizing products with certifications such as Regenerative Organic Certified, reflecting their focus on sustainability and quality. To sustain their value perception, premium brands are increasingly investing in eco-friendly initiatives, such as recyclable packaging and commitments to carbon-neutral shipping. The North America cereal bar market outlook indicates a growing polarization, where mid-priced brands face the risk of being squeezed out unless they strategically reposition themselves to align with either the value-driven or premium segments.
By Distribution Channel: Digital Momentum
In 2025, supermarkets and hypermarkets contributed 39.03% of the total revenue in the cereal bar market. However, average foot traffic in these outlets has stagnated as consumer shopping preferences increasingly shift toward online platforms. E-commerce channels are witnessing robust growth, with a compound annual growth rate (CAGR) of 7.47%, driving significant digital expansion in North America's cereal bar market. Platforms like Amazon's Subscribe and Save and brand-owned online stores have effectively removed traditional slotting-fee barriers, enabling smaller players to access national audiences rapidly and efficiently.
Convenience stores continue to be a critical channel for catering to impulse purchases and travel-snack needs, particularly in high-traffic commuter areas. Strategic merchandising, such as placing traditional granola bars at eye level near coffee counters, helps sustain sales velocity. Additionally, gas stations are innovating by introducing refrigerated fixtures for high-protein bars, strategically positioned next to energy drinks to attract health-conscious consumers. Omnichannel brands are leveraging QR codes on product packaging to drive repeat purchases through online channels while simultaneously collecting valuable first-party data. This data enables brands to deliver personalized offers, enhancing customer engagement and loyalty.
Geography Analysis
In North America's cereal bar market, the U.S. holds a dominant 76.58% share of the revenue. This highlights the extensive grocery distribution network in the United States and a strong preference for snacking. However, growth is slowing as the market nears saturation and discussions around ultra-processed foods impact volumes. The FDA's upcoming "healthy" claim criteria have triggered a reformulation race among brands. Early adopters of compliant formulations are expected to secure better shelf placement and mitigate litigation risks. Additionally, e-commerce, particularly through loyalty programs and bulk snack subscriptions, is helping premium brands counter slower sales in traditional brick-and-mortar stores.
Mexico is the fastest-growing market in the region, with a 7.15% CAGR. This growth is driven by NOM-051 warning labels targeting products high in sugar and sodium. Reformulated bars that avoid these labels are capitalizing on the rising urban middle class and increasing gym memberships. The U.S. already supplies 66% of Mexico's cereal imports, giving American brands a logistical advantage if their formulations meet local requirements. Modern trade channels, such as supermarkets, convenience stores, and gas station mini-supers, account significant distribution and are increasingly allocating secondary placements to healthier SKUs.
Canada is experiencing steady mid-single-digit growth, supported by bilingual labeling requirements and CFIA regulations. Organic and gluten-free bars are gaining popularity, aided by nationwide health-claim education campaigns. Domestic producers are leveraging co-branding opportunities with oats and maple syrup to emphasize product origin. Meanwhile, the rest of North America, including Central America and the Caribbean, remains underdeveloped but presents long-term growth potential. Tailoring affordable, portion-controlled bars to local tropical flavor preferences, such as coconut, guava, and plantain, could unlock opportunities in these markets.
Competitive Landscape
The North American cereal bar market is moderately consolidated, with a limited number of multinational Consumer Packaged Goods (CPG) companies controlling the majority of market volume. Although established brands dominate the market, smaller, emerging players still have significant opportunities in premium and functional niches. In a major development, Mars acquired Kellanova for USD 35.9 billion in August 2024. This acquisition created a snacking giant for Mars, incorporating popular brands such as Nature Valley, Kashi, RXBar, KIND, and Clif Bar. These brands cater to various price points, offer diverse functional benefits, and operate across multiple distribution channels. Through this consolidation, Mars can streamline its operations by sharing research and development costs across its portfolio, negotiating better slotting fees with retailers, and implementing cross-brand promotions to protect shelf space from private-label competitors.
Another key transaction in the market was Mondelez International's acquisition of a majority stake in Perfect Snacks in June 2024. Perfect Snacks, a refrigerated protein-bar brand, is available in over 27,000 retail locations across the United States. This acquisition highlights the increasing focus of large CPG companies on refrigerated, plant-based formats, which typically command a 30% to 40% price premium over ambient stock-keeping units (SKUs). This move reflects a broader industry shift toward innovative product formats that align with evolving consumer demands for healthier and more sustainable options.
Growth opportunities in the cereal bar market are particularly prominent in refrigerated bars, grain-free formulations, and the use of upcycled ingredients. Emerging disruptors like Three Wishes are leveraging these trends by launching innovative products such as grain-free granola bars, now available at Target. These bars, made from nuts and seeds, provide 6 grams of protein and 3 grams of sugar per serving while excluding traditional ingredients like wheat, rice, corn, and oats. This formulation is designed to attract health-conscious consumers, including those following paleo and Whole30 diets, showcasing the potential for niche products to succeed in a competitive market.
North America Cereal Bar Industry Leaders
-
General Mills Inc.
-
Kellanova
-
PepsiCo, Inc.
-
Mondelez International, Inc.
-
Mars, Incorporated
- *Disclaimer: Major Players sorted in no particular order

Recent Industry Developments
- January 2026: Kellogg's has launched the Nutri-Grain Crunchy bar, made with a nutritious blend of oats, barley, buckwheat, rye, and quinoa. The company highlights that these bars are Non-GMO, peanut-free, and do not contain high fructose corn syrup or artificial flavors and colors.
- November 2025: Cerealto acquired a majority stake in Fresca Foods, establishing a strong U.S. manufacturing presence. This partnership accelerates Cerealto’s entry into the fast-growing North American snack bar market and expands capabilities in natural and organic snacking segments.
- November 2024: 1440 Foods acquired FITCRUNCH to strengthen its portfolio of protein-rich snack bars, expanding its position in North America's active nutrition segment and enhancing reach across retail channels with complementary product innovation capabilities.
- April 2024: Seven Sundays launched Real Cocoa Sunflower Cereal in US Costco stores, targeting health-conscious consumers. The product features grain-free, upcycled ingredients and plant protein, reflecting innovation and expansion within the North America cereal and snack market.


North America Cereal Bar Market Report Scope
A cereal bar is a portable, ready-to-eat snack made from compressed grains. The North America cereal bar market is segmented by product type, functional claim, distribution channel, and geography. By product type, the market is segmented into granola/muesli bars, energy and nutrition bars, and others. By functional claim, the market is segmented into organic and conventional. By price category, the market is segmented into mass and premium. By distribution channel, the market is segmented into supermarket/hypermarket, online retail store, convenience store, and other distribution channels. By geography, the market is segmented into the United States, Canada, Mexico, Rest of North America. For each segment, the market forecasts are provided in terms of value (USD) and volume (Tons).
By Product Type
| Granola/Muesli Bars |
| Energy and Nutrition Bars |
| Others |
By Functional Claim
| Organic |
| Conventional |
By Price Category
| Mass |
| Premium |
By Distribution Channel
| Supermarket/Hypermarket |
| Online Retail Store |
| Convenience Store |
| Other Distribution Channels |
By Geography
| United States |
| Canada |
| Mexico |
| Rest of North America |
| By Product Type | Granola/Muesli Bars |
| Energy and Nutrition Bars | |
| Others | |
| By Functional Claim | Organic |
| Conventional | |
| By Price Category | Mass |
| Premium | |
| By Distribution Channel | Supermarket/Hypermarket |
| Online Retail Store | |
| Convenience Store | |
| Other Distribution Channels | |
| By Geography | United States |
| Canada | |
| Mexico | |
| Rest of North America |


Market Definition
- Milk and White Chocolate - Milk chocolates is a solid chocolate made with milk (in the form of either milk powder, liquid milk, or condensed milk) and cocoa solids. White chocolate is made from cocoa butter and milk and contains no cocoa solids whatsoever. The scope includes regular chocolates, low-sugar, and sugar-free variants
- Toffees & Nougats - Toffees include hard, chewy, and small or one-bite candies marketed with labels as toffee or toffee-like confectionery. Nougat is a chewy confection with almond, sugar, and egg white as a basic ingredient; and it originated in Europe and Middle East countries.
- Cereals Bars - A snack composed of breakfast cereal that has been compressed into a bar shape and is held together with a form of edible adhesive. The scope includes snack bars made with cereals such as rice, oats, corn, etc. mixed with a binding syrup. These also include products labeled as cereal bars, cereal treat bars, or grain bars.
- Chewing Gum - This is a preparation for chewing, usually made of flavored and sweetened chicle or such substitutes as polyvinyl acetate. The types of chewing gums included in the scope are sugar-chewing gums and sugar-free chewing gums
| Keyword | Definition |
|---|---|
| Dark Chocolate | Dark chocolate is a form of chocolate containing cocoa solids and cocoa butter without the milk. |
| White Chocolate | White chocolate is the type of chocolate containing the highest percentage of milk solids, typically around or over 30 percent. |
| Milk Chocolate | Milk chocolate is made from dark chocolate that has a low cocoa solid content and higher sugar content, plus a milk product. |
| Hard Candy | A candy made of sugar and corn syrup boiled without crystallizing. |
| Toffees | A hard, chewy, often brown sweet that is made from sugar boiled with butter. |
| Nougats | A chewy or brittle candy containing almonds or other nuts and sometimes fruit. |
| Cereal bar | A cereal bar is a bar-shaped food product, made by pressing cereals and usually dried fruit or berries, which are in most cases held together by glucose syrup. |
| Protein bar | Protein bars are nutrition bars that contain a high proportion of protein to carbohydrates/fats. |
| Fruit & Nut bar | These are often based on dates with other dried fruit and nut additions and, in some cases, flavorings. |
| NCA | The National Confectioners Association is an American trade organization that promotes chocolate, candy, gum and mints, and the companies that make these treats. |
| CGMP | Current good manufacturing practices are those conforming to the guidelines recommended by relevant agencies. |
| Unstandardized foods | Unstandardized foods are those that do not have a standard of identity or that deviate from a prescribed standard in any manner. |
| GI | The glycemic index (GI) is a way of ranking carbohydrate-containing foods based on how slowly or quickly they are digested and increase blood glucose levels over a period of time |
| Skimmed milk powder | Skimmed milk powder is obtained by removing water from pasteurized skim milk by spray-drying. |
| Flavanols | Flavanols are a group of compounds found in cocoa, tea, apples, and many other plant-based foods and beverages. |
| WPC | Whey protein concentrate- the substance obtained by the removal of sufficient nonprotein constituents from pasteurized whey so that the finished dry product contains greater than 25% protein. |
| LDL | Low density Lipoprotein- the bad cholesterol |
| HDL | High density Lipoprotein- the good cholesterol |
| BHT | butylated Hydroxytoluene is a lab-made chemical that is added to foods as a preservative. |
| Carrageenan | Carrageenan is an additive used to thicken, emulsify, and preserve foods and drinks. |
| Free form | Not containing certain ingredients, such as gluten, dairy, or sugar. |
| Cocoa butter | It is a fatty substance obtained from cocoa beans, used in the manufacture of confectionery. |
| Pastellies | A type of of Brazilian candy made from sugar, eggs, and milk. |
| Draggees | Small, round candies that are coated with a hard sugar shell |
| CHOPRABISCO | Royal Belgian Association of the chocolate, pralines, biscuit, and confectionery industry- A trade association that represents the Belgian chocolate industry. |
| European Directive 2000/13 | A European Union directive that regulates the labeling of food products |
| Kakao-Verordnung | The German chocolate ordinance, a set of regulations that define what can be labeled as "chocolate" in Germany. |
| FASFC | Federal Agency for the Safety of the Food Chain |
| Pectin | A natural substance that is derived from fruits and vegetables. It is used in confectionery to create a gel-like texture. |
| Invert sugars | A type of sugar that is made up of glucose and fructose. |
| Emulsifier | A substance that helps to mix to liquids that does not mix together. |
| Anthocyanins | A type of flavonoid that is responsible for the red, purple, and blue colors of confectionery. |
| Functional Foods | Foods that have been modified to provide additional health benefits beyond basic nutrition. |
| Kosher certificate | This certification verifies that the ingredients, production process including all machinery, and/or food-service process complies with the standards of Jewish dietary law |
| Chicory root extract | A natural extract from the chicory root that is a good source of fiber, calcium, phosphorous, and folate |
| RDD | Recommended daily dose |
| Gummies | A chewy gelatin-based candy that is often flavored with fruit. |
| Nutraceuticals | Food or dietary supplements that are claimed to have health benefits. |
| Energy bars | Snack bars that are high in carbohydrates and calories are designed to provide energy on the go. |
| BFSO | Belgian Food Safety Organization for the food chain. |


Research Methodology
Mordor Intelligence follows a four-step methodology in all our reports.
- Step-1: Identify Key Variables: In order to build a robust forecasting methodology, the variables and factors identified in Step 1 are tested against available historical market numbers. Through an iterative process, the variables required for market forecast are set, and the model is built on the basis of these variables.
- Step-2: Build a Market Model: Market-size estimations for the forecast years are in nominal terms. Inflation is not a part of the pricing, and the average selling price (ASP) is kept constant throughout the forecast period for each country.
- Step-3: Validate and Finalize: In this important step, all market numbers, variables, and analyst calls are validated through an extensive network of primary research experts from the market studied. The respondents are selected across levels and functions to generate a holistic picture of the market studied.
- Step-4: Research Outputs: Syndicated Reports, Custom Consulting Assignments, Databases & Subscription Platforms


