North America Architectural Services Market Size and Share
Market Overview
| Study Period | 2020 - 2031 |
|---|---|
| Forecast Data Period | 2026 - 2031 |
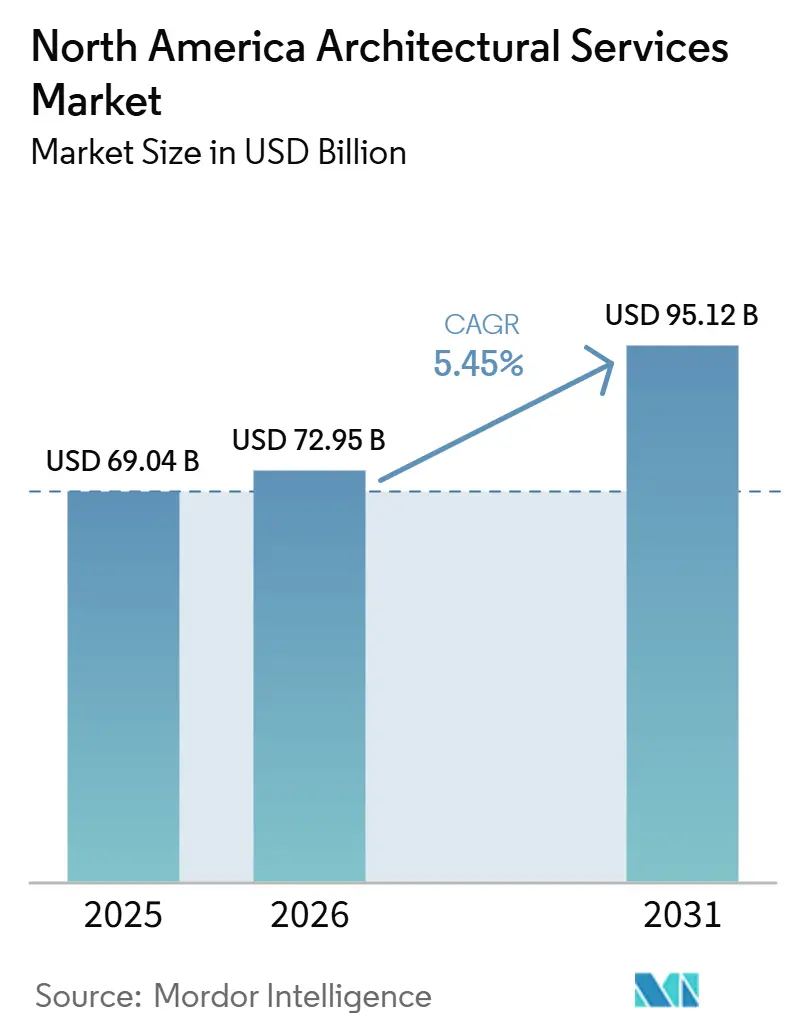
| Base Year Market Size (2025) | USD 69.04 Billion |
| Market Size (2026) | USD 72.95 Billion |
| Market Size (2031) | USD 95.12 Billion |
| Growth Rate (2026 - 2031) | 5.45% CAGR |
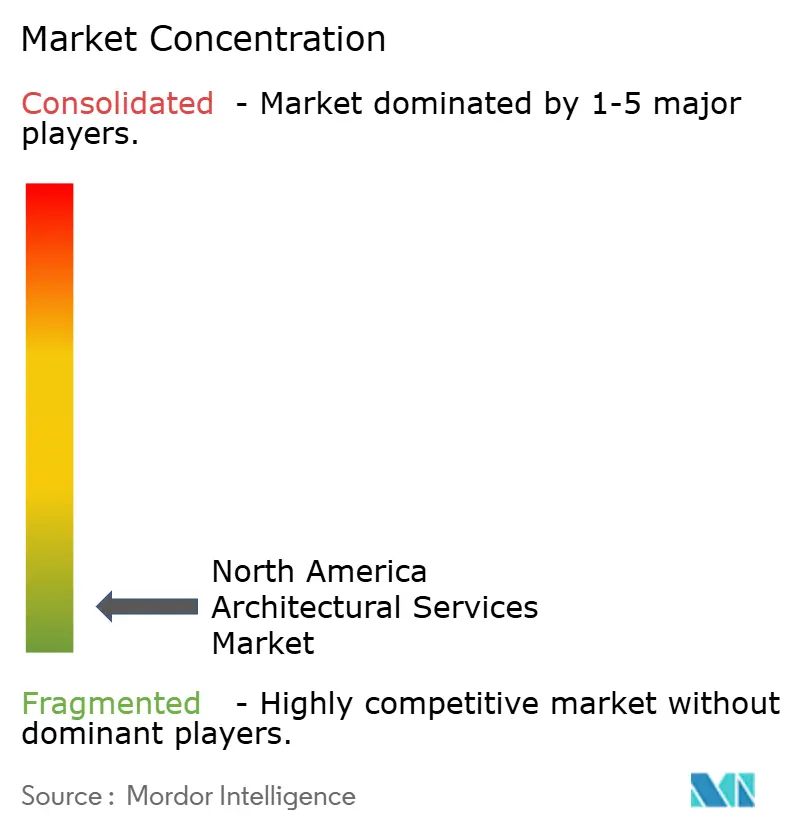
| Market Concentration | Low |
Major Players *Disclaimer: Major Players sorted in no particular order Image © Mordor Intelligence. Reuse requires attribution under CC BY 4.0. | |
North America Architectural Services Market Analysis by Mordor Intelligence
The North America Architectural Services Market size is projected to expand from USD 69.04 billion in 2025 and USD 72.95 billion in 2026 to USD 95.12 billion by 2031, registering a CAGR of 5.45% between 2026 to 2031.The North American architectural market is supported by renovation and adaptive reuse work, which keeps billings active even when speculative commercial construction remains slow. The North America architectural market is also benefiting from reshoring-led industrial construction, because manufacturers need new industrial campuses, logistics facilities, and supporting utility buildings in the United States and Mexico. Data center and healthcare construction are helping the North America architectural market hold firmer demand in complex project categories where clients value technical depth, coordination, and delivery capacity. The North America architectural market is also seeing a more visible push toward consolidation, as larger firms use acquisitions to add sector expertise in mission-critical, civic, sports, and healthcare design. Even so, the North America architectural market still faces softer billing conditions at the broader industry level, with project delays, financing pressure, and uneven commercial activity limiting conversion from inquiry to signed work.
Key Report Takeaways
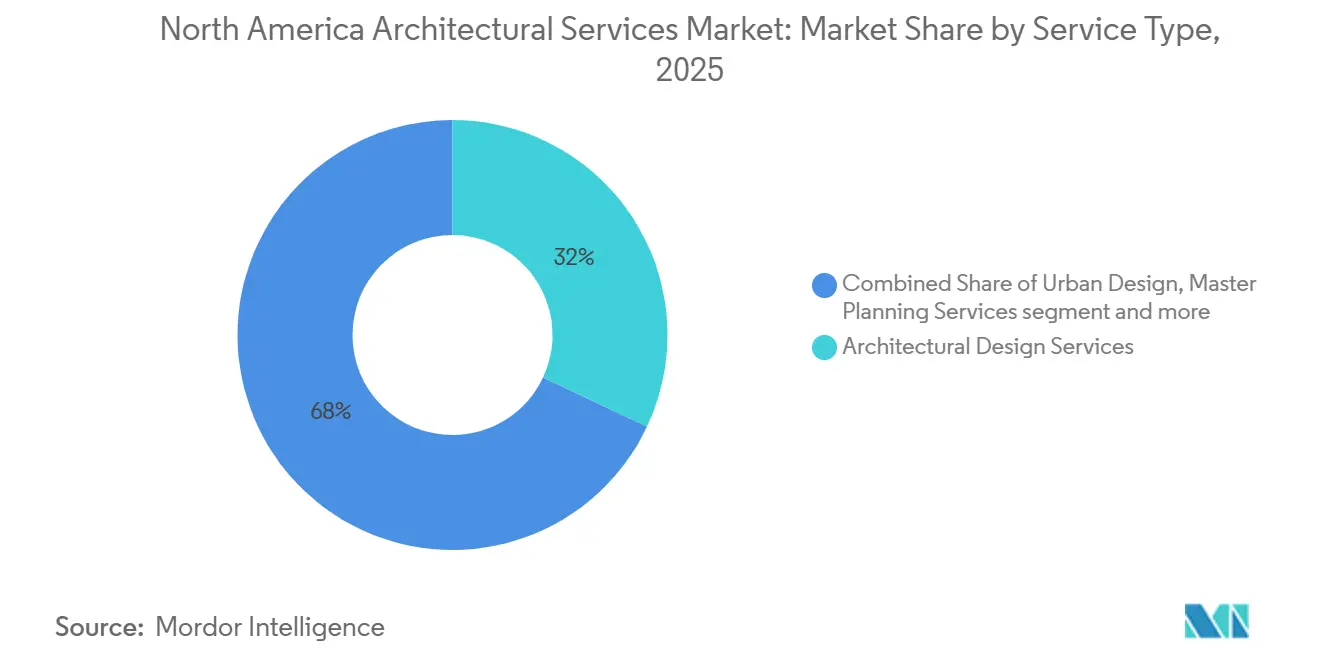
- By service type, architectural design services held 32% share in 2025, while architectural documentation and delivery dervices is forecast to expand at a 7.4% CAGR through 2031.
- By project type, renovation held 55% share in 2025, while new construction is projected to grow at a 7.1% CAGR through 2031.
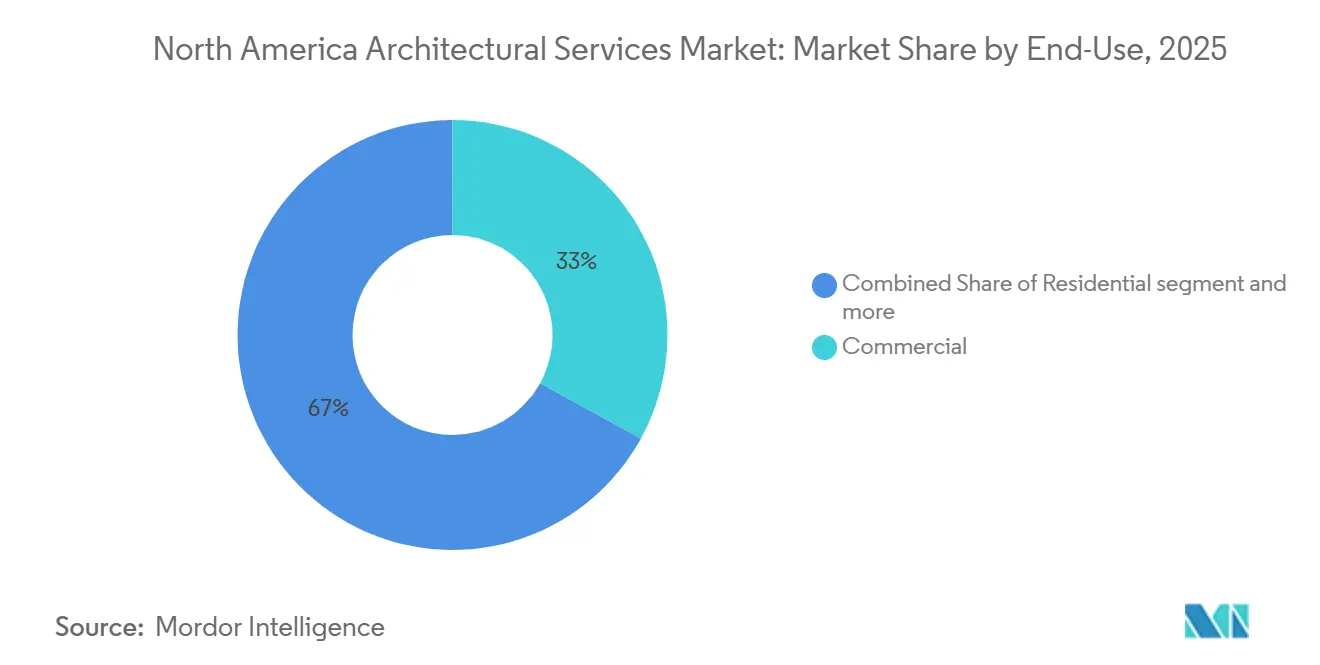
- By end-use, commercial facilities accounted for 33% of the North America architectural services market share in 2025, while infrastructure-linked buildings is projected to advance at a 7.8% CAGR through 2031.
- By investment source, private investment accounted for 69% of the North America architectural services market size in 2025, while public investment is projected to grow at a 7.2% CAGR through 2031.
- By geography, the United States held 77.5% of the North America architectural market share in 2025, while Mexico is forecast to expand at an 8.4% CAGR through 2031.
Note: Market size and forecast figures in this report are generated using Mordor Intelligence’s proprietary estimation framework, updated with the latest available data and insights as of January 2026.
North America Architectural Services Market Trends and Insights
Drivers Impact Analysis*
| Drivers | (~) % Impact on CAGR Forecast | Geographic Relevance | Impact Timeline |
|---|---|---|---|
| Large-Scale Renovation and Adaptive Reuse Demand | +1.1% | North America wide, with stronger activity in major U.S. gateway cities and older building clusters | Medium term (2-4 years) |
| Data Center and Mission-Critical Facility Expansion | +0.9% | United States primary data center markets, with spillover to Canada | Short term (≤ 2 years) |
| Reshoring-Led Industrial and Logistics Development | +0.7% | United States industrial corridors and Mexico nearshoring hubs | Medium term (2-4 years) |
| Healthcare and Life-Sciences Campus Growth | +0.7% | North America wide, led by major U.S. medical and research hubs | Long term (≥ 4 years) |
| Public Infrastructure Rebuild and Transit Modernization | +0.5% | North America wide, strongest in large metropolitan transit systems | Long term (≥ 4 years) |
| ESG and Carbon-Disclosure Requirements Increasing Design Scope | +0.4% | Largest commercial markets and institutional portfolios with formal reporting obligations | Medium term (2-4 years) |
| Source: Mordor Intelligence | |||
Large-Scale Renovation and Adaptive Reuse Demand
Renovation held 55% of project-type revenue in 2025, keeping the North American architectural market anchored in work tied to existing buildings rather than new starts. The North American architectural market continues to benefit from adaptive reuse, as office-to-residential conversions require structural revisions, envelope work, building systems redesign, and code compliance, which raise design complexity. Gensler stated that the national office-to-residential conversion pipeline reached 90,300 units, and New York City alone was targeting 9.5 million square feet of conversions in 2026[1]Gensler, “5 Proven Strategies Creating an Office-to-Residential Conversion Boom in New York,” Gensler, gensler.com. These projects also extend design involvement across permitting, value engineering, and phased execution, which supports a longer fee duration than that required for routine new-build projects. This makes adaptive reuse an important stabilizer for the North American architectural market, as private developers remain selective about greenfield office investment.
Data Center and Mission-Critical Facility Expansion
Infrastructure-linked Buildings is projected to grow at a 7.8% CAGR through 2031, and a large part of that momentum comes from data center and mission-critical demand within the North America architectural market. This work is attractive because clients need high-performance layouts, power and cooling coordination, fast delivery schedules, and reliable documentation during both greenfield and retrofit projects. The North America architectural market is seeing this demand reduce exposure to slower-moving office development, since mission-critical projects are tied more closely to corporate capital plans and essential infrastructure needs. Retrofit activity is also important, because operators are upgrading existing facilities for new computing loads while waiting for larger capacity additions to come online. As a result, firms with strong documentation workflows and coordination depth are in a better position to capture this part of the North America architectural market than firms centered on conventional commercial design.
Reshoring-Led Industrial and Logistics Development
The North America architectural market is also gaining from reshoring-led industrial development, because new production facilities require design teams with process knowledge, utility coordination, and delivery capacity across multiple jurisdictions. Mexico has become a visible growth engine in this pattern, with 477 industrial parks operating across 28 states in 2026 and more than 100 additional parks under construction under the Plan México 2025 to 2030 agenda. The North America architectural market is benefiting most, where firms can support advanced manufacturing, cleanroom layouts, anti-vibration systems, and BIM-based documentation for cross-border clients. Automotive, consumer electronics, aerospace, and medical device projects remain central to this demand in Nuevo León, Coahuila, San Luis Potosí, and Querétaro. This gives larger regional firms and specialized cross-border practices a stronger opening than local operators that lack technical breadth or delivery scale.
Healthcare and Life-Sciences Campus Growth
The North America architectural market is also being supported by healthcare and life sciences expansion, because these facilities need more technical coordination and longer planning cycles than standard commercial buildings. HFMA stated that hospital and clinic construction starts are expected to reach USD 30.7 billion in 2026, which is 11.6% above 2025 levels. DPR Construction also noted that major biomanufacturing and pharmaceutical manufacturing projects announced in 2025 were moving into active execution in 2026. This strengthens the North America architectural market because integrated teams can capture high-value work in design, engineering coordination, interior planning, and phased delivery across medical and laboratory campuses. It also favors firms with established healthcare credentials, because clients tend to place a premium on compliance, reliability, and repeatable delivery in occupied or highly regulated environments.
Restraints Impact Analysis*
| Restraints | (~) % Impact on CAGR Forecast | Geographic Relevance | Impact Timeline |
|---|---|---|---|
| Skilled Labor Shortages Across Design Teams | -0.8% | North America wide, especially in specialized institutional and mission-critical practices | Medium term (2-4 years) |
| Interest-Rate Sensitivity Delaying Commercial Pipelines | -0.6% | United States and Canada, especially in speculative commercial categories | Short term (≤ 2 years) |
| Permitting and Zoning Complexity in Major Metro Areas | -0.5% | Large urban metros across the United States and Canada | Medium term (2-4 years) |
| Professional Fee Pressure from Competitive Bidding | -0.3% | North America wide, strongest in more standardized delivery phases | Medium term (2-4 years) |
| Source: Mordor Intelligence | |||
Skilled Labor Shortages Across Design Teams
The North America architectural market continues to face a staffing constraint, even though the number of licensed U.S. architects improved in 2025. NCARB stated that the number of U.S. architects rose by 6% in 2025, yet the age mix remained uneven, with a small share of younger architects and a larger group nearing retirement. AIA and Deltek reported in June 2025 that 24% of architecture firms were understaffed, with sharper strain among institutional specialists and firms in the South. The North America architectural market feels this most in healthcare and mission-critical work, where senior technical talent is harder to replace, and client expectations are less forgiving. This means firms may win opportunities in the North America architectural market but still face limits in how fast they can turn backlog into revenue.
Interest-Rate Sensitivity Delaying Commercial Pipelines
The North America architectural market is still dealing with delayed project conversion in speculative commercial categories, even when client interest remains present. AIA and Deltek reported that 42% of firm leaders cited financing problems as a factor in project delays and stalls in December 2025, and 90% reported at least 1 significantly delayed project over the prior 6 months. The Federal Reserve Bank of Minneapolis also stated in June 2026 that construction activity continued to soften under rising costs and broader uncertainty. For the North America architectural market, this creates a split pipeline where federally backed, institutional, and mission-critical projects keep moving while office, retail, and some private mixed-use projects remain slower to authorize. The result is that firms can carry active pursuits and partial design work in the North America architectural market without the same level of certainty on final project release.
*Our forecasts treat driver/restraint impacts as directional, not additive. The impact forecasts reflect baseline growth, mix effects, and variable interactions.
Segment Analysis
By Service Type: Documentation Growth Disrupts the Design-First Fee Model
Architectural Design Services held the largest share at 32% in 2025, while Architectural Documentation and Delivery Services is projected to grow at a 7.4% CAGR through 2031. That mix shows how the North America architectural market still earns its largest fee pool from concept and design leadership, even as documentation work starts to change more quickly. Design services remain central in healthcare, mission-critical, and complex institutional projects, because early-stage planning carries the greatest influence over program, performance, and compliance. In the North America architectural market, this keeps design leadership as the main profit center for firms with deeper sector expertise and stronger client relationships. It also explains why clients continue to value firms that can translate strategic requirements into workable design packages early in the project cycle.
Architectural Documentation and Delivery Services is the fastest-growing service type at 7.4%, and that is changing competitive behavior across the North America architectural market. OFA Group launched the commercial version of its QikBIM AI platform in June 2026, showing how permit-level BIM documentation can be produced much faster than before. Interior Architecture and Space Planning continues to benefit from workplace repositioning and healthcare interior upgrades, while Urban Design and Master Planning remains supported by transit-led urban redevelopment in the North America architectural market. The practical divide is becoming clearer, because firms that hold strong digital assets and coordinated model libraries can defend scope better than firms that sell documentation as a basic throughput service.


By Project Type: Renovation Commands Scope But New Construction Gathers Momentum
Renovation held 55% of the North America architectural market share in 2025, which shows how much current demand still comes from existing building stock rather than entirely new assets. The North America architectural market is benefiting from years of deferred maintenance, changing occupancy needs, and code compliance requirements that push owners toward reuse and upgrades. Adaptive reuse remains especially important because obsolete office assets can be repositioned into housing or mixed-use formats when location quality remains attractive. Gensler stated that office-to-residential conversions reached 90,300 units nationally, supporting a steady flow of redesign, systems overhauls, and permitting work. In the North America architectural industry, firms that combine structural review, MEP retrofit planning, and regulatory coordination are better placed than firms focused only on routine renovation documentation.
New Construction is projected to grow at a 7.1% CAGR through 2031, indicating where the next cycle of the North American architectural market is building. This demand is coming from industrial parks, data center campuses, healthcare expansions, and transit-related facilities that require purpose-built layouts from the outset. The North America architectural market is therefore seeing a shift where renovation provides current scale, while new construction offers a stronger growth path in the most technical and capital-intensive project classes. Firms that can move between adaptive reuse and new-build delivery will be better positioned than firms that depend too heavily on a single project format. That balance matters because the North America architectural market still moves unevenly across end uses, funding channels, and client types.
By End-Use: Infrastructure-Linked Buildings Decouple from Private-Sector Cycles
Commercial facilities held the largest 2025 share at 33%, which means they still represented the broadest revenue pool within the North America architectural market size in 2025. Even so, the composition of that demand has changed, because data centers, logistics hubs, and airport-related work are carrying more weight than conventional office and retail formats. The North America architectural market continues to see weaker traction in speculative office work, but demand has held up better in commercial categories tied to digital infrastructure, logistics, and essential mobility. Residential work is also being supported by adaptive reuse, especially where older office buildings can be repositioned into multifamily stock. This keeps the North America architectural market more balanced than it would be if it depended only on ground-up commercial towers.
Infrastructure-linked Buildings is the fastest-growing end-use at a 7.8% CAGR, which gives the North America architectural market a more resilient growth lane through 2031. The Federal Transit Administration released USD 20.6 billion in FY 2026 public transit funding, which supports design work tied to stations, maintenance facilities, and related public infrastructure[2]Federal Transit Administration, “FY 2026 Current Apportionments,” U.S. Department of Transportation, transit.dot.gov . This kind of project is less exposed to the stop-start behavior seen in private commercial development, because budgets and delivery frameworks are often set earlier and over longer periods. It also raises barriers to entry in the North America architectural market, since transit, utility, and mission-critical facilities often require technical credentials, detailed documentation standards, and proven past performance. That makes established multidisciplinary firms more competitive than smaller studios that rely mainly on conventional building types.
By Investment Source: Public Spending Builds a Countercyclical Revenue Floor
Private investment accounted for 69% of revenue in 2025, which confirms that the North America architectural market still depends mainly on commercial, industrial, and residential capital from private clients. This part of the North America architectural market offers larger opportunity volume, but it also carries more fee pressure and more exposure to project timing changes. AIA and Deltek reported in January 2026 that 56% of architecture firm leaders found fee negotiation more challenging than 2 years earlier. That pressure tends to show up more clearly in private work, where clients use higher construction costs and financing uncertainty to push for flatter fee structures. As a result, firms active in the North America architectural market need stronger specialization and clearer value propositions to defend pricing in private-sector pursuits.
Public investment is projected to grow at a 7.2% CAGR through 2031, giving the North America architectural market a more dependable base of funded work. Federal transit appropriations, healthcare-related public programs, and other long-cycle civic needs are helping sustain active design mandates even when parts of the private market slow. The North America architectural market benefits from this because public procurement often uses prequalified contracts, standardized scopes, and multi-year delivery frameworks that improve revenue visibility. Firms with strong public-sector credentials can therefore reduce earnings volatility relative to peers that rely almost entirely on private commercial development. In the North America architectural industry, that countercyclical public work is becoming a meaningful differentiator in strategy, staffing, and backlog quality.
Geography Analysis
The United States held 77.5% share in 2025, which kept it as the core revenue base of the North America architectural market. The North America architectural market in the United States is supported by a wide institutional client base that includes healthcare systems, educational campuses, defense-related facilities, and transit agencies. The Federal Transit Administration released USD 20.6 billion in FY 2026 public transit funding, which continues to move transportation-related planning and building design into active procurement channels. AIA and Deltek reported that the Architecture Billings Index fell to 43.8 in January 2026, which confirmed that broader billing conditions were still soft at the start of the year[3]American Institute of Architects, “Architecture Billings Index (ABI) January 2026: Billings Remain Soft Start 2026,” American Institute of Architects, aia.org. Even with that softness, the North America architectural market in the United States remains better insulated than narrower markets because institutional and infrastructure-linked work can offset part of the weakness in speculative office and retail development.
Mexico is the fastest-growing geography at an 8.4% CAGR through 2031, and it is adding a more expansionary layer to the North America architectural market. The strongest driver is nearshoring, which is pushing industrial development into the Bajío, the northern border states, and corridors tied to export manufacturing and logistics. DICAM and AMPIP stated that 477 industrial parks were in operation in 2026 and more than 100 more were under construction, which shows how quickly design demand is accumulating around these locations. The North America architectural market in Mexico is also becoming more technically demanding, because advanced manufacturing clients need better documentation, process planning, and coordinated engineering support than standard warehouse projects require.
Canada is smaller in scale, but it gives the North America architectural market a steadier institutional base than a purely commercial mix would provide. Healthcare, university renewal, civic infrastructure, and selective data center activity support a consistent pipeline that is less dependent on short-cycle private development. The North America architectural market in Canada therefore acts more as a stabilizer than as the main regional growth engine, especially when interest-rate pressure slows residential and speculative commercial starts. That balance matters because regional diversification in the North America architectural market is now driven not only by geography, but also by the mix of public, institutional, and mission-critical work each country can sustain.
Competitive Landscape
The North America architectural market remains fragmented in broad revenue terms, but competition is becoming sharper in high-value categories where clients want larger integrated teams and deeper sector specialization. The North America architectural market is rewarding firms that can combine architecture, engineering coordination, digital delivery, and sector credentials in healthcare, data centers, industrial facilities, transit, and civic work. One clear example is Stantec’s August 2025 acquisition of Page Southerland Page, which expanded Stantec’s U.S. buildings platform and made it the second-largest architecture firm in the United States. That move shows how the North America architectural market is valuing sector depth and platform scale over simple geographic expansion. It also suggests that future share gains in the North America architectural market will come less from broad coverage alone and more from the ability to win technically demanding, multi-site, and long-duration mandates.
HOK’s acquisition of ROSSETTI in April 2026 is another example of how the North America architectural market is consolidating around specialist capabilities in sports, recreation, and entertainment design. HOK also strengthened its project position in June 2026 when the HNTB and HOK Joint Venture, in association with PAU, was selected as the design team for the reconstruction of New York Penn Station. AECOM extended its infrastructure and federal design presence through 2026 contract wins tied to Sound Transit, the U.S. Department of Homeland Security, and the U.S. Missile Defense Agency. These moves show that the North America architectural market is increasingly shaped by firms that can navigate public procurement, major infrastructure programs, and highly technical building types.
A second competitive shift in the North America architectural market is the growing role of digital delivery and sustainability credentials in winning work. OFA Group’s commercial launch of QikBIM AI in 2026 points to faster documentation workflows, which may widen the performance gap between firms that own strong model-based processes and firms that still rely on more manual production methods. The AIA 2030 Commitment is also becoming more visible as a client-facing capability, because occupiers and institutions increasingly expect documented sustainability performance from the teams they hire. That means the North America architectural market is no longer separating design quality from reporting discipline, delivery systems, and measurable technical performance when clients evaluate firms.
North America Architectural Services Industry Leaders
Jacobs Solutions Inc.
AECOM
Stantec Inc.
HDR, Inc.
DLR Group
- *Disclaimer: Major Players sorted in no particular order

Recent Industry Developments
- June 2026: The HNTB–HOK Joint Venture, in association with Practice for Architecture and Urbanism (PAU), was selected as the design team for the transformational reconstruction of Amtrak's New York Penn Station. The project encompasses a new Eighth Avenue grand entrance, expanded concourses, increased track capacity, revitalized subterranean infrastructure, and integration with the surrounding urban fabric; construction is expected to begin in 2027.
- June 2026: AECOM was awarded a nationwide US Department of Homeland Security contract for critical infrastructure modernization, extending the firm's federal facilities design and engineering portfolio across multiple agency sites.
- April 2026: HOK acquired ROSSETTI, a Detroit-based architecture firm with 57 years of sports venue design experience, establishing HOK's first Detroit office and creating a combined Sports + Recreation + Entertainment practice with expanded Midwest market reach.


North America Architectural Services Market Report Scope
| Architectural Design Services |
| Architectural Documentation and Delivery Services |
| Interior Architecture and Space Planning Services |
| Urban Design and Master Planning Services |
| Others |
| New Construction |
| Renovation |
| Residential | |
| Commercial | Office |
| Retail | |
| Institutional | |
| Industrial and Logistics | |
| Others | |
| Infrastructure-linked Buildings |
| Public |
| Private |
| United States |
| Canada |
| Mexico |
| By Service Type | Architectural Design Services | |
| Architectural Documentation and Delivery Services | ||
| Interior Architecture and Space Planning Services | ||
| Urban Design and Master Planning Services | ||
| Others | ||
| By Project Type | New Construction | |
| Renovation | ||
| By End-Use | Residential | |
| Commercial | Office | |
| Retail | ||
| Institutional | ||
| Industrial and Logistics | ||
| Others | ||
| Infrastructure-linked Buildings | ||
| By Investment Source | Public | |
| Private | ||
| By Country | United States | |
| Canada | ||
| Mexico | ||


Key Questions Answered in the Report
What is the 2031 outlook for architectural services in North America?
The sector is projected to reach USD 95.1 billion by 2031 from USD 73.0 billion in 2026, with a 5.5% CAGR over 2026 to 2031.
What is driving demand the most across the region?
Renovation and adaptive reuse, reshoring-led industrial development, data center build-out, and healthcare expansion are the main demand drivers.
Which project type is largest and which is growing fastest?
Renovation led with 55% share in 2025, while New Construction is projected to grow faster at a 7.1% CAGR through 2031.
Which service line is changing the fastest?
Architectural Documentation and Delivery Services is projected to grow at a 7.4% CAGR, supported by faster model-based and AI-enabled production workflows.
Page last updated on:


