Market Overview
| Study Period | 2017 - 2029 |
|---|---|
| Forecast Data Period | 2025 - 2029 |
| Historical Data Period | 2017 - 2023 |
| Market Size (2025) | USD 33.08 Million |
| Market Size (2029) | USD 60.93 Million |
| Growth Rate (2025 - 2029) | 16.49% CAGR |
| Market Concentration | High |
Major Players*Disclaimer: Major Players sorted in no particular order Image © Mordor Intelligence. Reuse requires attribution under CC BY 4.0. | |

India E-bike Market Analysis by Mordor Intelligence
The India E-bike Market size is estimated at 33.08 million USD in 2025, and is expected to reach 60.93 million USD by 2029, growing at a CAGR of 16.49% during the forecast period (2025-2029).
India's electric bike industry is undergoing significant transformation driven by infrastructure development and supportive government policies. The country's commitment to sustainable transportation has led to the establishment of dedicated cycling infrastructure across major cities. Leading electric bike manufacturers in India are expanding their production capabilities to meet growing demand, with Hero Cycles operating at a substantial manufacturing capacity of 7.5 million bicycles annually through facilities in Ludhiana, Ghaziabad, and Bihta. The government's initiatives to reduce automotive pollution and promote electric mobility have created a favorable environment for e-bike adoption, particularly in urban areas where traffic congestion remains a significant challenge, as evidenced by the country's traffic congestion index of 204.53 in 2022.
The distribution landscape for e-bikes is evolving rapidly, with manufacturers adopting multi-channel strategies to enhance market penetration. Companies like EMotorad have established extensive networks spanning over 160 dealers across 82 towns and cities, demonstrating the industry's push toward wider accessibility. Traditional bicycle manufacturers are transitioning into the e-bike segment, establishing experience centers and test-ride facilities to educate consumers about the benefits of electric mobility. The retail infrastructure is becoming more sophisticated, with companies investing in both online and offline channels to provide comprehensive customer experiences, thereby boosting the growth of the electric bike market.
Battery technology advancement has emerged as a crucial factor shaping the industry's trajectory. The cost of lithium-ion batteries has decreased significantly, showing a reduction of approximately 70% over the past decade, making e-bikes more affordable for consumers. Current battery replacement costs range between INR 12,000-18,000, with advanced batteries offering lifespans of up to 10 years with proper maintenance. Manufacturers are investing in research and development to improve battery efficiency, charging capabilities, and overall performance while reducing costs through technological innovations and economies of scale. This focus is pivotal for the battery electric bicycle market.
The industry is witnessing a surge in domestic manufacturing capabilities and technological innovation. Local manufacturers are increasingly focusing on developing indigenous solutions tailored to Indian conditions and consumer preferences. Companies are investing in advanced manufacturing facilities, incorporating automation and quality control measures to meet international standards. The emphasis on localization of components, particularly in battery and motor technology, is reducing dependency on imports and creating a more sustainable supply chain. This shift towards domestic production is accompanied by investments in research and development, focusing on improving battery technology, motor efficiency, and overall product durability, which is essential for the electric bike market analysis.
India E-bike Market Trends and Insights
India's E-Bike adoption rates, though starting from a low base, show a consistent increase, indicating a growing market potential.
- The use of e-bikes has become increasingly popular in India over the past few years. Additionally, growing public awareness of the health benefits of cycling, increasing traffic congestion in India during rush hours, and expanding government initiatives to support e-bike adoption are all contributing to the country's e-bike adoption. Also, fuel expenditures and lower maintenance costs sped up the adoption rate of e-bikes among Indians to 0.10% in 2019 over 2018.
- The spreading of COVID cases and growth in the wave affected the bicycle business positively. Factors such as not using public or rented transportation to maintain social distancing have changed the commuting methods of the consumer, further encouraging people to invest in e-bikes, as it is one of the convenient and price-friendly options over other modes of commuting daily to offices and nearby places. Such factors accelerated the adoption rate by 0.60% in 2022 over 2021 across the country.
- E-bike adoption has increased with the return of commercial operations and the lifting of trade barriers of lockdown. The country's import and export activities have improved as a result of the removal of trade restrictions. The adoption rate for e-bikes is anticipated to increase to 5.00% in 2029 from 0.60% in 2022 as a result of customer attraction to e-bikes due to their features and advantages, such as fuel saving and time-saving.


India shows a steady increase in the percentage of population commuting 5-15 km daily, indicating evolving travel distances.
- People in various cities have embraced the bicycle culture, and the demand for bicycles in India has increased over the past few years. However, commuter travel of 5-15 kilometers is still relatively low compared to other modes of transportation, as most people prefer to travel via various modes such as two-wheelers and public transportation. Less than 5% of the population chose to commute via bicycles to nearby places within 5-15 kilometers in 2019. However, in 2020, traveling between 5 and 15 kilometers increased as many people started exercising and using bicycles to travel to nearby marketplaces for buying essentials during the lockdown. Such factors increased the demand for bicycles in India in 2020 over 2019.
- The pandemic had a significant and beneficial impact on the Indian bicycle market. More Indians walked or cycled instead of using public transportation to nearby places. The introduction of e-bikes with advanced features and longer battery lives also encouraged people to choose bicycles for exercising and recreational weekend activities, which further increased the number of commuters traveling 5-15 kilometers in India in 2021 over 2020.
- People developed the habit of using bicycles to commute to nearby places. Currently, many people travel daily by bicycle within a radius of 5-15 kilometers to get to various places such as local markets. Due to the increased health advantages, carbon-free commutes, and time savings from avoiding traffic bottlenecks, more people are choosing to commute by bicycle. These factors are expected to increase commuter travel between 5 and 15 kilometers in India during the forecast period.

OTHER KEY INDUSTRY TRENDS COVERED IN THE REPORT
- Post-2018, India's bicycle sales show recovery and steady growth, indicating a resilient market with growing demand.
- India's inflation rates indicate a peak in 2022, followed by a trend towards stabilization, reflecting responsive economic policies.
- India's e-bike battery prices are decreasing significantly, reflecting rapid market expansion and technological advancements.
- India's steady increase in dedicated bicycle lanes reflects a growing awareness and initiative towards promoting cycling for health and environmental benefits.
- The charging time for E-bikes in India is consistently reducing, indicating progress in charging infrastructure and battery technology.
- India's GDP per capita shows a steady upward trend, indicating consistent economic growth and development.
- India's bicycle rental market is experiencing explosive growth, significantly multiplying its value and highlighting a rapidly expanding sector.
- India's hyper-local delivery sector is experiencing significant growth, suggesting a rapid integration of localized digital services within consumer habits.
- India's significant and steady increase in trekker numbers reflects a growing interest in outdoor activities and exploration of its diverse natural landscapes.
- India's Traffic Congestion Index is high but slightly decreasing, indicating persistent congestion with marginal improvements over time.
Segment Analysis: Propulsion Type
Pedal Assisted Segment in India E-bike Market
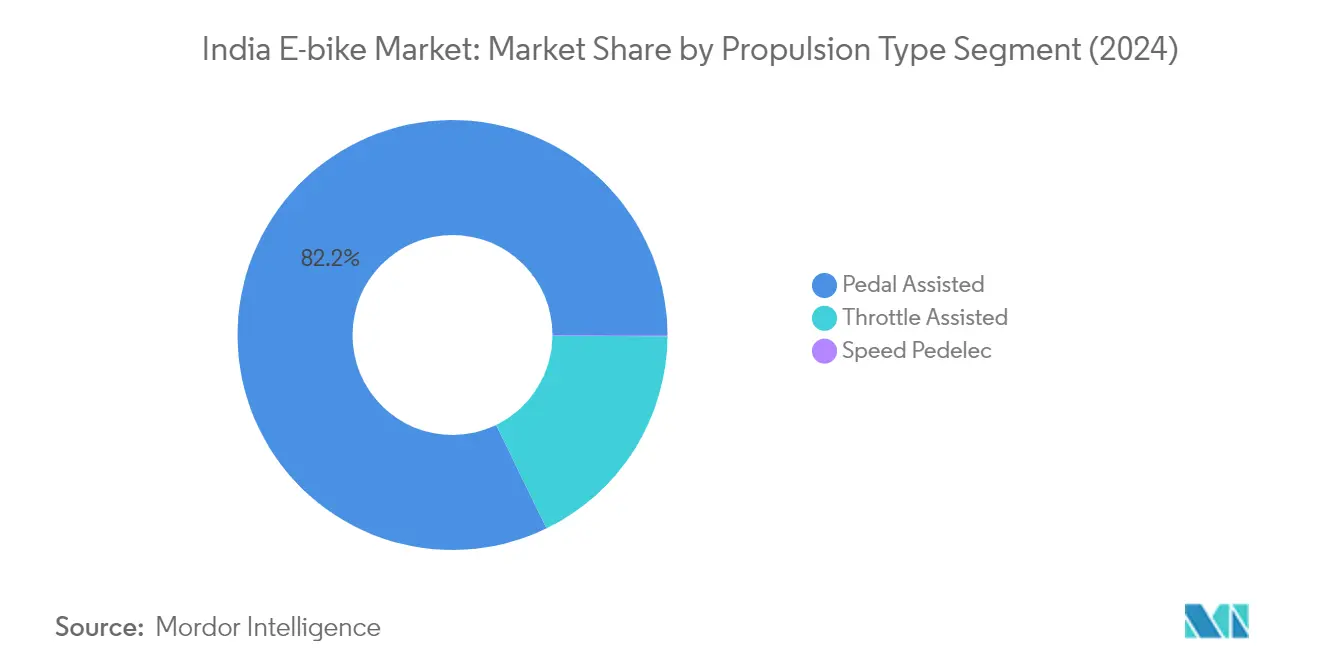
The pedal-assisted segment dominates the India e-bike market, accounting for approximately 82% market share in 2024. This significant market position is driven by several key factors, including the segment's ability to provide an optimal balance between manual pedaling and electric assistance. Pedal-assisted e-bicycles are particularly popular among urban commuters and fitness enthusiasts as they allow users to exercise while still benefiting from motor support when needed. The segment's success is further bolstered by these bikes' lower operating costs, reduced fatigue during long rides, and their suitability for various activities, from daily commuting to leisure riding. Additionally, the growing infrastructure development for cycling in major Indian cities and increasing awareness about health and environmental benefits have contributed to the strong market position of pedal-assisted electric bicycles.

Speed Pedelec Segment in India E-bike Market
The speed pedelec segment is emerging as the fastest-growing category in the Indian pedelec market, projected to grow at approximately 22% CAGR from 2024 to 2029. This remarkable growth trajectory is primarily driven by increasing consumer demand for faster and more efficient commuting solutions in urban areas. Speed pedelecs are gaining popularity among long-distance commuters who seek alternatives to conventional transportation methods while still maintaining higher speeds than traditional e-bikes. The segment's growth is further supported by technological advancements in battery efficiency and motor performance, making these bikes more reliable and cost-effective. Additionally, the expansion of dedicated cycling infrastructure in major Indian cities and growing acceptance of e-bikes for longer commutes are creating favorable conditions for speed pedelec adoption.
Remaining Segments in Propulsion Type
The throttle-assisted segment represents a significant portion of the Indian electric bicycle market, offering unique advantages for users who prefer complete motor control without the need for pedaling. This segment particularly appeals to delivery services, elderly users, and those with physical limitations who may find continuous pedaling challenging. Throttle-assisted e-cycles provide more flexibility in urban environments where frequent stops and starts are common, and they are increasingly being adopted by last-mile delivery services and courier companies. The segment continues to evolve with improvements in battery technology and motor efficiency, making these bikes more practical for daily use while maintaining their position as a viable alternative to traditional pedal-assisted models.
Segment Analysis: Application Type
City/Urban Segment in India E-bike Market
The City/Urban segment dominates the India electric bike market, commanding approximately 79% of the total market value in 2024. This significant market share is driven by the segment's strong appeal among urban commuters, students, and working professionals who seek efficient and eco-friendly transportation solutions for their daily commutes. The segment's dominance is further strengthened by the increasing focus on developing urban cycling infrastructure, growing environmental consciousness among city dwellers, and the segment's ability to address last-mile connectivity challenges in metropolitan areas. Major township projects, educational institutions, and corporate organizations are increasingly adopting city e-bicycles as part of their sustainable transportation initiatives, while government support through dedicated cycling lanes and infrastructure development in urban areas continues to boost segment growth.
Trekking Segment in India E-bike Market
The Trekking segment is emerging as the fastest-growing application category in the India electric cycle market for the forecast period 2024-2029. This rapid growth is primarily driven by the rising popularity of adventure tourism, increasing interest in outdoor recreational activities, and growing awareness about fitness-oriented lifestyle choices among Indian consumers. The segment is benefiting from the expansion of cycling tourism in various scenic locations across India, particularly in regions like the Western Ghats and Himalayan foothills. Manufacturers are responding to this trend by introducing advanced trekking e-bikes with enhanced battery life, superior suspension systems, and robust frames designed specifically for challenging terrains. The segment is also seeing increased adoption among cycling enthusiasts and adventure sports communities, supported by the growing number of cycling events and trekking expeditions being organized across the country.
Remaining Segments in Application Type
The Cargo/Utility segment represents an important niche in the India electric bicycle market, primarily serving the growing demands of last-mile delivery services and small business operations. This segment is gaining traction due to the rapid expansion of e-commerce and hyperlocal delivery services in urban areas. Cargo e-bikes are increasingly being adopted by logistics companies and local businesses as a cost-effective and environmentally friendly alternative to traditional delivery vehicles. The segment's growth is supported by the bikes' ability to navigate through congested urban areas efficiently while offering substantial cargo capacity and reduced operational costs compared to conventional delivery vehicles.
Segment Analysis: Battery Type
Lithium-ion Battery Segment in India E-bike Market
The lithium-ion battery segment dominates the India electric cycle market, commanding approximately 88% market share in 2024, while also emerging as the fastest-growing segment with a projected growth rate of nearly 12% from 2024 to 2029. This segment's dominance can be attributed to several key advantages, including high energy density, longer lifespan, and improved power output capabilities compared to traditional battery technologies. The increasing adoption of lithium-ion batteries in e-bikes is driven by their lightweight nature, quick charging capabilities, and extended range performance. Additionally, the gradual decrease in lithium-ion battery prices, coupled with technological advancements in battery management systems, has made these batteries more accessible to consumers. The segment's growth is further supported by increasing investments in domestic battery manufacturing capabilities and the development of advanced battery technologies that offer enhanced safety features and improved performance metrics.
Remaining Segments in Battery Type
The lead acid battery and other battery technologies continue to play a role in the Indian electric bicycle market, though their impact is diminishing. Lead acid batteries, despite their cost advantage and reliability in extreme conditions, are gradually losing market share due to their heavier weight and limited performance capabilities. The 'Others' category, which includes emerging battery technologies like sodium-ion batteries, represents potential alternatives that could offer cost advantages and improved safety features. These alternative battery technologies are particularly relevant for price-sensitive market segments and specific use cases where the premium features of lithium-ion batteries may not be essential. However, their adoption remains limited due to the overwhelming advantages and increasing affordability of lithium-ion technology.
Competitive Landscape
Top Companies in India E-bike Market
The Indian e-bike market is witnessing significant product innovation trends, with companies focusing on developing advanced features like smart connectivity, improved battery technology, and enhanced range capabilities. Companies, including some of the leading electric bike companies in India, are demonstrating operational agility by rapidly adapting to changing consumer preferences and market demands, particularly in urban mobility solutions. Strategic moves in the industry are centered around expanding distribution networks, establishing experience centers, and strengthening after-sales support infrastructure. Market players are actively pursuing expansion through various channels, including online platforms and dedicated retail outlets, while also forming strategic partnerships with technology providers and component manufacturers to enhance their product offerings. The industry is seeing increased investment in research and development to improve product performance and user experience, with a particular focus on developing models suited for both urban commuting and adventure riding.
Market Dominated by Local Manufacturing Giants
The Indian e-bike market is characterized by a mix of established local manufacturers and emerging startups, with domestic players holding significant market share in the Indian bike industry through their extensive distribution networks and brand recognition. Traditional bicycle manufacturers have successfully leveraged their existing infrastructure and market knowledge to establish strong positions in the e-bike segment, while new entrants are bringing innovative technologies and business models. The market structure shows moderate consolidation, with a few large players controlling substantial e-bike market share, though there is growing competition from new entrants focusing on premium and specialized segments. The industry is witnessing increased collaboration between traditional manufacturers and technology companies to enhance product capabilities and market reach, creating a dynamic competitive environment.
The market is experiencing strategic consolidation through mergers and acquisitions, particularly as established players seek to acquire technological capabilities and expand their product portfolios. Traditional bicycle manufacturers are acquiring or partnering with technology startups to accelerate their entry into the e-bike segment, while international players are forming joint ventures with local companies to establish market presence. These strategic moves are reshaping the competitive landscape, leading to increased market sophistication and product diversity, while also creating opportunities for specialized players in niche segments like cargo e-bikes and premium recreational models.
Innovation and Distribution Key to Growth
Success in the Indian e-bike market increasingly depends on companies' ability to balance innovation with affordability while building robust distribution networks. Incumbents, including leading electric bike companies in India, need to focus on continuous product development, particularly in areas of battery technology and smart features, while maintaining competitive pricing strategies to retain market share. Companies must invest in strengthening their after-sales service networks and developing comprehensive customer support systems to build long-term brand loyalty. The ability to create differentiated value propositions through unique features or service offerings will become crucial as the market matures and competition intensifies. Establishing strong partnerships with component suppliers and technology providers will be essential for maintaining competitive advantages and ensuring consistent product quality.
For contenders looking to gain market share, focusing on underserved segments and geographical regions while offering innovative financing solutions could provide competitive advantages. Success will depend on developing efficient supply chain management systems and building strong relationships with dealers and distributors. Companies need to consider potential regulatory changes regarding electric vehicles and ensure compliance while maintaining operational flexibility. The risk of substitution from traditional bicycles and other electric vehicles necessitates clear value proposition communication and targeted marketing strategies. Understanding and adapting to evolving customer preferences, particularly in urban mobility solutions and last-mile delivery applications, will be crucial for sustained growth and market success.
India E-bike Industry Leaders
Alphavector (India) Pvt Ltd
Cultsport
EMotorad
Hero Cycles Limited
TREK BICYCLE INDIA PRIVATE LIMITED
- *Disclaimer: Major Players sorted in no particular order


Recent Industry Developments
- March 2023: Nibe Limited's Board of Directors accepted private placement and preferential issue fundraising plans of up to INR 104.40 crore.
- November 2022: Motovolt Mobility raised INR 16 crore in a Pre-Series A funding round to launch new products and marketing campaigns and expand its footprint across India through more retail outlets.
- November 2022: EMotorad introduced the "Doodle v2" folding e-bike for INR 49,999. It is available for purchase on the company's website as well as on e-commerce platforms such as Amazon and Flipkart.


India E-bike Market Report Scope
Pedal Assisted, Speed Pedelec, Throttle Assisted are covered as segments by Propulsion Type. Cargo/Utility, City/Urban, Trekking are covered as segments by Application Type. Lead Acid Battery, Lithium-ion Battery, Others are covered as segments by Battery Type.Propulsion Type
| Pedal Assisted |
| Speed Pedelec |
| Throttle Assisted |
Application Type
| Cargo/Utility |
| City/Urban |
| Trekking |
Battery Type
| Lead Acid Battery |
| Lithium-ion Battery |
| Others |
| Propulsion Type | Pedal Assisted |
| Speed Pedelec | |
| Throttle Assisted | |
| Application Type | Cargo/Utility |
| City/Urban | |
| Trekking | |
| Battery Type | Lead Acid Battery |
| Lithium-ion Battery | |
| Others |


Market Definition
- By Application Type - E-bikes considered under this segment include city/urban, trekking, and cargo/utility e-bikes. The common types of e-bikes under these three categories include off-road/hybrid, kids, ladies/gents, cross, MTB, folding, fat tire, and sports e-bike.
- By Battery Type - This segment includes lithium-ion batteries, lead-acid batteries, and other battery types. The other battery type category includes nickel-metal hydroxide (NiMH), silicon, and lithium-polymer batteries.
- By Propulsion Type - E-bikes considered under this segment include pedal-assisted e-bikes, throttle-assisted e-bikes, and speed pedelec. While the speed limit of pedal and throttle-assisted e-bikes is usually 25 km/h, the speed limit of speed pedelec is generally 45 km/h (28 mph).
| Keyword | Definition |
|---|---|
| Pedal Assisted | Pedal-assist or pedelec category refers to the electric bikes that provide limited power assistance through torque-assist system and do not have throttle for varying the speed. The power from the motor gets activated upon pedaling in these bikes and reduces human efforts. |
| Throttle Assisted | Throttle-based e-bikes are equipped with the throttle assistance grip, installed on the handlebar, similarly to motorbikes. The speed can be controlled by twisting the throttle directly without the need to pedal. The throttle response directly provides power to the motor installed in the bicycles and speeds up the vehicle without paddling. |
| Speed Pedelec | Speed pedelec is e-bikes similar to pedal-assist e-bikes as they do not have throttle functionality. However, these e-bikes are integrated with an electric motor which delivers power of approximately 500 W and more. The speed limit of such e-bikes is generally 45 km/h (28 mph) in most of the countries. |
| City/Urban | The city or urban e-bikes are designed with daily commuting standards and functions to be operated within the city and urban areas. The bicycles include various features and specifications such as comfortable seats, sit upright riding posture, tires for easy grip and comfortable ride, etc. |
| Trekking | Trekking and mountain bikes are special types of e-bikes that are designed for special purposes considering the robust and rough usage of the vehicles. These bicycles include a strong frame, and wide tires for better and advanced grip and are also equipped with various gear mechanisms which can be used while riding in different terrains, rough grounded, and tough mountainous roads. |
| Cargo/Utility | The e-cargo or utility e-bikes are designed to carry various types of cargo and packages for shorter distances such as within urban areas. These bikes are usually owned by local businesses and delivery partners to deliver packages and parcels at very low operational costs. |
| Lithium-ion Battery | A Li-ion battery is a rechargeable battery, which uses lithium and carbon as its constituent materials. The Li-Ion batteries have a higher density and lesser weight than sealed lead acid batteries and provide the rider with more range per charge than other types of batteries. |
| Lead Acid Battery | A lead acid battery refers to sealed lead acid battery having a very low energy-to-weight and energy-to-volume ratio. The battery can produce high surge currents, owing to its relatively high power-to-weight ratio as compared to other rechargeable batteries. |
| Other Batteries | This includes electric bikes using nickel–metal hydroxide (NiMH), silicon, and lithium-polymer batteries. |
| Business-to-Business (B2B) | The sales of e-bikes to business customers such as urban fleet and logistics company, rental/sharing operators, last-mile fleet operators, and corporate fleet operators are considered under this category. |
| Business-to-Customers (B2C) | The sales of electric scooters and motorcycles to direct consumers is considered under this category. The consumers acquire these vehicles either directly from manufacturers or from other distributers and dealers through online and offline channel. |
| Unorganized Local OEMs | These players are small local manufacturers and assemblers of e-bikes. Most of these manufacturers import the components from China and Taiwan and assemble them locally. They offer the product at low cost in this price sensitive market which give them advantage over organized manufacturers. |
| Battery-as-a-Service | A business model in which the battery of an EV can be rented from a service provider or swapped with another battery when it runs out of charge |
| Dockless e-Bikes | Electric bikes that have self-locking mechanisms and a GPS tracking facility with an average top speed of around 15mph. These are mainly used by bike-sharing companies such as Bird, Lime, and Spin. |
| Electric Vehicle | A vehicle which uses one or more electric motors for propulsion. Includes cars, scooters, buses, trucks, motorcycles, and boats. This term includes all-electric vehicles and hybrid electric vehicles |
| Plug-in EV | An electric vehicle that can be externally charged and generally includes all-electric vehicles as well as plug-in hybrids. In this report we use the term for all-electric vehicles to differentiate them from plug-in hybrid electric vehicles. |
| Lithium-Sulphur Battery | A rechargeable battery that replaces the liquid or polymer electrolyte found in current lithium-ion batteries with sulfur. They have more capacity than Li-ion batteries. |
| Micromobility | Micromobility is one of the many modes of transport involving very-light-duty vehicles to travel short distances. These means of transportation include bikes, e-scooters, e-bikes, mopeds, and scooters. Such vehicles are used on a sharing basis for covering short distances, usually five miles or less. |
| Low Speed Electric Vehicls (LSEVs) | They are low speed (usually less than 25 kmph) light vehicles that do not have an internal combustion engine, and solely use electric energy for propulsion. |


Research Methodology
Mordor Intelligence follows a four-step methodology in all its reports.
- Step-1: Identify Key Variables: To build a robust forecasting methodology, the variables and factors identified in Step-1 are tested against available historical market numbers. Through an iterative process, the variables required for market forecast are set and the model is built based on these variables.
- Step-2: Build a Market Model: Market-size estimations for the historical and forecast years have been provided in revenue and volume terms. Market revenue is calculated by multiplying the volume demand with volume-weighted average battery pack price (per kWh). Battery pack price estimation and forecast takes into account various factors affecting ASP, such as inflation rates, market demand shifts, production costs, technological developments, and consumer preferences, providing estimations for both historical data and future trends.
- Step-3: Validate and Finalize: In this important step, all market numbers, variables, and analyst calls are validated through an extensive network of primary research experts from the market studied. The respondents are selected across levels and functions to generate a holistic picture of the market studied.
- Step-4: Research Outputs: Syndicated Reports, Custom Consulting Assignments, Databases & Subscription Platforms


