
Non-Meat Ingredients Market Size and Share
Market Overview
| Study Period | 2021 - 2031 |
|---|---|
| Market Size (2026) | USD 45.08 Billion |
| Market Size (2031) | USD 56.61 Billion |
| Growth Rate (2026 - 2031) | 4.66 % |
| Fastest Growing Market | Asia Pacific |
| Largest Market | North America |
| Market Concentration | Low |
Major Players *Disclaimer: Major Players sorted in no particular order Image © Mordor Intelligence. Reuse requires attribution under CC BY 4.0. | |
Non-Meat Ingredients Market Analysis by Mordor Intelligence
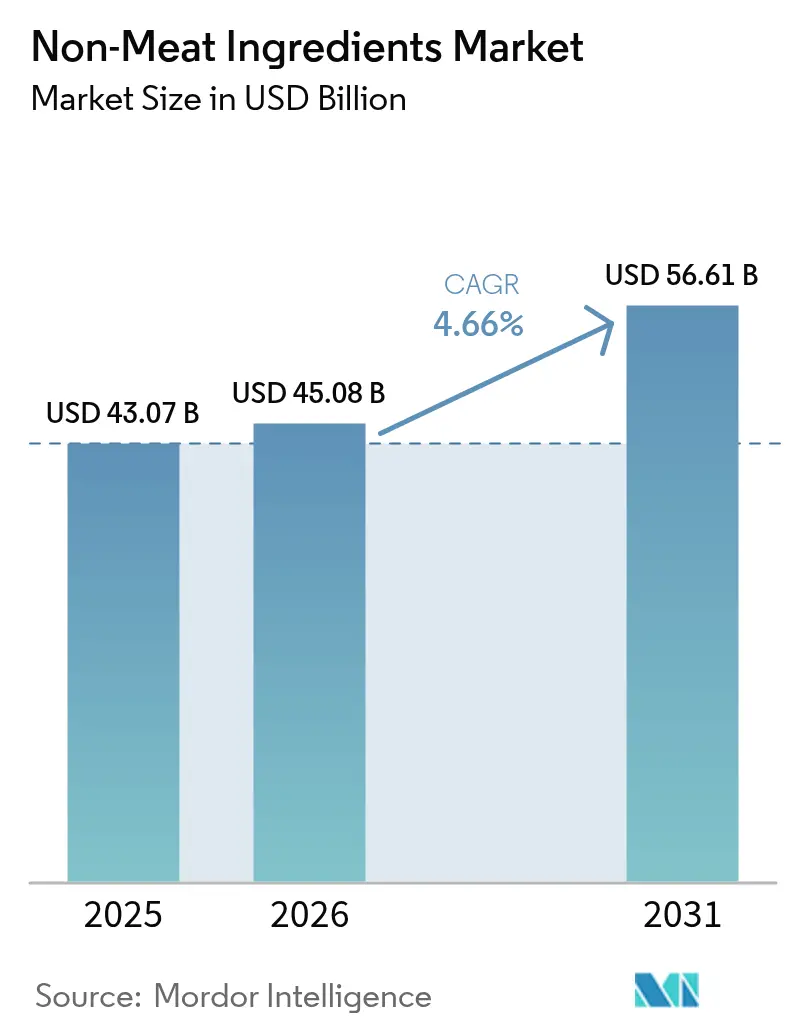
The non-meat ingredients market size was valued at USD 43.07 billion in 2025 and estimated to grow from USD 45.08 billion in 2026 to reach USD 56.61 billion by 2031, at a CAGR of 4.66% during the forecast period (2026-2031). This growth is primarily attributed to the increasing adoption of functional components designed to enhance texture, flavor, preservation, and nutritional density. Manufacturers are focusing on reformulating products to reduce input costs while maintaining sensory quality, supported by advancements in extraction and encapsulation technologies that improve ingredient performance. Furthermore, the demand is being driven by the rising preference for clean-label products, stricter safety regulations, and the expanding popularity of hybrid meat-plant offerings. Plant-derived proteins and natural preservatives, in particular, are gaining momentum as they address consumer concerns related to health and sustainability while enabling processors to comply with evolving regulatory requirements.
Key Report Takeaways
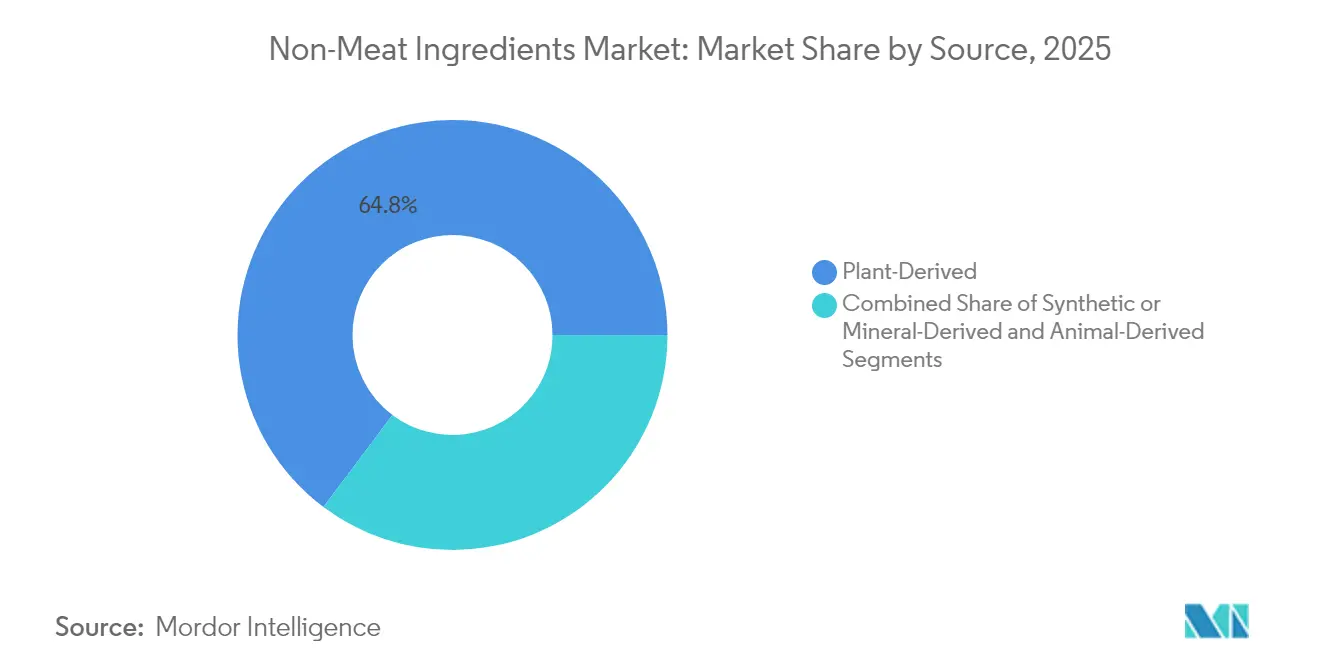
- By source, plant-derived ingredients captured a 64.75% share of the non-meat ingredients market in 2025, and the segment is projected to record the fastest 7.54% CAGR through 2031.
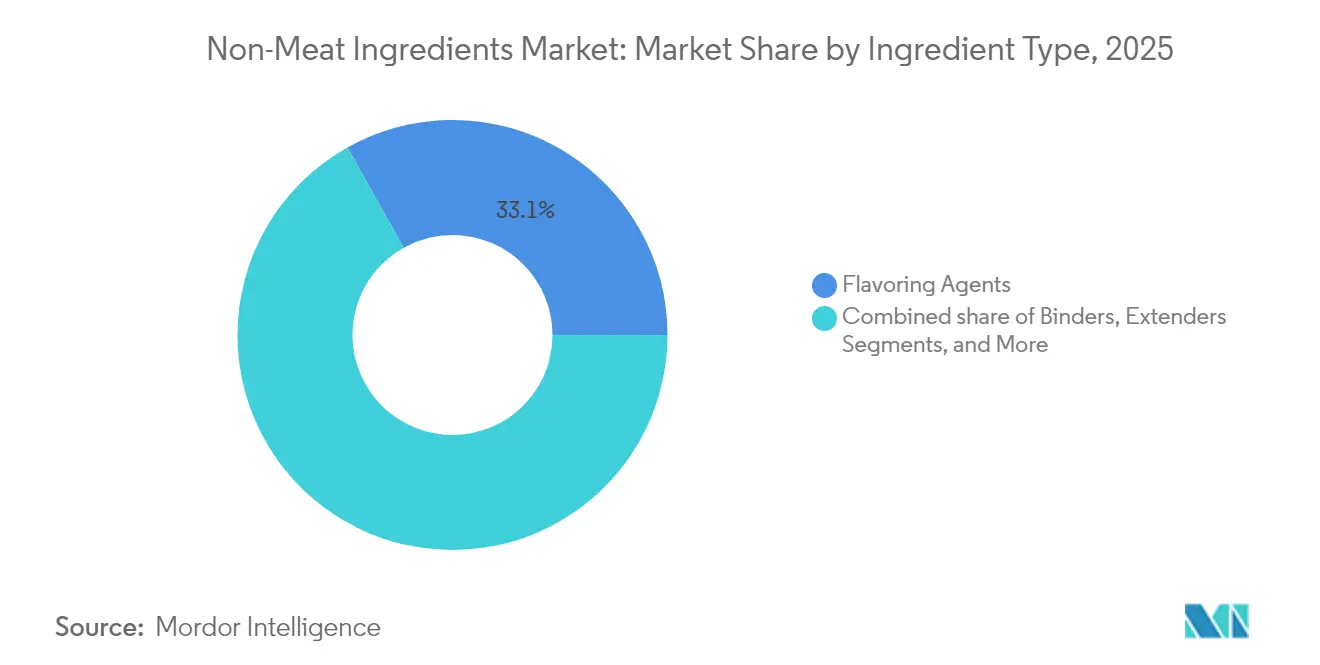
- By type, flavoring agents led with 33.12% revenue share in 2025, whereas preservatives are positioned to expand at the highest 6.08% CAGR to 2031.
- By application, processed and cured meat products accounted for 41.74% of the non-meat ingredients market in 2025, while plant-based meat analog formulations are advancing at an 8.02% CAGR between 2026-2031.
- By geography, North America commanded a 39.80% revenue share in 2025; Asia-Pacific is expected to post the strongest 6.98% CAGR through 2031.
Note: Market size and forecast figures in this report are generated using Mordor Intelligence’s proprietary estimation framework, updated with the latest available data and insights as of 2026.
Market Trends and Insights
Drivers Impact Analysis of Non-Meat Ingredients Market*
| Driver | (~) % Impact on CAGR Forecast | Geographic Relevance | Impact Timeline |
|---|---|---|---|
| Growing demand for processed meat products | +0.8% | Global, with higher impact in North America and Europe | Medium term (3-4 years) |
| Requirement for extended meat product shelf life | +0.9% | Global, with significant impact in developing regions | Short term (≤ 2 years) |
| Increasing consumption of convenience foods | +1.1% | North America, Europe, and urban centers in Asia-Pacific | Medium term (3-4 years) |
| Rising preference for protein-rich diets | +1.2% | Global, with higher impact in developed economies | Long term (≥ 5 years) |
| Increasing demand for plant-based meat analogs | +1.1% | North America, Europe, and urban Asia-Pacific | Long term (≥ 5 years) |
| Expanding market for hybrid meat-plant products | +0.9% | Europe, North America, and emerging markets in Asia-Pacific | Medium term (3-4 years) |
| Source: Mordor Intelligence | |||
Growing demand for processed meat products
The global processed meat market is experiencing significant growth, driven by evolving consumer preferences, urbanization, and innovations in production. Processed meat products, such as sausages, bacon, and deli meats, have become staples in developed countries, as highlighted by the USDA, while rising disposable incomes and urbanization in developing regions, as noted by UN-Habitat, are fueling demand for convenient, ready-to-eat options. Asia, which accounts for 54% of the global urban population, is projected to see its urban population grow by 1.2 billion by 2050, further amplifying this trend.[1] Additionally, advancements in non-meat ingredients, including binders, fillers, and flavor enhancers, have enabled manufacturers to meet diverse consumer preferences while maintaining product quality and extending shelf life. Regulatory frameworks, such as the European Union's food additive standards, have also played a crucial role in promoting food safety and encouraging the adoption of advanced production techniques. These factors collectively underscore the dynamic nature of the processed meat market, where innovation and regulatory compliance are pivotal in addressing evolving consumer demands and sustaining market growth.
Requirement for extended meat product shelf life
The requirement for extended shelf life in meat products is a significant driver of the Global Non-Meat Ingredients Market. Consumers increasingly seek convenience and longer-lasting food products, prompting manufacturers to incorporate non-meat ingredients such as preservatives, stabilizers, and antioxidants to enhance shelf life. For instance, the United States Department of Agriculture (USDA) has established guidelines for the use of food additives to ensure safety and quality in processed meat products [2]. Similarly, the European Food Safety Authority regulates the use of additives to maintain product integrity and extend shelf life. These regulatory frameworks encourage the adoption of non-meat ingredients, driving market growth. Additionally, associations like the North American Meat Institute emphasize the importance of shelf life extension to reduce food waste and meet consumer demands, further supporting the market's expansion.
Increasing consumption of convenience foods
The increasing consumption of convenience foods is driving the market growth. According to the United States Department of Agriculture (USDA), the demand for ready-to-eat and easy-to-prepare food products has been steadily rising due to changing consumer lifestyles and preferences. This shift in consumer behavior has led to a higher demand for non-meat ingredients, which play a crucial role in enhancing the taste, texture, nutritional value, and shelf life of convenience food products. For instance, emulsifiers, stabilizers, and flavor enhancers are widely used in processed foods to meet consumer expectations for quality and convenience. Associations like the Institute of Food Technologists (IFT) emphasize the importance of innovative non-meat ingredients in addressing the growing demand for functional and convenient food options [3]. Furthermore, the European Food Safety Authority (EFSA) has been actively involved in regulating and approving the use of non-meat ingredients to ensure food safety and quality, further supporting the growth of this market segment.
Rising preference for protein-rich diets
The rising preference for protein-rich diets is a significant driver of the market. Consumers are increasingly seeking alternative protein sources due to health concerns, dietary preferences, and ethical considerations. According to the United States Department of Agriculture (USDA), the demand for plant-based proteins has grown substantially in recent years, driven by a shift toward healthier eating habits. Additionally, the Food and Agriculture Organization highlights that global protein consumption is expected to rise steadily, further fueling the need for non-meat ingredients. Associations such as the Plant-Based Foods Association have also reported a surge in the production and consumption of plant-based protein products, reflecting this growing trend. This shift is creating opportunities for manufacturers to innovate and expand their product portfolios to cater to the evolving consumer preferences.
Restraints Impact Analysis of Non-Meat Ingredients Market*
| Restraint | (~) % Impact on CAGR Forecast | Geographic Relevance | Impact Timeline |
|---|---|---|---|
| High production costs of non-meat ingredients impacting product pricing and market adoption | -1.5% | Global, with higher impact in developing economies | Medium term (3-4 years) |
| Short shelf life of natural non-meat ingredients | -0.9% | Global, with significant impact in regions with less developed cold chain infrastructure | Short term (≤ 2 years) |
| Technical difficulties in maintaining consistent product texture and taste | -0.7% | Global, with particular challenges in plant-based formulations | Medium term (3-4 years) |
| Consumer concerns about artificial additives and preservatives in processed foods | -0.6% | North America and Europe primarily, spreading to urban Asia-Pacific | Long term (≥ 5 years) |
| Source: Mordor Intelligence | |||
High production costs of non-meat ingredients impacting product pricing and market adoption
Rising production costs for non-meat ingredients are influencing product pricing and slowing market adoption is hindering the market growth. For instance, according to the United States Department of Agriculture, the cost of plant-based proteins, a key non-meat ingredient, has been steadily increasing due to supply chain disruptions, higher raw material prices, and inflationary pressures. Moreover, the Food and Agriculture Organization (FAO) reports that the production of alternative proteins, such as pea and soy protein, is heavily impacted by fluctuating agricultural yields and climate change, leading to inconsistent supply and increased costs. These challenges are compounded by the high initial investment required for research and development (R&D) to improve the taste, texture, and nutritional profile of non-meat ingredients, which further escalates production expenses. As a result, manufacturers face difficulties in offering competitively priced products, limiting their ability to penetrate price-sensitive markets. These factors collectively hinder the widespread adoption of non-meat ingredients, particularly in emerging economies where affordability remains a critical factor for consumers.
Short shelf life of natural non-meat ingredients
The short shelf life of natural non-meat ingredients acts as a significant restraint in the Global Non-Meat Ingredients Market. These ingredients are prone to spoilage and degradation over a relatively short period, which poses challenges for manufacturers and suppliers in maintaining product quality and reducing wastage. This limitation impacts the supply chain and increases the operational costs associated with storage and transportation, thereby hindering market growth. Additionally, the perishability of these ingredients necessitates the use of advanced preservation techniques, which can further escalate production costs. The short shelf life also limits the scalability of production and distribution, particularly in regions with inadequate cold storage infrastructure. As a result, manufacturers face difficulties in meeting the growing demand for natural non-meat ingredients while ensuring consistent quality and minimizing losses.
*Our forecasts treat driver/restraint impacts as directional, not additive. The impact forecasts reflect baseline growth, mix effects, and variable interactions.
Non-Meat Ingredients Market Segment Analysis
By Ingredient Type:
Flavoring agents sustain leadership while clean-label preservatives surgeIn 2025, flavoring agents held a 33.12% share of the market, underscoring their pivotal role in meeting consumer demand for authentic taste profiles. These agents are essential for enhancing the sensory appeal of non-meat products, ensuring they deliver on taste and quality expectations. Moreover, they effectively mask vegetal undertones in hybrid products and maintain consistent flavor intensity during freeze-thaw cycles, which is critical for preserving product quality during storage and distribution. Their functionality highlights their importance as manufacturers continue to innovate to meet the evolving demands of the food industry, particularly in the context of plant-based and hybrid product development.
The preservatives sub-segment, forecasted to grow at a 6.08% CAGR, is experiencing robust demand driven by the shift toward synthetic-free and clean-label solutions. Consumers are increasingly favoring natural alternatives, prompting manufacturers to develop preservative solutions that extend shelf life while aligning with regulatory standards and consumer preferences for healthier, sustainable food options. This shift, coupled with advancements in ingredient technologies, is reshaping market dynamics. Manufacturers are prioritizing the development of high-quality, functional ingredients to cater to the diverse and growing needs of the food industry, particularly as plant-based and hybrid products gain traction.

By Application:
Traditional processed meat dominates while plant-based analogs accelerateProcessed and cured meat products represented 41.74% market share in 2025. They depend on phosphate-replacing binders, natural curing agents, and antimicrobial systems that preserve color and flavor. Clean-label brine formulations have enabled producers to claim nitrite-free labels without compromising safety metrics. In fresh meat, marinades that combine enzymes, natural acids, and flavor carriers are extending chilled storage life and reducing purge. These multi-purpose solutions are critical as retailers impose tougher shelf-life guarantees.
Plant-based meat analog applications, rising at an 8.02% CAGR, rely on tailored protein blends, hydrocolloids, and oil systems that mimic animal fat mouthfeel. High-pressure extrusion aligns protein fibers to produce structural integrity for burgers and sausages that withstand grill temperatures. Ingredient houses with expertise in lipid oxidation control are capitalizing on demand for stable unsaturated-oil systems, supporting longer frozen storage. This surge in plant-based applications adds recurring revenue streams and broadens the customer base for companies entrenched in the non-meat ingredients for meat processing market.
By Source:
Plant-derived ingredients dominate and retain fastest growth trajectoryIn 2025, plant-derived inputs captured a significant 64.75% share of the market, driven by a consistent supply of soy, pea, and other emerging pulses. The rising demand for plant-based alternatives in meat processing has been a major growth driver, as manufacturers increasingly focus on meeting consumer preferences for high-quality meat substitutes. Research highlights that combining plant proteins with native starches improves water retention and elasticity, critical factors for enhancing the texture and quality of restructured patties. These innovations not only address consumer expectations but also position plant-derived inputs as a key component in the evolving non-meat ingredients market.
Technological advancements have further strengthened the plant-derived segment. Improved fractionation techniques now enable the production of neutral-flavored fava and chickpea proteins, reducing the need for masking flavors and lowering formulation costs. This development enhances both product quality and cost efficiency for manufacturers. Additionally, increased capacity and efficiency in extruders and fermenters are expected to support the segment's growth. With a projected CAGR of 7.54%, plant-derived inputs are poised to play an increasingly significant role in shaping the global non-meat ingredients market.
Geography Analysis
North America Non-Meat Ingredients Market
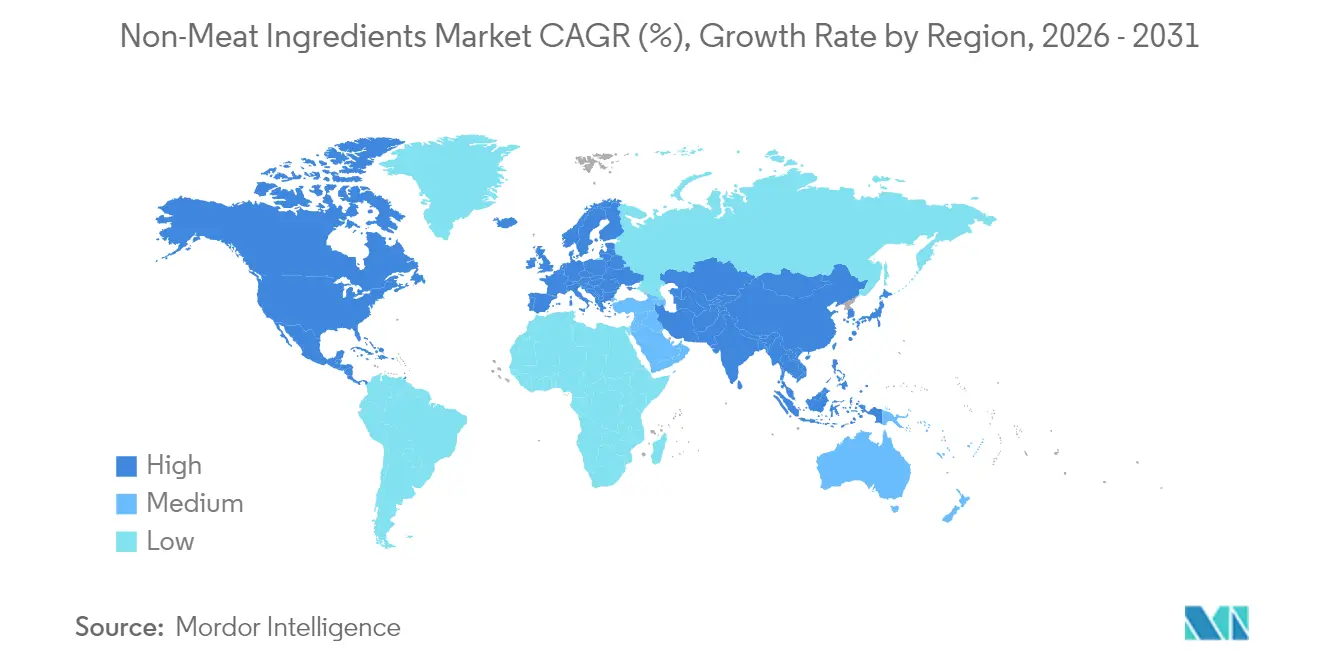
North America leads the non-meat ingredients market with a 39.80% share in 2025, driven by advanced food processing infrastructure and strict regulations promoting functional ingredients. Rising health concerns about processed meats fuel demand for clean labels and natural ingredients. The U.S. leads with a focus on specialty ingredients, enhancing nutrition and sensory appeal. Canada and Mexico are expanding applications due to growing meat processing and health awareness. Innovation targets multifunctional ingredients addressing preservation, texture, and nutrition.
Europe Non-Meat Ingredients Market
Europe, the second-largest market, is shaped by strict additive regulations and strong demand for clean-label products. The region leads in hybrid meat products, blending animal and plant proteins. Germany and the U.K. drive plant-based ingredient adoption, while France and Spain focus on natural preservatives and flavor enhancers. Mergers and acquisitions in the specialty ingredient sector are rising, with plant-based firms consolidating post-pandemic. This trend fosters integrated solutions for meat processing.
APAC, South America and MEA Non-Meat Ingredients Market
Asia-Pacific is projected to grow at a 6.98% CAGR from 2026-2031, driven by urbanization, rising meat consumption, and expanding food processing. China leads with investments in food technology and advanced ingredients for quality and safety, creating opportunities for suppliers of preservatives, flavor enhancers, and texture modifiers. India is emerging as a key market, with companies like Corbion expanding through acquisitions such as Novotech. South Korea drives innovation in fermentation-based functional ingredients. South America and the Middle East & Africa show steady growth, with Brazil and South Africa advancing due to expanding meat processing and rising food quality awareness.
Regulatory Landscape
The regulatory environment for non-meat ingredients is centered on additive authorization and specification rules, with increased scrutiny on hydrocolloids, colors, and novel ingredients used for texture, stability, and appearance in processed meat and plant-based analog formulations. In the European Union, Regulation (EC) No 1333/2008 continues to govern food additives, while Commission Regulation (EU) 2026/196 updated purity specifications and certain uses for multiple gum-based additives (including carrageenan, locust bean gum, guar gum, gum arabic, xanthan gum, and pectins) and for starch sodium octenyl succinate, with an exhaustion-of-stocks provision for products lawfully placed on the market before 18 August 2026.
In the United States, oversight spans FDA food additive and color additive frameworks, alongside FSMA-linked controls, which increases the importance of traceability and documentation for ingredient sourcing and downstream processing. FDA activity in color additives remains a key compliance watchpoint, with the agency approving Gardenia (genipin) blue for food use in July 2025 while also signaling a faster phase-out of FD&C Red No. 3. In parallel, EFSA guidance updates in 2026 on data requirements for food additive risk assessment highlight the need for robust dossiers and earlier planning for reformulations and new functional systems.
Value Chain Analysis
The value chain begins with agricultural and industrial feedstocks (soy, peas, pulses, starch sources, gums, salts, acids, and botanical extracts) and moves through ingredient processing such as fractionation, extraction, fermentation/bioconversion, and texturization to form functional systems (flavors, binders, extenders, stabilizers, colors, and preservatives). Branded ingredient suppliers and specialty blenders then tailor solutions for meat processors and manufacturers of plant-based analogs, with qualification cycles focused on sensory performance, yield, and shelf-life targets. Distribution typically covers direct supply to key-account processors and regional distribution for smaller formulators, while the chain increasingly depends on documentation tied to additive status, purity specifications, and customer clean-label requirements.
Recent moves point to continued regionalization and capability partnerships across upstream and midstream stages. Ingredion and Lantmannen entered a long-term collaboration in November 2024 to develop yellow pea-based protein isolates, linking product development to planned new production in Sweden. Tate and Lyle partnered with Manus in October 2024 to expand access to stevia Reb M produced via bioconversion at a facility in Augusta, Georgia, which uses manufacturing platforms to secure supply and keep performance consistent. Sourcing strategies also reflect trade-policy and cost volatility, with tariff changes in 2025 cited as disrupting inputs such as pea protein for some buyers, driving diversification of origins, contracted supply, and tighter specification management for functional ingredients.
Competitive Landscape
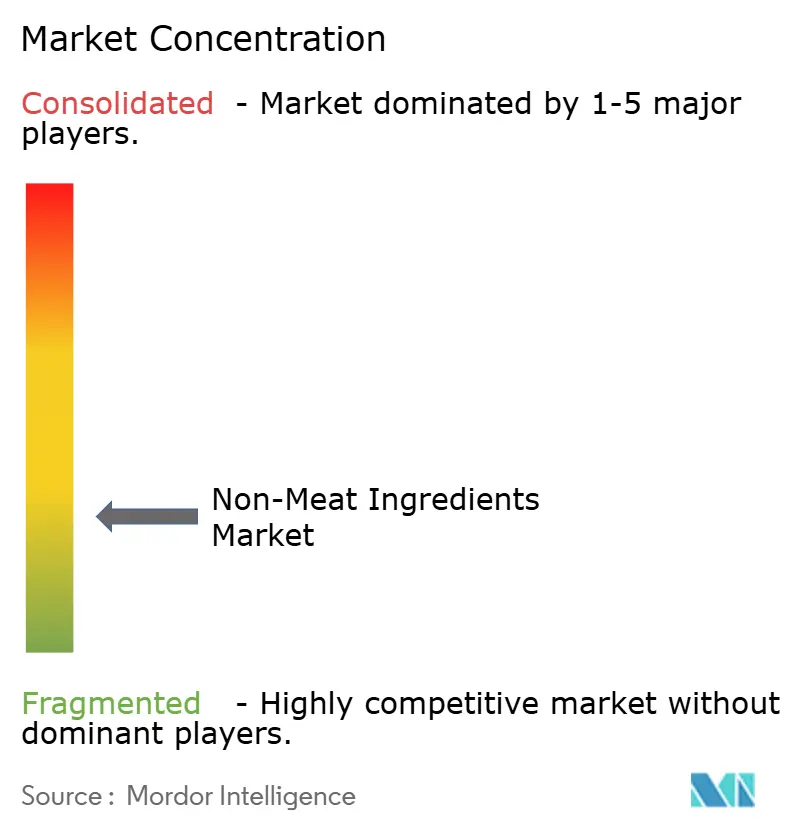
The non-meat ingredients market is fragmented, with global ingredient specialists and diversified food companies competing across various product categories. This competitive environment drives firms to differentiate through strategic consolidation. Companies are acquiring complementary businesses to expand portfolios, strengthen market presence, and meet the growing demand for innovative non-meat ingredients. This approach also enables them to cater to diverse applications, enhancing their value to end-users.
Innovation is a key strategy in this market. Companies are investing in R&D to develop proprietary ingredient systems addressing multiple functionalities, such as texture, flavor, and shelf life. Advanced technologies support these efforts, helping firms meet consumer preferences and regulatory standards. Collaboration with food manufacturers is also increasing, with co-developed solutions aligning with market trends and consumer demands.
Sustainability and clean-label solutions are gaining prominence as firms respond to consumer demand for transparency and eco-friendly products. Companies are adopting sustainable practices and diversifying product offerings to align with these preferences. Strategic partnerships and geographic expansion further strengthen market positions. Success in this dynamic landscape requires adaptability, strategic initiatives, and a strong focus on innovation.
Non-Meat Ingredients Industry Leaders
-
Archer Daniels Midland Company
-
Kerry Group plc
-
DSM-Firmenich
-
International Flavors & Fragrances Inc.
-
Cargill, Incorporated
- *Disclaimer: Major Players sorted in no particular order
Non-Meat Ingredients Market Companies Covered in this Report
- Archer Daniels Midland Company
- Kerry Group plc
- DSM-Firmenich
- International Flavors & Fragrances Inc.
- Ingredion Incorporated
- Associated British Foods PLC
- BASF SE
- Cargill, Incorporated
- Corbion N.V.
- Tate and Lyle PLC
- Sensient Technologies Corporation
- Kemin Industries
- Ajinomoto Inc.
- Novonesis
- Darling Ingredients
- Symrise AG
- Roquette Freres
- AGT Foods
- Florida Food products
- Givaudan S.A.
Market Opportunities and Future Outlook
Reformulation demand is opening room for ingredient systems that deliver clean-label functionality in processed meat and in plant-based analogs, particularly when manufacturers need to replace or reduce traditional additives while keeping shelf-life, texture, and color stable. The EU update to additive purity specifications in Commission Regulation (EU) 2026/196 creates a concrete compliance driver for suppliers of hydrocolloids and modified starches to refresh grades, validate specifications, and support customers with documentation and application guidance. EFSA publishing new 2026 guidance on data requirements for food additive authorization further increases the emphasis on robust evidence packages, favoring suppliers that can pair functional performance with regulatory-ready dossiers.
Capacity additions and platform partnerships are also expanding the addressable supply base for proteins and functional building blocks used in non-meat ingredient systems. In May 2026, Bunge opened a fully integrated soy protein concentrate and textured soy protein concentrate facility in Morristown, Indiana, adding industrial-scale availability for meat and analog applications and improving sourcing consistency for formulators. In July 2026, The EVERY Company partnered with ADM to begin commercial-scale production of animal-free egg protein (OvoPro) at ADM's Clinton, Iowa facility, expanding the toolset for hybrid and alternative formulations that need egg-like binding and foaming functionality without conventional animal inputs. Alongside localized processing expansion such as Bankom's soybean processing and textured soy protein investment in Serbia, these announcements support opportunities for suppliers to offer regionally produced, specification-compliant ingredient systems for large processors and emerging plant-based brands.
Recent Industry Developments in Non-Meat Ingredients Market
- July 2026: Archer Daniels Midland (ADM) partnered with The EVERY Company to begin commercial-scale production of animal-free egg protein (OvoPro) at ADM's Clinton, Iowa facility using precision fermentation. The move expands the functional ingredient toolkit for binding and foaming applications relevant to hybrid and alternative protein formulations, while leveraging established industrial infrastructure for scale.
- April 2026: Kerry Group opened an expanded biotechnology manufacturing hub in Carrigaline, Ireland, increasing production capacity for lactase enzymes used in lactose-free and reduced-sugar dairy. The expansion strengthens Kerry's ability to supply high-volume, specialty enzyme ingredients, reinforcing its position in functional ingredient solutions that support reformulation and process performance.
- February 2024: Kemin Industries acquired GLF Ingredienti Alimentari, a functional ingredients specialist based in Parma, Italy, to bolster its footprint in the EMEA meat sector. The acquisition added formulation expertise in functional blends and yield enhancement, supporting broader solution selling to meat processors that rely on non-meat ingredient systems for texture, stability, and process efficiency.
Non-Meat Ingredients Market Report Scope and Research Methodology
Market Definition and Coverage
This market tracks the value of non-meat ingredients used to formulate meat and meat-like products, mainly for binding, flavor, color, preservation, and texture, and it is measured as revenue generated from ingredient sales across major regions.
Scope exclusions: We do not count fresh meat, prepared meat products sold to consumers, or foodservice meal revenues, since only ingredient-level sales are sized.
Segments Covered in This Report
- By Type
- Flavoring Agents
- Binders
- Extenders
- Fillers
- Coloring Agents
- Preservatives
- Salt
- Others
- Application
- Processed and Cured Meat Products
- Fresh Meat Products
- Marinated and Seasoned Meat Products
- Frozen Meat Products
- Plant-Based Meat Analog Formulations
- Others
- By Source
- Plant-Derived
- Synthetic or Mineral-Derived
- Animal-Derived
- By Geography
- North America
- United States
- Canada
- Mexico
- Rest of North America
- Europe
- Germany
- United Kingdom
- Italy
- France
- Spain
- Netherlands
- Rest of Europe
- Asia-Pacific
- China
- India
- Japan
- Australia
- South Korea
- Rest of Asia-Pacific
- South America
- Brazil
- Argentina
- Rest of South America
- Middle East and Africa
- South Africa
- Saudi Arabia
- United Arab Emirates
- Rest of Middle East and Africa
- North America
Data Sources, Market Sizing, and Validation
Desk Research
Desk research was used to set the market boundary and build starting assumptions on processed meat output, ingredient usage intensity, and trade flow direction. The boundary work relied on public sources such as USDA and other national agriculture agencies, FAOSTAT, UN Comtrade, Codex Alimentarius references, and peer-reviewed food science journals that discuss ingredient functionality and usage rates.
For commercial reality checks, we also reviewed company annual reports, investor presentations, product specification sheets, and public news on capacity additions and pricing actions. In a few cases, paid subscriptions for company financials and an import and export shipment-level database were used to cross-check supplier footprint and shipment patterns. These examples are illustrative only, and many other public sources were also referenced for data collection, validation, and clarification.
Primary Interviews and Surveys
Primary work focused on interviews and structured surveys with ingredient suppliers, distributors, processors, and technical buyers who specify binders, extenders, colors, flavors, and preservatives for formulations. Respondent input was used to confirm inclusion rules, map typical treat rates by application, and pressure-test pricing movement and substitution between plant-derived, animal-derived, and synthetic or mineral-derived sources across regions.
Distribution of primary research fieldwork respondents
| Company type | Respondent position | Region |
|---|---|---|
| Top tier: 27% | CXOs: 13% | APAC: 49% |
| Mid tier: 57% | Functional/Unit leaders: 36% | EMEA: 31% |
| Smaller Players: 16% | Managers: 51% | Americas: 20% |
Market-Sizing & Forecasting
Sizing started from a top-down reconstruction where processed meat and related product output by region was combined with typical ingredient treat rates and conversion factors, and then translated into value using region-specific pricing. To keep the model practical, we treated application mix as a key driver, since fresh processed meat, cooked meat, sausages, and ready-to-eat lines pull different levels of binders, extenders, flavors, and preservatives.
We then corroborated totals with selective bottom-up approximations, such as rolling up a sample of supplier revenues by ingredient families, checking distributor throughput, and validating implied price per kilogram against quotes gathered during interviews. When a country-level data gap appeared, we used proxy indicators like trade flows, meat processing capacity signals, and packaged meat consumption trends, followed by a re-check with regional experts.
For forecasting, scenario analysis was used, since demand changes are usually tied to processed meat volumes, reformulation pressure, and price sensitivity, which do not move in a straight line. Variables tracked for the outlook included processed meat production growth, share shift toward convenience and frozen items, regulatory pressure on specific additives, substitution between natural and synthetic solutions, and the expected pricing path for key ingredient inputs.
Data Validation & Update Cycle
Model outputs were tested against independent signals like trade direction, implied ingredient intensity per ton of processed output, and supplier capacity commentary captured during interviews. If a variance looked too large for a region or ingredient group, we re-checked the boundary rules, revisited the price logic, and then re-contacted a small set of respondents to confirm whether a structural change had occurred.
Before sign-off, the build is reviewed in steps, including peer checks on assumptions and a final pass for outliers and currency consistency. Reports are refreshed annually, and interim updates are made when material events occur, such as regulation shifts, major capacity expansions, or sharp input-cost swings, followed by an analyst performing a fresh pre-delivery review.
Mordor Intelligence's Non Meat Ingredients Market Size Compared Against Other Published Estimates
Published figures for non-meat ingredients can differ even when the same words are used, because firms set boundaries differently and then apply their own price, year, and application-mix assumptions. In this study, we kept the model tied to ingredient sales value and checked it against repeatable demand signals, so the final number can be traced back to clear inputs.
Processed meat output signals and ingredient treat-rate checks are the evidence points that keep Mordor Intelligence's estimate anchored to ingredient-level revenue, instead of being inflated by counting finished food value or broader additive baskets. Other estimates can also shift due to base-year choice, how synthetic versus natural ingredients are grouped, and how currency conversion timing is handled for multi-region totals.
Benchmark comparison
| Source | Market Size | Gaps in Research Methodology |
|---|---|---|
| Mordor Intelligence | USD 45.08 B (2026) | |
| Global Consultancy A | USD 41.20 B (2024) | Uses an earlier value year and a different planning window, and the boundary is often anchored to a base-year build that can understate later price progression and mix shift into higher-functionality ingredients. |
| Industry Publisher B | USD 43.80 B (2025) | Applies a longer horizon with a higher growth curve, and may count a wider set of non-meat additives across food uses, which changes the effective basket and lifts the value compared with a meat and meat-like formulation scope. |
The spread in the table mainly comes from differences in year selection, what is counted inside the ingredient basket, and how pricing is carried forward. By keeping assumptions tied to treat rates, application mix, and region-level pricing checks, the estimate stays transparent, auditable, and easier to reproduce when new data points appear.
Key Questions Answered in the Report
What is the current value of the non-meat ingredients for meat processing market?
The market stands at USD 45.08 billion in 2026 and is projected to rise to USD 56.61 billion by 2031.
Which ingredient type commands the largest share today?
Flavoring agents lead with 33.12% of global revenue in 2025, reflecting their importance in taste differentiation.
Which application segment is growing fastest?
Plant-based meat analog formulations are forecast to post an 8.02% CAGR from 2026 to 2031.
Which region will see the quickest expansion through 2031?
Asia-Pacific is expected to register the strongest 6.98% CAGR owing to rising meat consumption and processing capacity.