Japan Data Center Power Market Size and Share
Market Overview
| Study Period | 2020 - 2031 |
|---|---|
| Forecast Data Period | 2026 - 2031 |
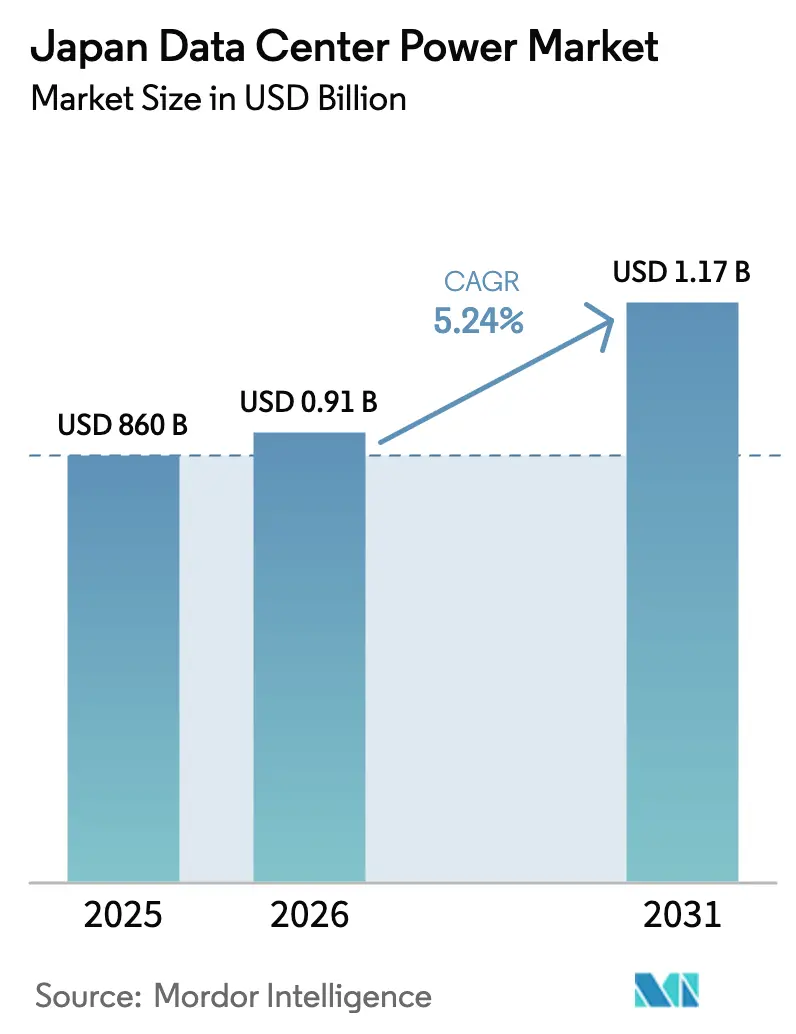
| Base Year Market Size (2025) | USD 860 Billion |
| Market Size (2026) | USD 0.91 Billion |
| Market Size (2031) | USD 1.17 Billion |
| Growth Rate (2026 - 2031) | 5.24% CAGR |
| Market Concentration | Medium |
Major Players *Disclaimer: Major Players sorted in no particular order Image © Mordor Intelligence. Reuse requires attribution under CC BY 4.0. | |
Japan Data Center Power Market Analysis by Mordor Intelligence
The Japan data center power market size is expected to grow from USD 860 million in 2025 to USD 910 million in 2026 and is forecast to reach USD 1.17 billion by 2031 at 5.24% CAGR over 2026-2031. Robust cloud-first strategies, fast-rising AI workloads, and a sustained push for carbon-neutral operations are combining to raise demand for resilient, energy-efficient infrastructure. The market is also buoyed by new submarine-cable landings that widen connectivity options and stimulate investment in secondary coastal cities. Power-hungry hyperscale campuses are increasing average facility capacity from 10-15 MW three years ago to well above 40 MW today, forcing utilities to reinforce local grids and driving operators toward on-site renewable generation and large battery systems. Grid fragmentation between the 50 Hz east and 60 Hz west continues to complicate interconnection strategies, yet it is spurring new partnerships focused on frequency-independent storage technologies. Corporate Power Purchase Agreements (PPAs) signed by Google and Equinix in 2024-2025 mark a decisive shift toward long-term renewable procurement contracts that buffer operators against volatile utility tariffs.
Key Report Takeaways
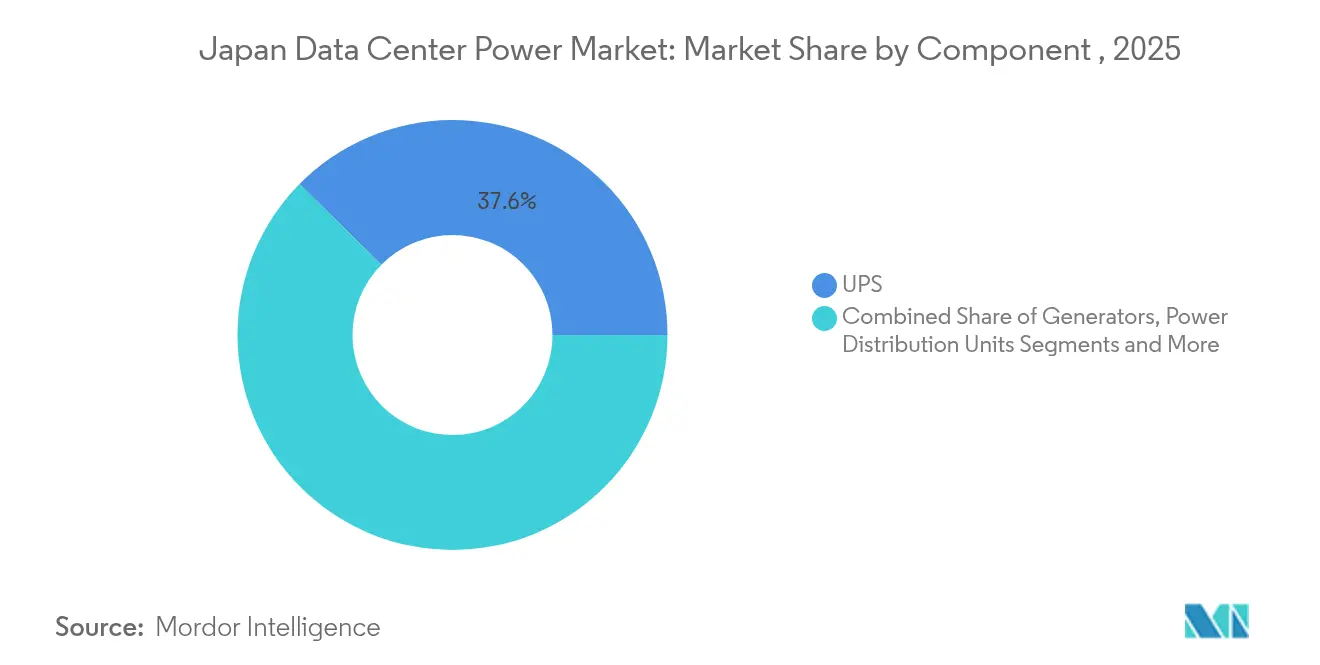
- By component, UPS systems led with 37.60% of Japan data center power market share in 2025; PDUs are projected to expand at a 6.45% CAGR through 2031.
- By data center type, colocation providers held 60.95% of the Japan data center power market share in 2025, while hyperscale/cloud facilities recorded the fastest forecast growth at 7.85% CAGR.
- By data center size, large facilities accounted for 40.75% of the Japan data center power market size in 2025; the mega category is set to grow at an 8.02% CAGR to 2031.
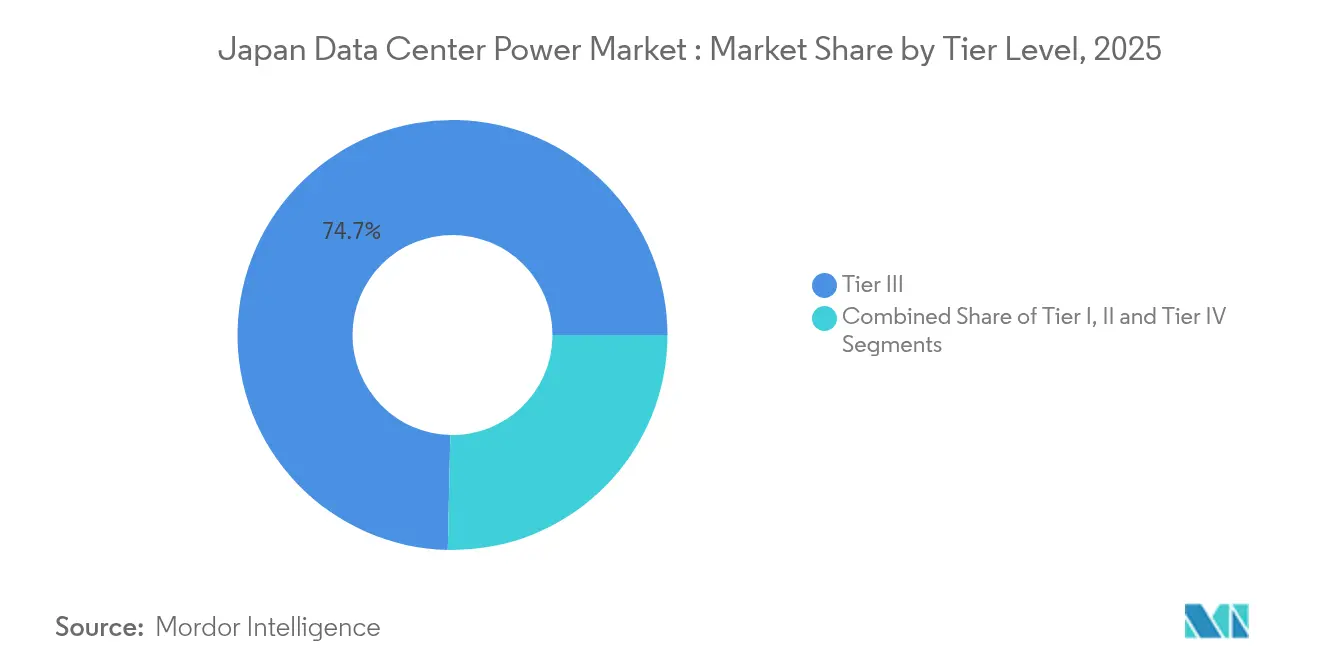
- By tier level, Tier III captured 74.65% revenue share of the Japan data center power market size in 2025, whereas Tier IV is advancing at a 7.18% CAGR through 2031.
Note: Market size and forecast figures in this report are generated using Mordor Intelligence’s proprietary estimation framework, updated with the latest available data and insights as of 2026.
Japan Data Center Power Market Trends and Insights
Drivers Impact Analysis*
| Driver | (~ ) % Impact on CAGR Forecast | Geographic Relevance | Impact Timeline |
|---|---|---|---|
| Hyperscale and cloud facility adoption | +1.5% | Tokyo, Osaka | Medium term (2-4 years) |
| Government digital-transformation programs | +2.1% | National, regional focus | Long term (≥ 4 years) |
| 5G roll-out and edge build-outs | +0.8% | Urban centers | Medium term (2-4 years) |
| Renewable power and carbon-neutral mandates | +0.6% | National | Long term (≥ 4 years) |
| Submarine-cable landings | +0.3% | Coastal regions | Medium term (2-4 years) |
| On-site PPAs and battery storage uptake | +0.2% | Urban centers | Short term (≤ 2 years) |
| Source: Mordor Intelligence | |||
Rising adoption of hyperscale and cloud facilities
Hyperscale operators now commission campuses exceeding 40 MW, pushing rack densities past 60 kW and occasionally 100 kW.[1] Raritan (Legrand), “Redesigning the Data Center for AI Workloads,” raritan.comSoftBank’s 300 MW Tomakomai complex in Hokkaido demonstrates how mega campuses decentralize processing loads while tapping cooler climates for free-air cooling advantages. Such scale drives localized grid congestion, especially around Tokyo, where new capacity requests face lead times of up to 36 months. Consequently, operators experiment with modular power blocks that work independently of grid constraints and allow phased expansion. This trend keeps the Japan data center power market on a steep modernization curve as facilities deploy lithium-ion-based UPS systems and busway distribution to accommodate volatile AI workloads
Government-led digital-transformation programs
The Green Growth Strategy requires data centers to draw from renewable sources as the national grid targets a 36-38% clean-energy share by 2030. Japan’s Climate Transition Bond program seeks JPY 120 trillion (USD 800 billion) to finance renewable projects that directly feed digital infrastructure.[2]OECD, “OECD Environmental Performance Reviews: Japan 2025,” oecd.orgAuthorities also offer fast-track permitting for power projects in regional prefectures rich in wind or solar resources, redirecting data center investment beyond the Tokyo-Osaka corridor. Incentives include tax reductions for equipment that improves power usage effectiveness (PUE), which helps raise the overall competitiveness of the Japan data center power market.
5G roll-out and edge build-outs accelerating demand
National 5G coverage fuels scores of 1-5 MW edge sites that, together, constitute a sizeable slice of new power demand. Light-based networking architectures reduce power draw by up to 40% and enable low-latency processing near end-users. Edge growth favors compact intelligent PDUs and high-efficiency rectifiers, a niche that firms such as Vertiv serve with custom units engineered for space-limited racks.[3]Vertiv, “Custom PDUs: Enabling the Future of Data Centers,” vertiv.com The edge wave, therefore, multiplies locations at which the Japan data center power market must deliver clean, stable electricity.
Renewable power and carbon-neutral mandates
Corporate PPAs signed in 2024 averaged JPY 11/kWh (USD 0.073/kWh), undercutting standard utility tariffs and locking in long-term green energy access. Experiments such as the 100% renewable offshore floating data center near Yokohama illustrate how operators address land scarcity while tapping wind and solar from microgrids . Hydrogen fuel-cell pilots by Honda and Mitsubishi signal added momentum behind zero-carbon backup power. Collectively, these measures expand the Japan data center power market by aligning energy procurement with carbon-reduction targets.
Restraint Impact Analysis*
| Restraint | (~ ) % Impact on CAGR Forecast | Geographic Relevance | Impact Timeline |
|---|---|---|---|
| High installation and maintenance CAPEX | -0.7% | National | Medium term (2-4 years) |
| Grid congestion and power-availability limits | -0.9% | Tokyo | Medium term (2-4 years) |
| Stringent seismic-resilience compliance costs | -0.4% | National | Long term (≥ 4 years) |
| Shortage of high-voltage power engineers | -0.3% | National | Short term (≤ 2 years) |
| Source: Mordor Intelligence | |||
Grid congestion and power-availability limits
Tokyo’s distribution network is strained by cumulative hyperscale loads that outpace substation upgrades. Operators queue for capacity reservations, delaying go-live dates and inflating project budgets. Battery energy storage systems (BESS) paired with PPAs offer interim relief but add to upfront spend. Utilities respond by reinforcing coastal transmission corridors that coincide with new submarine-cable landings, yet the lag keeps grid congestion a material brake on the Japan data center power market.
High installation and maintenance CAPEX
Building Japanese data centers costs USD 6-8 million per MW, roughly 15-20% above other Asia-Pacific markets. Elevated costs stem from strict seismic codes and premium land prices, especially inside the capital region. Electricity accounts for 30-40% of operating expenditure; recent fuel price spikes raised total power-related outlays by 40-50%. Such economics place pressure on smaller operators and may temper near-term additions to the Japan data center power market.
*Our forecasts treat driver/restraint impacts as directional, not additive. The impact forecasts reflect baseline growth, mix effects, and variable interactions.
Segment Analysis
By Component: UPS Systems Anchor the Reliability Agenda
UPS systems controlled 37.60% of the Japan data center power market in 2025, underscoring their role as a first-line defense against grid instability. Lithium-ion adoption shortens recharge cycles and lowers footprint despite a price premium, an acceptable trade-off for hyperscale campuses that target sub-1.3 PUE levels. The generator category is undergoing a pivot from diesel toward hydrogen fuel cells, a shift highlighted by pilot deployments in Shunan City that pair reused automotive cells with on-site solar arrays. PDUs, holding a vital position for high-density racks, will post the fastest component growth at 6.45% CAGR to 2031 due to granular metering and remote branch-level monitoring. This momentum keeps the Japan data center power market squarely focused on intelligent distribution technologies that integrate with DCIM platforms.
The UPS refresh cycle aligns with AI-driven compute clusters that demand stable power delivery at scale, pushing vendors to embed predictive analytics for battery health inside their firmware. Energy-storage modules linked to UPS frameworks help shave peak demand charges and improve renewable absorption rates. As carbon-free targets tighten, operators rely on continuous-cycle UPS architectures capable of syncing with microgrids that fluctuate when cloud cover or wind speeds change. The component mix, therefore, evolves toward systems that safeguard loads yet also act as grid-interactive assets within the wider Japan data center power market.


By Data Center Type: Colocation Retains Scale Advantage
Colocation providers account for 60.95% of total consumption because enterprises prize interconnection-rich campuses that deliver diverse carrier access and compliance clarity. Tokyo’s multi-tenant facilities remain preferred on-ramp sites into the broader Asian cloud fabric. Hyperscale cloud operators, while fewer in number, represent the fastest growth slice at 7.85% CAGR as domestic AI and machine-learning workloads surge. Public-sector digital-transformation programs and fintech adoption spur demand for secure cages and dedicated halls, reinforcing colocation’s central role in the Japan data center power market.
Edge and enterprise sites form a complementary layer that supports 5G latency targets. Their modest 1-5 MW footprints adopt modular power trains and containerized battery packs to shorten lead times. Combined, these tiers diversify locations at which Japan data center power market capacity is installed, cushioning the grid and raising overall resilience. International players partner with local power specialists to navigate regulatory hurdles tied to frequency mismatches and seismic safety, ensuring that new builds, whether colocation or hyperscale, integrate robust backup schemes from inception
By Data Center Size: Large Sites Remain the Backbone
Large-sized data centers held 40.75% of the 2025 demand, balancing capital efficiency with enough headroom for incremental growth. Tight urban parcels push operators to maximize vertical space and deploy chilled-water plants on rooftops, yet power feed availability remains the decisive factor. Large campuses anchor peering ecosystems where content, cloud, and financial firms converge, keeping them integral to the Japan data center power market size.
Mega campuses rise fastest, at 8.02% CAGR through 2031, enabled by land availability in Hokkaido and Kyushu, plus longer inter-substation corridors that ease permitting. These projects frequently negotiate direct lines to renewable generators, locking in competitively priced green electricity and stabilizing cost curves over 20-year horizons. Medium and small facilities, while not dominant, cater to specialized AI inference clusters and disease-modeling workloads that call for proximity to research institutes.

By Tier Level: Tier III Sets the Baseline, Tier IV Gains Traction
Tier III designs captured 74.65% of spending in 2025 because they hit the sweet spot between reliability and capex. Operators leverage modular UPS paths and N+1 mechanical loops that suit most enterprise SLAs. Regional hubs outside Tokyo adopt Tier III as their standard to attract disaster-recovery workloads seeking geographic separation. Consequently, Japan data center power market participants regard Tier III as a baseline for new builds.
Tier IV projects enjoy a 7.18% CAGR and cater to sectors such as capital markets and tele-health, where unplanned downtime is unacceptable. These facilities implement 2N+1 electrical feeds plus base-isolation pads that mitigate seismic shocks, adding 15-20% to construction cost yet ensuring 99.995% availability.
Geography Analysis
Tokyo claims nearly significant share of installed capacity, surpassing 1 GW and hosting dense interconnection fabrics that tie in banking, content, and gaming ecosystems Land scarcity forces vertical builds while grid congestion drives on-site solar rooftops and battery arrays that cushion utility fluctuations. Equinix’s new PPA covers part of its Tokyo load with solar, illustrating how operators decarbonize even in space-constrained districts The Japan data center power market size in the capital will climb steadily, yet future growth hinges on successful grid reinforcements and demand-response participation that unlock extra headroom.
Osaka stands as the second pole, leveraging submarine-cable diversity and moderate land costs to position itself as a resilient alternative. Recent 72 MW and 46 MW builds showcase the city’s ability to host hyperscale nodes without Tokyo’s transfer delays. Operators appreciate Osaka’s balanced risk profile: strong fiber backbones, lower seismic frequency than the Kanto region, and cooperative municipal energy policies. These factors keep the Japan data center power market distributed and hedge national uptime against regional disruptions.
Competitive Landscape
Global power-equipment majors and domestic electrical giants compete within a moderately consolidated arena. Mitsubishi Electric and Hitachi Energy tailor switchgear and busduct solutions that comply with Japan’s 50 Hz- 60 Hz duality, while Schneider Electric and ABB integrate digital twins for predictive load balancing. Partnerships abound: Fujitsu collaborates with Supermicro and Nidec to trim server and cooling energy footprints, illustrating cross-layer innovation. The Japan data center power market rewards firms that blend local regulatory fluency with advanced modular designs.
Hydrogen fuel-cell consortia, such as Honda-Mitsubishi’s Shunan pilot, target zero-carbon backup and could erode diesel generator share if cost curves fall [slashdot.org]. Digital Edge aligns with Donghwa ES to commercialize alternative battery chemistries that lengthen lifecycle and cut footprint. Storage-centric newcomers join established UPS brands in vying for edge deployments where space and latency constraints call for integrated power racks.
Japan Data Center Power Industry Leaders
ABB Ltd
Schneider Electric SE
Vertiv Group Corp.
Eaton Corporation
Caterpillar Inc.
- *Disclaimer: Major Players sorted in no particular order

Recent Industry Developments
- May 2025: NTT launched an energy storage division to design data-center-specific battery systems that reinforce its domestic footprint.
- May 2025: Fujitsu, Supermicro, and Nidec began a joint energy-efficiency program focused on improved cooling and power distribution.
- May 2025: Digital Edge and Donghwa ES partnered to create next-generation storage for data center redundancy.
- April 2025: Equinix signed its first Japanese PPA with Trinasolar ISBU, deepening its renewable portfolio.


Research Methodology Framework and Report Scope
Market Definitions and Key Coverage
Our study defines Japan's data center power market as all revenue from new or replacement electrical systems (UPS, diesel or gas generators, switchgear, PDUs, remote power panels, energy-storage units) and the related installation, maintenance, and training services that keep colocation, cloud, and enterprise facilities energized. According to Mordor Intelligence, figures are expressed in constant 2024 USD and span every tier and size of center now operating or planned within Japan.
Scope exclusion: We explicitly exclude cooling equipment, IT hardware, building works, and renewable-energy off-site contracts.
Segmentation Overview
- By Component
- Electrical Solutions
- UPS Systems
- Generators
- Diesel Generators
- Gas Generators
- Hydrogen Fuel-cell Generators
- Power Distribution Units
- Switchgear
- Transfer Switches
- Remote Power Panels
- Energy-storage Systems
- Service
- Installation and Commissioning
- Maintenance and Support
- Training and Consulting
- Electrical Solutions
- By Data Center Type
- Hyperscaler/Cloud Service Providers
- Colocation Providers
- Enterprise and Edge Data Center
- By Data Center Size
- Small Size Data Centers
- Medium Size Data Centers
- Large Size Data Centers
- Massive Size Data Centers
- Mega Size Data Centers
- By Tier Level
- Tier I and II
- Tier III
- Tier IV
Detailed Research Methodology and Data Validation
Primary Research
Our analysts interviewed facility operators in Tokyo and Osaka, electrical distributors, EPC contractors, and academic specialists across Asia-Pacific. These exchanges clarified average load factors, price spreads between diesel and gas sets, and realistic adoption curves for battery-based UPS banks, letting us validate secondary ratios and close data gaps.
Desk Research
We began by mapping national data-center IT load from the Organisation for Cross-regional Coordination of Transmission Operators, electricity statistics from METI, and customs records that chart annual imports of UPS units and generators. Additional insight came from the Japan Data Center Council, International Energy Agency, peer-reviewed journals on facility efficiency, and financial filings via D&B Hoovers, with news checks on Dow Jones Factiva. Patent trends extracted through Questel highlighted emerging lithium-ion chemistries influencing demand. This list illustrates, but does not exhaust, the diverse open sources we tapped.
Market-Sizing & Forecasting
We apply a top-down build. National data-center megawatt capacity is multiplied by benchmark power-infrastructure spend per megawatt, then split by component. Supplier roll-ups and channel checks give a bottom-up reasonableness test that nudges totals where needed. Key variables include new white-space additions, rack density, electricity tariffs, renewable-purchase targets, and lithium-ion penetration, which feed a multivariate regression with an ARIMA overlay through 2030. Missing shipment datapoints are bridged with a three-year moving average anchored to customs growth.
Data Validation & Update Cycle
We send outputs through variance checks against historic capex ratios, a senior-analyst peer review, and when deviations surpass eight percent, a fresh call to sources. We refresh models each year and push interim updates after major campus announcements or policy shifts, with a last-mile check before release.
Why Mordor's Japan Data Center Power Baseline Commands Reliability
We observe that published estimates differ because firms mix scopes, capitalize multi-year service contracts differently, and refresh at varied intervals.
We find the largest gaps stem from including cooling equipment, front loading EPC contracts, or extrapolating global density curves without Japan-specific limits.
Benchmark comparison
| Market Size | Anonymized source | Primary gap driver |
|---|---|---|
| USD 0.86 B (2025) | Mordor Intelligence | |
| USD 1.50 B (2024) | Regional Consultancy A | Cooling and project services included |
| USD 0.49 B (2024) | Industry Databook B | Uses export values only, omits domestic switchgear output |
These comparisons show how Mordor's disciplined scope, variable tracking, and annual refresh deliver a balanced and transparent baseline that planners can trust.


Key Questions Answered in the Report
What is the current value of the Japan data center power market?
The market stands at USD 910 million in 2026 and is expected to hit USD 1.17 billion by 2031.
Which component segment holds the largest share?
UPS systems dominate with 37.60% share due to their critical role in maintaining uptime.
Why is grid congestion a pressing issue in Tokyo?
Hyperscale campuses have driven demand beyond substation upgrades, leading to 36-month wait times for new power feeds.
How are operators sourcing renewable energy?
Long-term corporate PPAs, such as Google’s 60 MW solar contracts, lock in green electricity at competitive rates.
What growth rate is forecast for mega data centers?
The mega category is projected to grow at an 8.02% CAGR between 2026 and 2031 as AI workloads soar.
Page last updated on:


