New Zealand Courier, Express, And Parcel (CEP) Market Size and Share
Market Overview
| Study Period | 2020 - 2031 |
|---|---|
| Forecast Data Period | 2026 - 2031 |
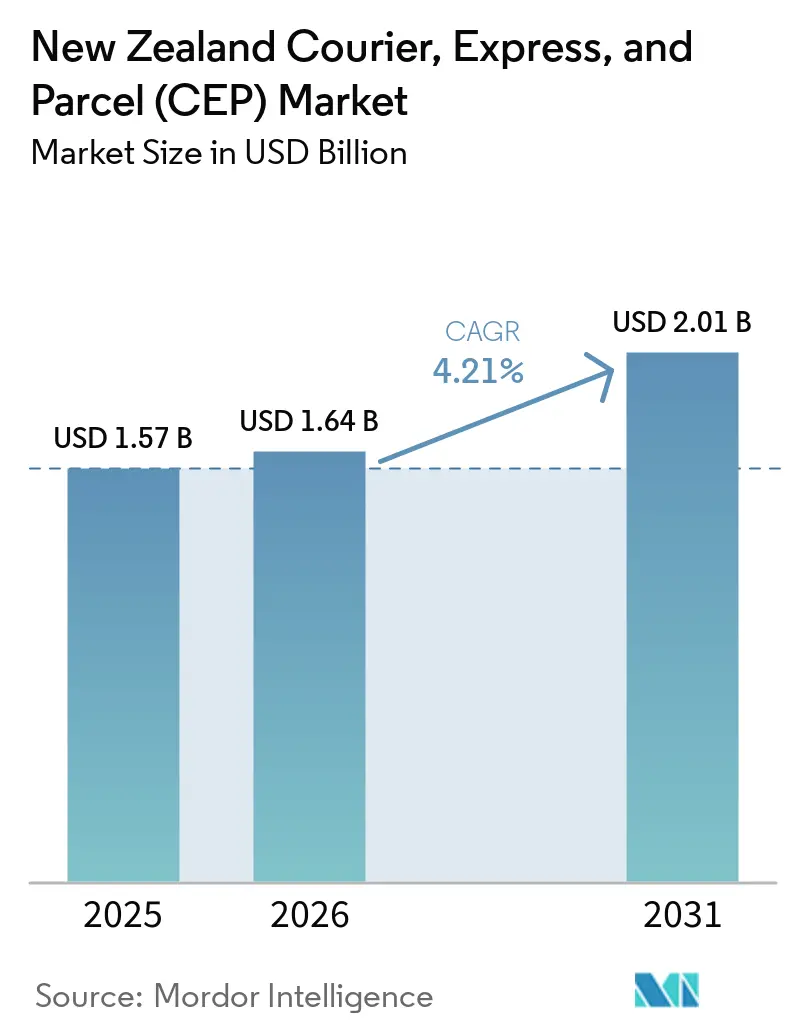
| Base Year Market Size (2025) | USD 1.57 Billion |
| Market Size (2026) | USD 1.64 Billion |
| Market Size (2031) | USD 2.01 Billion |
| Growth Rate (2026 - 2030) | 4.21% CAGR |
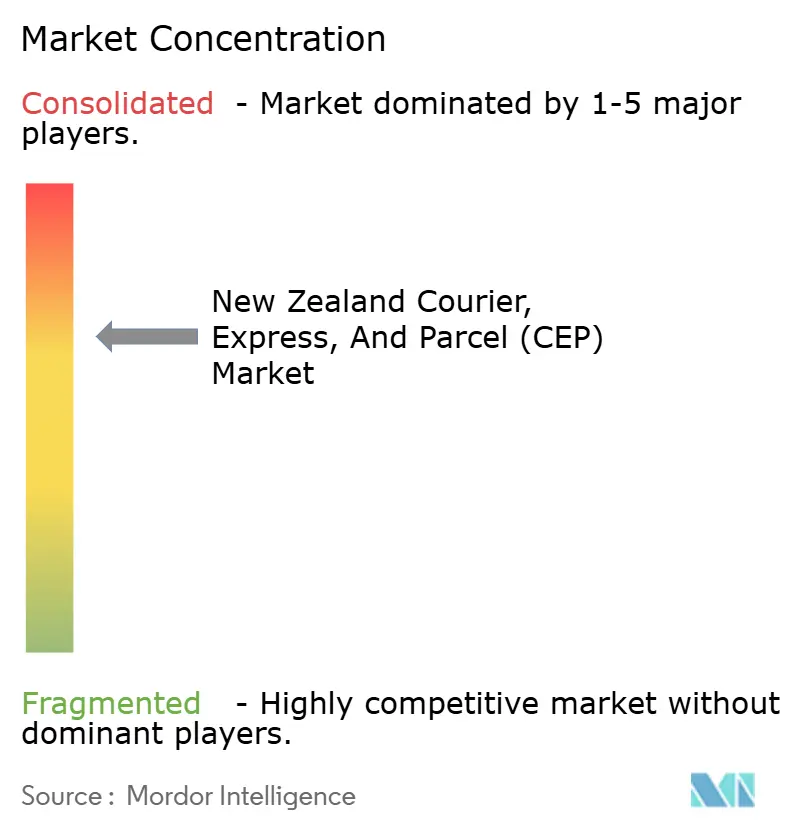
| Market Concentration | Medium |
Major Players *Disclaimer: Major Players sorted in no particular order Image © Mordor Intelligence. Reuse requires attribution under CC BY 4.0. | |
New Zealand Courier, Express, And Parcel (CEP) Market Analysis by Mordor Intelligence
The New Zealand courier, express, and parcel (CEP) market size is expected to grow from USD 1.57 billion in 2025 to USD 1.64 billion in 2026 and is forecast to reach USD 2.01 billion by 2031 at 4.21% CAGR over 2026-2031.
Intensifying online shopping, stricter cross-border VAT rules with Australia, and a pivot toward automated cold-chain hubs are lifting shipment volumes even as tight Auckland warehouse supply, aircraft engine issues, and biosecurity checks add cost friction. Global integrators are accelerating capital spending on carbon-neutral gateways, while domestic operators are rationalizing depots and adding economy road services to defend margins. Reverse-logistics growth from omnichannel returns and C2C resale, alongside direct-to-patient pharma distribution, is broadening service mixes and sustaining the New Zealand courier, express, and parcel market’s profitability outlook. Rising scrutiny of “green delivery” claims and the 2026 emissions-reduction reforms are steering fleets toward electric trucks, optimized routes, and validated carbon reporting.
Key Report Takeaways
- By destination, domestic parcels led with 64.72% of the New Zealand courier, express, and parcel (CEP) market share in 2025, while international parcels are projected to expand at a 4.75% CAGR through 2031.
- By speed of delivery, non-express services accounted for 71.8% share of the New Zealand courier, express, and parcel (CEP) market size in 2025, and express shipments are forecast to advance at a 4.91% CAGR between 2026 and 2031.
- By business model, B2C captured 53.66% share in 2025, whereas C2C parcels are set to grow fastest at 7.43% CAGR to 2031.
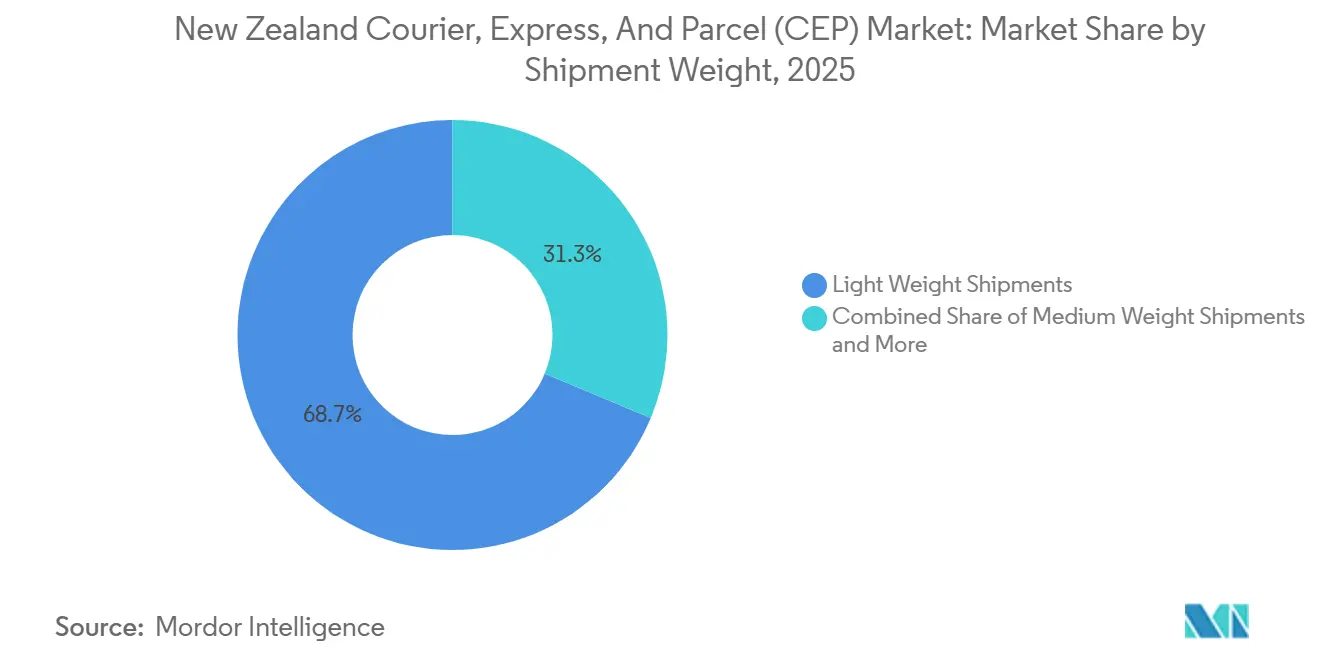
- By shipment weight, light parcels dominated with 68.76% share in 2025, yet medium-weight consignments are predicted to expand at 5.28% CAGR over 2026-2031.
- By mode of transport, road held 57.48% of the New Zealand courier, express, and parcel (CEP) market share in 2025, while air freight is positioned for 5.11% CAGR despite current belly-hold constraints.
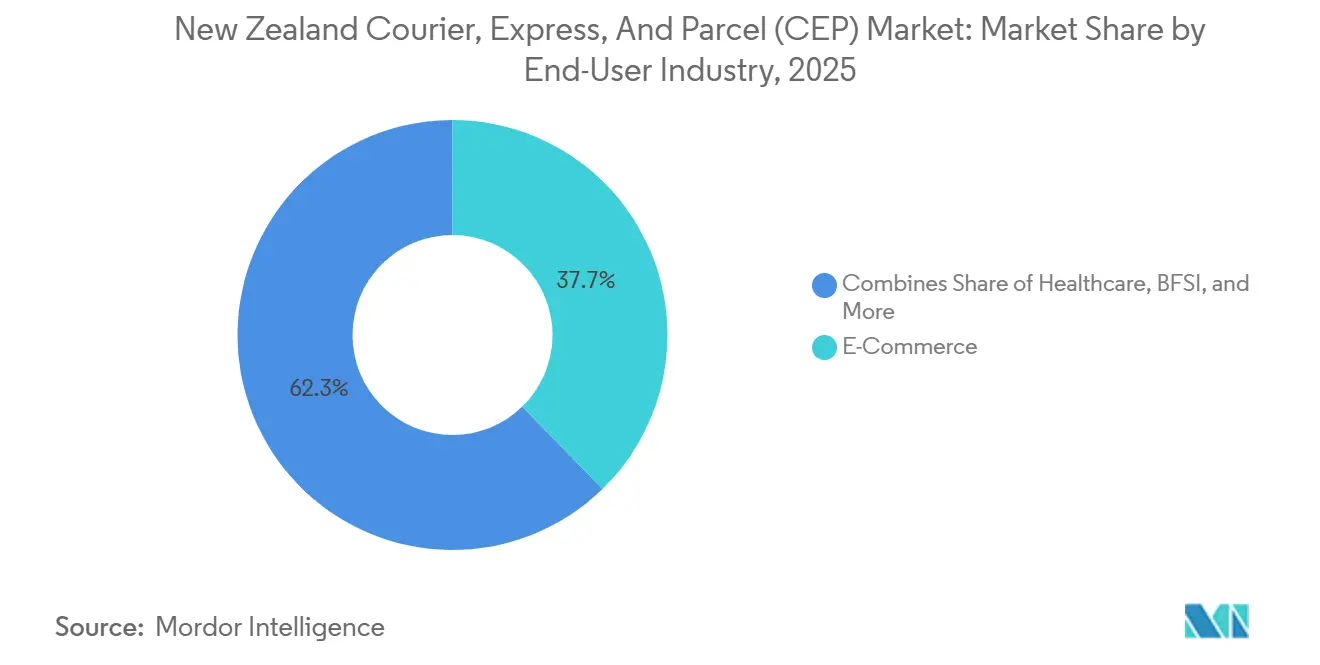
- By end-user, e-commerce represented 37.77% share of the New Zealand courier, express, and parcel (CEP) market size in 2025, but healthcare parcels are on track for the quickest rise at 5.34% CAGR through 2031.
Note: Market size and forecast figures in this report are generated using Mordor Intelligence’s proprietary estimation framework, updated with the latest available data and insights as of January 2026.
New Zealand Courier, Express, And Parcel (CEP) Market Trends and Insights
Drivers Impact Analysis*
| Driver | (~) % Impact on CAGR Forecast | Geographic Relevance | Impact Timeline |
|---|---|---|---|
| Omni-channel retail returns surge | +0.8% | Auckland, Wellington, Christchurch | Short term (≤ 2 years) |
| Healthcare cold-chain parcel growth | +0.7% | National, with an Auckland hub reach | Medium term (2-4 years) |
| Simplified NZ–AU cross-border VAT rules | +0.5% | Auckland and Christchurch gateways | Medium term (2-4 years) |
| Carbon-neutral delivery mandates | +0.3% | National, early in Wellington and Auckland | Long term (≥ 4 years) |
| Pacific islands corridor expansion | +0.3% | Auckland–Pacific links | Medium term (2-4 years) |
| On-demand 3D-printed parts delivery | +0.2% | Auckland, Canterbury, Waikato | Long term (≥ 4 years) |
| Source: Mordor Intelligence | |||
Omni-Channel Retail Returns Surge (Reverse-Logistics Volumes)
Return rates averaged 9.2% in 2024, climbing to 18-23% for apparel, which is forcing retailers to adopt frictionless returns and generating near-parity reverse flows in major metros. NZ Post now offers next-day courier or 3-day economy returns with compensation cover, billing only on label use, and meeting Consumer Guarantees Act obligations that sellers fund faulty-goods returns. Third-party specialists provide inspection, grading, and zero-landfill recycling, allowing merchants to recover value and create added parcel legs. These dynamics are projected to lift the New Zealand courier, express, and parcel market CAGR by 0.8 percentage points in the short term. Activity clusters around Auckland, Wellington, and Christchurch, where omnichannel density is highest.
Healthcare Cold-Chain Parcel Growth (Pharma and Diagnostics)
Pharmac’s decision to designate DHL as the national vaccine storage and distribution provider from February 2026 signals consolidation of temperature-controlled logistics. DHL’s NZD 90 million (USD 61.6 million) Auckland facility brought 12,000 pallet spaces and 41 goods-to-person robots online in November 2025, boosting national healthcare capacity by 20%, supporting direct-to-patient flows, and ensuring -30 °C to 8 °C compliance. Hall’s Cold Chain Logistics complements the network with nine storage sites and 640+ climate-controlled trucks. Stringent Ministry of Health standards and 24-month demand forecasting underpin predictable, premium parcel volumes set to add 0.7 percentage points to medium-term growth[1]“National Immunisation Programme & Supply Chain,” Ministry of Health New Zealand, health.govt.nz.
Simplified NZ–AU Cross-Border VAT Rules Lifting Parcel Traffic
Retention of New Zealand’s NZD 1000 GST de minimis and CER tariff simplicity, coupled with Australia’s high inspection thresholds, is channeling shippers toward courier DDP models assisted by FedEx’s Import Tool, launched in August 2025 for real-time customs visibility. Air New Zealand restored Tasman capacity by 9-10% versus 2025, while DHL’s Christchurch Gateway will add 6,500 parcels-per-hour inbound throughput from 2026. These measures are expected to push the market CAGR up by 0.5 percentage points over the medium term[2]“Annual Report 2025,” New Zealand Customs Service, customs.govt.nz.
Carbon-Neutral Delivery Mandates in Government Procurement
2026 reforms to the Climate Change Response Act and a landmark Supreme Court judgment require climate impacts to be considered in resource decisions, intensifying fleet decarbonization. FedEx grew its Asia-Pacific EV fleet past 8,018 vehicles and uses AI route optimization to cut mileage. KiwiRail targets 40% fewer Scope 1 & 2 emissions by 2035, and DHL’s Christchurch Gateway will be the first fully carbon-neutral parcel hub nationwide. Mandated emission cuts in public contracts are forecast to raise growth by 0.3 percentage points over the long term.
Restraints Impact Analysis*
| Restraint | (~) % Impact on CAGR Forecast | Geographic Relevance | Impact Timeline |
|---|---|---|---|
| Escalating Auckland warehouse lease rates | -0.6% | Auckland metro | Short term (≤ 2 years) |
| Airline belly-hold capacity cuts | -0.4% | National long-haul and domestic air | Medium term (2-4 years) |
| Stricter biosecurity inspections | -0.5% | Auckland gateway | Short term (≤ 2 years) |
| Cyber-insurance premium spikes | -0.3% | Nationwide | Medium term (2-4 years) |
| Source: Mordor Intelligence | |||
Escalating Auckland Warehouse Lease Rates Compressing Margins
Industrial vacancy in Auckland dipped to 1.6-2.2% by December 2025, pushing average outgoings up 6.6% to NZD 33 per m² (USD 18.9 per m²) and squeezing last-mile margins as 60% of national parcels transit through the city’s hubs. Industry experts forecast another 3-4% rent rise through 2027, forcing network consolidation and heightened competition for prime sites. The pressure is expected to shave 0.6 percentage points from near-term CAGR[3]“Building and Construction Statistics,” Stats NZ, stats.govt.nz.
Airline Belly-Hold Capacity Cuts from Fleet Renewal Delays
Air New Zealand’s engine issues have grounded multiple A321neo and up to four 787s until H2 2026, contributing to a 7% cargo revenue drop to NZD 239 million (USD 137 million) in December 2025 and lowering international capacity about 10% below pre-COVID levels. Freightways must replace aging 737-400s after partner Airwork entered receivership. These cuts are set to curb CAGR by 0.4 percentage points over the medium horizon[4]“Air Freight and Aviation Sector Updates,” Ministry of Transport New Zealand, transport.govt.nz.
*Our forecasts treat driver/restraint impacts as directional, not additive. The impact forecasts reflect baseline growth, mix effects, and variable interactions.
Segment Analysis
By End-User Industry: Healthcare Leads Future Expansion
E-commerce commanded 37.77% of the New Zealand courier, express, and parcel market share in 2025, anchoring volume growth with rising online spend. Healthcare parcels, though smaller in base, are anticipated to record the fastest 5.34% CAGR, supported by Pharmac-led vaccine distribution and DHL’s 12,000-pallet cold-chain expansion.
Manufacturing and primary industries leverage temperature-controlled freight and on-demand spares to increase uptime, whereas BFSI, wholesale, and public sector volumes remain niche but steady. Biosecurity queues pose an occasional risk for agricultural imports.


By Destination: International Parcels Outpace Domestic Growth
Domestic traffic dominated the New Zealand courier, express, and parcel market size with 64.72% share in 2025, as the Golden Triangle handled the bulk of inland flows. Investments such as NZ Post’s 30,000-parcel-per-hour Auckland Processing Center and depot rationalization strategies continue to anchor domestic efficiency.
International parcels, chiefly on the trans-Tasman corridor, are forecast to climb at 4.75% CAGR through 2031, fueled by simplified VAT rules, Pacific Islands expansion, and FedEx’s self-service customs platform. DHL’s Christchurch Gateway, opening 2026, will further lift capacity by sorting 6 500 inbound parcels hourly, positioning South Island exporters for faster clearance.
By Speed of Delivery: Express Regains Momentum within Tight Capacity
Non-express services preserved 71.8% of New Zealand courier, express, and parcel market share in 2025 thanks to lower cost tolerance among shippers and efficient road networks. Growing returns volumes and oversize freight favor 2-3 day delivery windows.
Express shipments, however, are projected to expand 4.91% CAGR, underpinned by healthcare cold-chain urgency and same-day retail commitments. Freightways’ Christchurch hub upgrade will double nightly sortation to 70,000 items and increase freighter rotations, while DHL integrates high-speed X-ray lanes for sub-24-hour cut-offs.
By Shipment Weight: Medium-Weight Consignments Gain Share
Light parcels under 2 kg represented 68.76% of shipments in 2025, benefiting from NZ Post’s automated OCR sortation. Yet medium-weight freight between 2-25 kg should climb 5.28% CAGR on the back of agritech machinery moves and pharma pallets using DHL’s VNA robotics.
Freightways’ Kiwi Oversize and Big Chill units service bulky or chilled goods, targeting NZD 10 million (USD 5.7 million) incremental revenue annually. Dimensional-weight rules impose surcharges on low-density items, nudging clients to optimize packaging or accept higher rates.
By Mode of Transport: Air Lift Rebounds Despite Grounded Jets
Road transport held 57.48% of the New Zealand courier, express, and parcel market size in 2025, as most national lanes fall within two days of truck transit. KiwiRail’s 2035 target to cut Scope 1 & 2 emissions by 40% is expected to shift heavier consignments from road to rail, further greening ground networks.
Air freight is forecast to grow 5.11% CAGR, driven by overnight express and cross-border demand. Despite Air New Zealand belly-hold shortages, new 737-800 freighters entering the Parcelair fleet in late 2026 will preserve dedicated lift, while DHL’s Christchurch Gateway secures direct airside access.
By Business Model: Peer-to-Peer C2C Parcels Accelerate
B2C parcels retained 53.66% of the New Zealand courier, express, and parcel market share in 2025, supported by NZD 6.09 billion online sales, but C2C flows are forecast to surge 7.43% CAGR as resale platforms normalize second-hand purchasing. NZ Post’s label-on-demand Returns service and Freightways’ Pass the Parcel tool streamline peer-to-peer shipping.
Merchants continue to embed reverse logistics in cost structures to comply with the Consumer Guarantees Act, ensuring steady C2C parcel velocity. B2B volumes grow modestly as manufacturers rebalance inventory amid lean supply chains, though they remain sensitive to Auckland lease hikes.
Geography Analysis
Auckland, Hamilton, and Tauranga, the Golden Triangle, handle more than 60% of national parcel flows, with Auckland gateways underpinning the largest New Zealand courier, express, and parcel market size nodes. Vacancy of 1.6-2.2% and rents at NZD 33 (USD 18.9) per m² are squeezing operators, compelling consolidation of depots and heavier reliance on automation to lift throughput.
Christchurch is emerging as a high-growth hub. DHL’s carbon-neutral Gateway and Freightways’ hub expansion will double sort capacity to 70,000 items nightly and raise aircraft rotations, unlocking South Island potential and providing redundancy for North Island disruptions. Wellington’s central-government contracts anchor early adoption of carbon-neutral delivery, adding demand for verified low-emission parcel services.
Rural sectors face longer lead times and surcharges under the revised Postal Deed, yet Pacific Islands corridors benefit from 9-10% increased Tasman capacity and DHL’s Auckland life-sciences exports. Automated risk-assessment screens 80% of inbound mail at the Auckland Processing Center, achieving 99.82% biosecurity compliance and supporting faster regional redistribution.
Competitive Landscape
Freightways and NZ Post form a dual core, with DHL, FedEx, UPS, and Team Global Express intensifying competition through targeted capex. Freightways processed roughly 100 million items in 2025 and lifted EBITA 12.7% to NZD 96.5 million (USD 55.4 million) in H1 FY2026 by emphasizing economy road services and a NZD 10 million (USD 5.7 million) pricing-platform overhaul. NZ Post transitioned eight Auckland depots into four automated centers, reallocating mail capacity toward parcels as letter volumes plunged to 158 million items.
DHL allocated NZD 132 million (USD 75.8 million) across its life-sciences hub and Christchurch Gateway, pursuing first-mover advantage in healthcare and carbon-neutral delivery. FedEx’s March 2026 AI upskilling partnership with Accenture trains 500 000 staff on the LearnVantage platform, incorporating role-specific modules for couriers and customs agents that elevate service accuracy and throughput.
Technology adoption ranges from NZ Post’s tomography-based 3D imaging for remote X-ray screening to Freightways’ predictive billing logic. Regulatory oversight on emissions claims and automated customs workflows is narrowing performance gaps, but tight real-estate and air-lift constraints preserve entry barriers. The combined share of the top five operators is estimated near 70%, indicating moderate concentration.
New Zealand Courier, Express, And Parcel (CEP) Industry Leaders
NZ Post
DHL Group
Aramex (Including Fastway, Ltd.)
FedEx
Freightways Group, Ltd. (Including New Zealand Couriers)
- *Disclaimer: Major Players sorted in no particular order

Recent Industry Developments
- December 2025: Freightways agreed to acquire VT Freight Express in Victoria, Australia, extending its trans-Tasman footprint.
- December 2025: Pharmac proposed DHL as the national vaccine logistics provider from February 2026, centralizing cold-chain distribution.
- November 2025: DHL opened the NZD 90 million (USD 51.6 million) Te Kapua healthcare hub in Auckland, adding 41 Geek+ robots and 12 000 controlled-temperature pallet slots.
- July 2025: Parcelair partner Airwork entered receivership, prompting Freightways to schedule two 737-800 freighter replacements for late 2026.


New Zealand Courier, Express, And Parcel (CEP) Market Report Scope
| Domestic |
| International |
| Express |
| Non-Express |
| Business-to-Business (B2B) |
| Business-to-Consumer (B2C) |
| Consumer-to-Consumer (C2C) |
| Heavy Weight Shipments |
| Light Weight Shipments |
| Medium Weight Shipments |
| Air |
| Road |
| Others |
| E-Commerce |
| Financial Services (BFSI) |
| Healthcare |
| Manufacturing |
| Primary Industry |
| Wholesale and Retail Trade (Offline) |
| Others |
| By Destination | Domestic |
| International | |
| By Speed of Delivery | Express |
| Non-Express | |
| By Model | Business-to-Business (B2B) |
| Business-to-Consumer (B2C) | |
| Consumer-to-Consumer (C2C) | |
| By Shipment Weight | Heavy Weight Shipments |
| Light Weight Shipments | |
| Medium Weight Shipments | |
| By Mode of Transport | Air |
| Road | |
| Others | |
| By End-User Industry | E-Commerce |
| Financial Services (BFSI) | |
| Healthcare | |
| Manufacturing | |
| Primary Industry | |
| Wholesale and Retail Trade (Offline) | |
| Others |


Key Questions Answered in the Report
How large is the New Zealand courier, express, and parcel market in 2026?
It is estimated at USD 1.64 billion in 2026, on track to reach USD 2.01 billion by 2031.
Which segment is growing fastest by destination?
International parcels, especially the trans-Tasman corridor, are forecast to expand at 4.75% CAGR between 2026-2031.
How dominant is road transport in New Zealand's parcel delivery?
Road networks handled 57.48% of parcel flows in 2025, remaining the primary mode despite air freight growth.
What is driving healthcare parcel growth?
New cold-chain hubs like DHL’s NZD 90 million (USD 51.6 million) Auckland site and Pharmac’s consolidated vaccine logistics contract are boosting temperature-controlled volumes.
How are capacity constraints in air freight being addressed?
Freightways is upgrading to 737-800 freighters, and DHL’s Christchurch Gateway provides direct airside access, offsetting Air New Zealand’s grounded jets.
Why are Auckland warehouse rents a concern?
Industrial vacancy stands near 1.6-2.2%, and outgoings rose 6.6% year-over-year to NZD 33 (USD 19.8) per m², squeezing last-mile delivery margins.
Page last updated on:


