North America Courier, Express, And Parcel (CEP) Market Size and Share
Market Overview
| Study Period | 2018 - 2031 |
|---|---|
| Forecast Data Period | 2026 - 2031 |
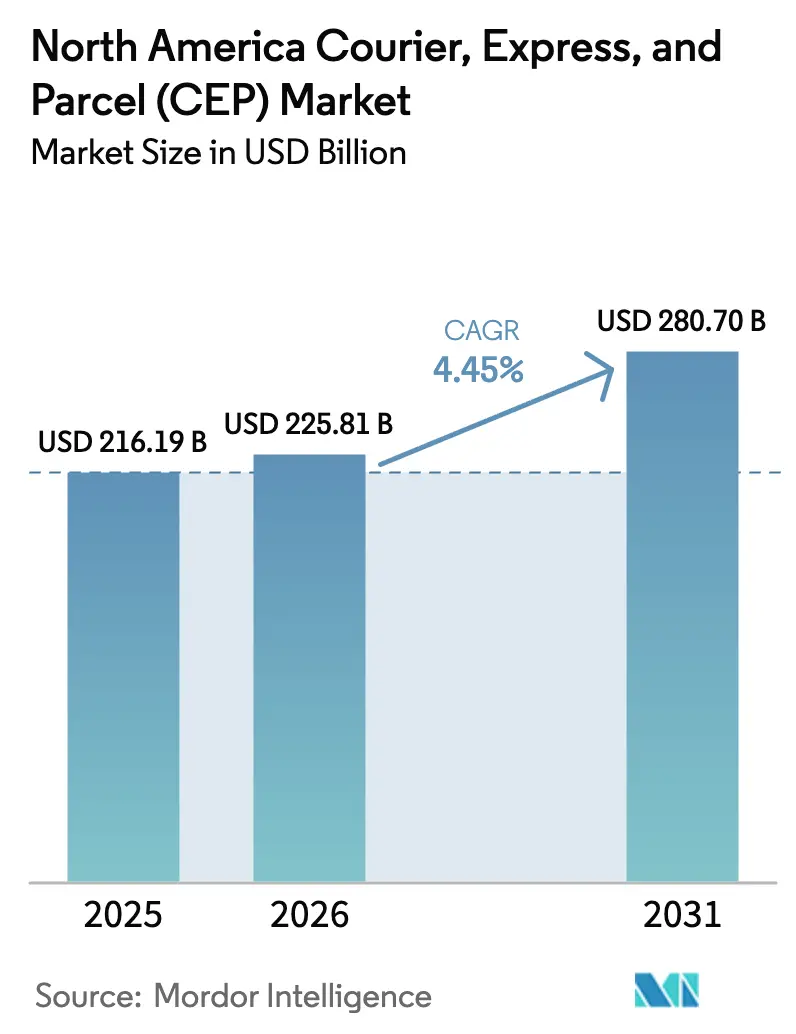
| Base Year Market Size (2025) | USD 216.19 Billion |
| Market Size (2026) | USD 225.81 Billion |
| Market Size (2031) | USD 280.7 Billion |
| Growth Rate (2026 - 2031) | 4.45% CAGR |
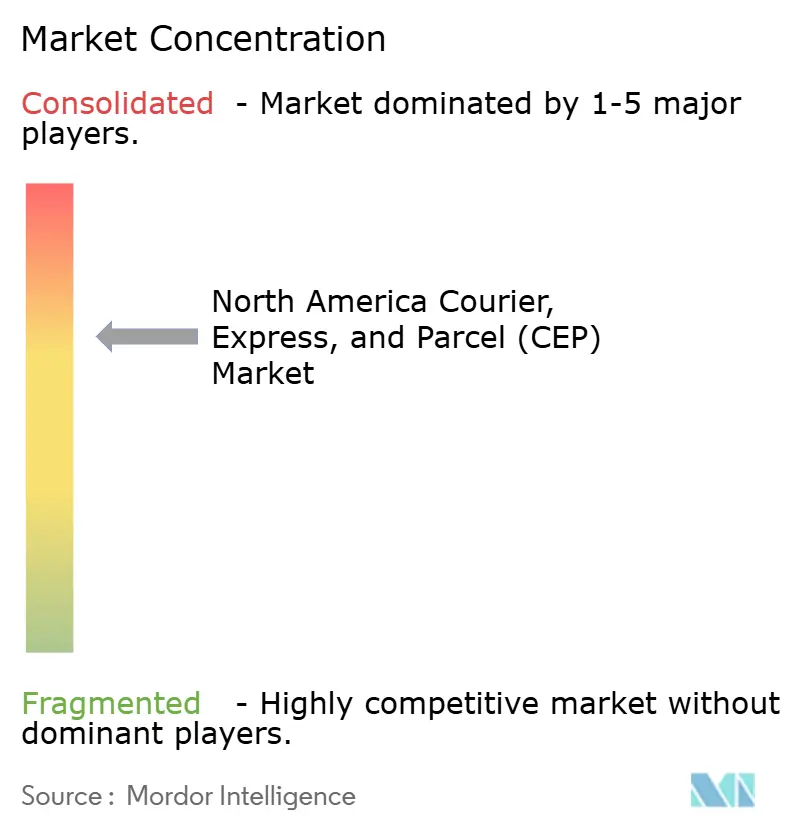
| Market Concentration | Medium |
Major Players *Disclaimer: Major Players sorted in no particular order Image © Mordor Intelligence. Reuse requires attribution under CC BY 4.0. | |
North America Courier, Express, And Parcel (CEP) Market Analysis by Mordor Intelligence
North America courier, express, and parcel market size in 2026 is estimated at USD 225.81 billion, growing from 2025 value of USD 216.19 billion with 2031 projections showing USD 280.7 billion, growing at 4.45% CAGR over 2026-2031. A revenue contraction in 2024 prompted major carriers to shift from volume pursuit toward margin protection through premium services, capacity rationalization, and disciplined pricing. Domestic demand plateaus as e-commerce penetration matures, yet express offerings grow quickly because same- and next-day fulfillment has become the baseline for large urban retailers. Nearshoring to Mexico, the rise of peer-to-peer marketplaces, and stringent healthcare cold-chain needs together generate new, higher-yield parcel flows across the region. Consolidation accelerates, most visibly through DSV’s EUR 14.3 billion (USD 15.78 billion) purchase of DB Schenker, signaling that network scale and integrated freight-parcel capabilities will dictate future leadership.
Key Report Takeaways
- By destination, domestic shipments held 74.62% of the North America courier, express, and parcel market share in 2025, while international parcels are forecast to rise at a 4.76% CAGR between 2026-2031.
- By speed of delivery, express services represented 23.18% of the revenue in 2025 and are on track to post a 5.1% CAGR between 2026-2031.
- By model, Business-to-Consumer (B2C) deliveries captured a 54.62% share in 2025; Consumer-to-Consumer (C2C) parcels are advancing at a 3.25% CAGR between 2026-2031.
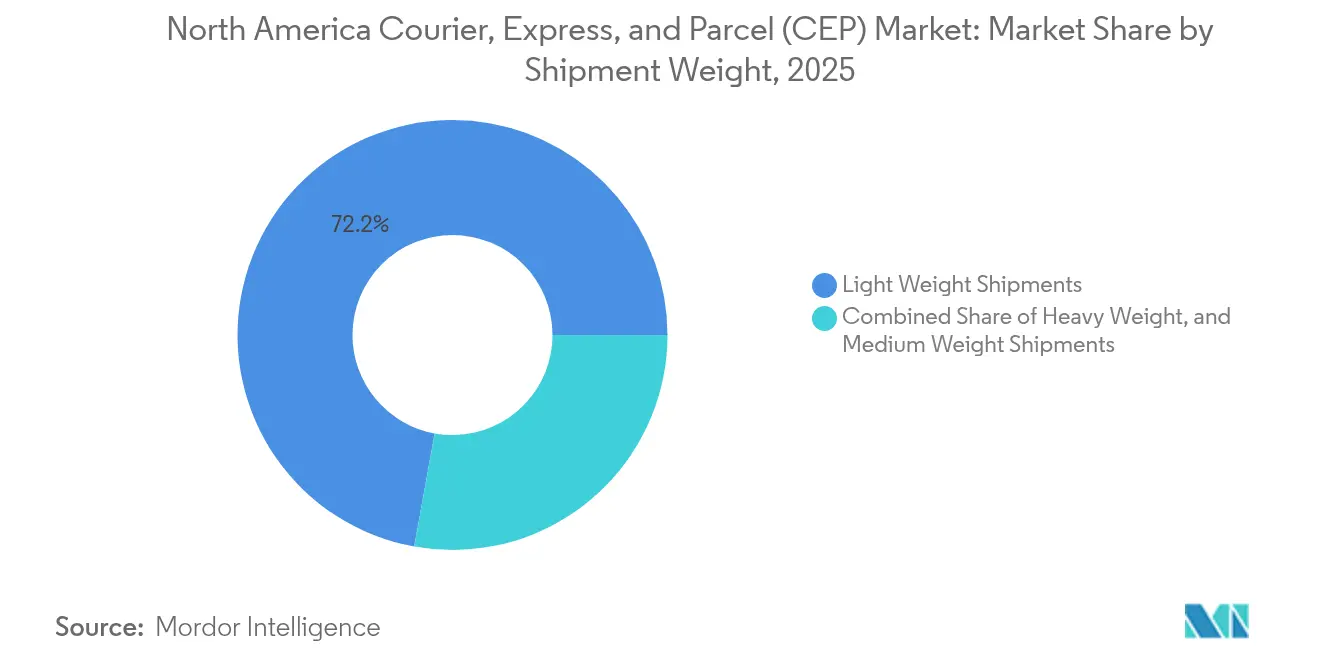
- By shipment weight, light weight parcels commanded 72.15% share in 2025, as medium weight boxes are projected to expand at a 3.29% CAGR between 2026-2031.
- By mode, road transport accounted for 50.74% of the North America courier, express, and parcel market size in 2025, while air freight is expected to grow at a 3.72% CAGR between 2026-2031.
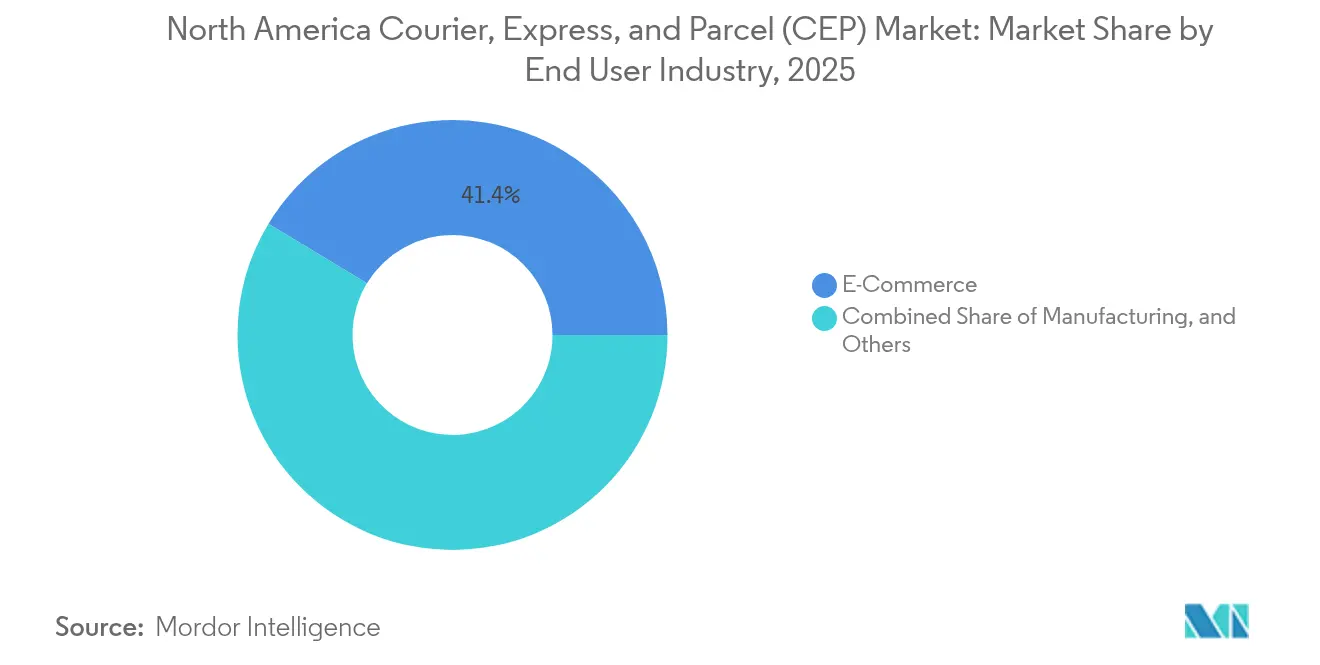
- By end user industry, e-commerce produced 41.35% of 2025 revenue, whereas healthcare leads growth with a 4.62% CAGR between 2026-2031.
- By country, the United States controlled 89.05% share in 2025; Mexico is set to deliver the fastest 6.12% CAGR between 2026-2031.
Note: Market size and forecast figures in this report are generated using Mordor Intelligence’s proprietary estimation framework, updated with the latest available data and insights as of 2026.
North America Courier, Express, And Parcel (CEP) Market Trends and Insights
Drivers Impact Analysis*
| Driver | (~) % Impact on CAGR Forecast | Geographic Relevance | Impact Timeline |
|---|---|---|---|
| E-commerce boom and omnichannel retailing | +1.8% | United States urban corridors | Medium term (2-4 years) |
| Same-/next-day delivery demand in dense urban zones | +1.2% | New York, Toronto, Mexico City | Short term (≤ 2 years) |
| Advanced last-mile technologies (drones, lockers, AVs) | +0.8% | U.S. pilot cities, select Canadian metros | Long term (≥ 4 years) |
| Healthcare cold-chain expansion for biologics | +0.9% | Region-wide, including rural reach | Medium term (2-4 years) |
| Nearshoring in Mexico spurring intra-NA parcel flows | +1.1% | U.S.–Mexico border, MX industrial hubs | Medium term (2-4 years) |
| Micro-fulfillment hubs raising parcel density | +0.7% | Major North American metros | Short term (≤ 2 years) |
| Source: Mordor Intelligence | |||


E-Commerce Boom and Omnichannel Retailing
Retail e-commerce growth may be slowing, yet omnichannel strategies multiply parcel touchpoints and diversify shipment origins. Amazon has expanded its inbound node count to 20 by 2025, underlining retailer self-logistics that compel traditional carriers to focus on specialized, higher-margin offerings. FedEx’s Network 2.0 consolidates express and ground sites, delivering USD 2 billion in annual cost savings and greater service agility. Urban micro-fulfillment improves parcel density, cutting last-mile unit cost even as shippers negotiate harder on rates. Environmental mandates such as California’s Advanced Clean Trucks Rule add fleet-upgrade urgency while creating an entry barrier for smaller rivals[1]“Advanced Clean Trucks Rule,” California Air Resources Board, arb.ca.gov.
Same-/Next-Day Delivery Demand in Dense Urban Zones
Premium service appetite remains resilient: 73% of metropolitan consumers are willing to pay more for same-day arrival. Carriers meet this by rolling out 40,000+ Access Point lockers and piloting autonomous robots on sidewalks. Zero-emission delivery districts in Santa Monica, Portland, and Vancouver obligate fleet electrification, prompting higher capital commitment but also driving routing innovation. Q4 2024 peak surcharges climbed to 15-20%, proving that customers tolerate price lifts for time-critical delivery[2]“UPS Master Agreement 2023,” International Brotherhood of Teamsters, teamster.org .
Advanced Last-Mile Technologies (Drones, Lockers, AVs)
UPS Flight Forward crossed 10,000 commercial drone sorties by 2024, initially for medical supplies and now expanding to retail parcels. Amazon Hub smart lockers surpass 50,000 placements, while FedEx OnSite’s 20,000 partner counters extend off-home collection convenience. Nuro and Waymo autonomous vans show promise yet face rule-making hurdles that postpone mass rollout. Canada’s regulatory sandbox gives early adopters a compliance head start and shapes cross-border standards.
Healthcare Cold-Chain Expansion for Biologics
Biologic drugs and personalized therapies require strict temperature integrity, raising parcel yields. UPS Healthcare spent over USD 500 million on cold-chain additions and paid USD 1.8 billion for Marken to bolster clinical trial logistics. DHL’s CRYOPDP buyout improves cryogenic reach for cell-gene therapies. FDA and Health Canada mandate validated lanes, making certification and IoT-based excursion alerts table stakes that insulate incumbents from new entrants.
Restraints Impact Analysis*
| Restraint | (~) % Impact on CAGR Forecast | Geographic Relevance | Impact Timeline |
|---|---|---|---|
| Fuel and labor cost inflation | -1.4% | Region-wide, strongest in rural zones | Short term (≤ 2 years) |
| Cross-border regulatory complexity | -0.8% | U.S.–MX border, U.S.–CA corridors | Medium term (2-4 years) |
| Urban congestion charges / zero-emission zones | -0.6% | Large North American cities | Medium term (2-4 years) |
| Retailer in-house delivery networks squeezing margins | -0.5% | U.S. urban markets, spreading to Canada | Short term (≤ 2 years) |
| Source: Mordor Intelligence | |||
Fuel and Labor Cost Inflation
Diesel volatility drove 12-18% fuel surcharge hikes during 2024. Driver turnover tops 90% on long-haul routes, forcing 8-12% annual wage gains and embedding cost pressure. The 2023 Teamsters-UPS pact alone adds USD 30 billion of labor expense across five years, outpacing carriers’ pricing power in commoditized lanes. Automation and dynamic routing help, but margins remain pinched near-term[3]“Zero Emission Delivery Zone Pilot,” City of Santa Monica, santamonica.gov.
Cross-Border Regulatory Complexity
USMCA reduces tariff ceilings yet leaves rules-of-origin paperwork that slows parcel clearance, particularly for e-commerce SMEs. Canada’s customs modernization demands fresh EDI platforms and staff re-training, raising compliance overhead. Divergent emission rules push carriers to juggle multiple truck specs by corridor, adding fleet complexity[4]“Mexico Logistics Guide,” International Trade Administration, trade.gov.
*Our forecasts treat driver/restraint impacts as directional, not additive. The impact forecasts reflect baseline growth, mix effects, and variable interactions.
Segment Analysis
By End User Industry: E-Commerce Leadership Challenged by Healthcare Acceleration
E-commerce generated 41.35% of 2025 parcel revenue but faces retailer self-delivery pressure. Healthcare’s 4.62% CAGR (2026-2031) positions it as the most lucrative vertical, supported by biologics, diagnostics, and at-home therapy kits that command yield premiums. The North America courier, express, and parcel market size for healthcare lanes benefits from strict chain-of-custody regulations that deter low-cost entrants.
IoT sensor deployment and GDP-compliant warehouses build competitive moats. Financial services and manufacturing transactions follow, leveraging secure courier services for documents and small-batch components that demand traceability more than speed.


By Destination: Cross-Border Growth Accelerates Despite Domestic Dominance
Domestic parcels retained 74.62% share of the North America courier, express, and parcel market in 2025, underscoring entrenched intra-regional commerce. International consignments, though smaller, are set to outpace at a 4.76% CAGR (2026-2031), buoyed by USMCA simplifications and Mexico’s factory boom. That momentum lifts the North America courier, express, and parcel market size for cross-border movements, reshaping network design toward southern corridors.
Capacity additions at border gateways, drone corridor experiments, and paperless customs pilots shorten cycle times, enticing exporters of higher-value electronics and apparel to choose parcel over LTL. Carriers capture yield premiums when managing duties and compliance on behalf of SMEs. Combined, these factors expand service portfolios beyond basic transport and anchor the next wave of growth in international lanes.
By Speed of Delivery: Express Services Command Premium Despite Volume Constraints
Non-express packages account for 76.82% of 2025 flow, yet express shipments draw disproportionate profit through premium surcharges. The segment’s 5.1% CAGR (2026-2031) reflects entrenched consumer tolerance for speed-based fees and B2B urgency for late-cutoff fulfillment. Time-definite services therefore safeguard margin as standard delivery commoditizes.
Peak-season express surcharges of 15-20% proved sticky even amid macro softness, signaling limited price elasticity. Micro-fulfillment, drone lanes, and evening sort waves lower cycle times, letting carriers promise before-end-of-day arrival without ballooning cost. The resulting balance of speed and efficiency sustains express expansion through 2030.
By Shipment Weight: Light Parcels Dominate While Medium Weight Segments Accelerate
Light parcels carried 72.15% share in 2025, mirroring electronics and apparel shipments optimized for home delivery vans. Medium-weight cartons are forecast to grow 3.29% CAGR (2026-2031) on furniture flat-packs and factory component kits linked to Mexico nearshoring. Dim-weight pricing reforms and automated sort arms now accommodate heavier boxes in parcel networks, enabling carriers to court categories once confined to freight carriers.
Packaging redesign trims wasted air, letting retailers squeeze rising SKUs into lighter tiers, while on-demand manufacturing still boosts mid-weight flows. These counterweights preserve light-parcel dominance but broaden mix diversity and revenue stability.
By Mode of Transport: Road Networks Dominate Despite Air Segment Acceleration
Ground remained king at 50.74% of the 2025 value, owing to dense interstate infrastructure and cost per mile. Air, however, records a quicker 3.72% CAGR (2026-2031) as cross-border urgency and healthcare mandates elevate speed-sensitive freight. Flexible cut-off agreements that combine air uplift with regional couriers unlock hybrid models that shave transit by a day at marginal cost uplift.
Sustainable aviation fuel trials and electric feeder aircraft projects promise emissions cuts that may shelter air options from future carbon levies. Ground fleets in turn move toward battery-electric vans that align with urban zero-emission rules, defending their lead in short-haul lanes.
By Model: B2C Dominance Faces C2C Disruption Through Social Commerce
Business-to-Consumer (B2C) parcels delivered 54.62% of 2025 revenue, a testament to two decades of online retail scale. Yet Consumer-to-Consumer (C2C) postings grow 3.25% CAGR (2026-2031), as digital resale and peer marketplaces gain social currency. The North America courier, express, and parcel market share for C2C will therefore rise incrementally through 2030.
Platform-integrated shipping labels, simplified duty thresholds, and doorstep pickup options lower friction for casual sellers. Carriers develop returns, authentication, and value-protection add-ons to capture premium fees in this nascent but rising flow stream.
Geography Analysis
The United States underpins the North America courier, express, and parcel market with 89.05% of 2025 revenue, powered by dense metropolitan clusters that crave same-day service and sophisticated returns management. Urban zero-emission mandates encourage electric van adoption, influencing capex allocation and routing software upgrades. Meanwhile, customs reforms and drone sandboxes position Canada as a test bed for automated cross-border lanes, creating a spill-over effect on U.S. regulatory roadmaps.
Mexico provides the region’s growth spark with an expected 6.12% CAGR between 2026-2031. USD 36.1 billion of 2023 FDI seeded new automotive, electronics, and textile exports, each spawning high-frequency parcels traveling northbound and intra-Mexico. Peso depreciation increases U.S. appetite for Mexican goods sold via online storefronts, amplifying C2C and SME flows. Dedicated sort halls on both sides of the border trim clearance time and improve reliability, key for fashion and electronics sellers operating thin inventory buffers.
Smaller Central American economies hitch onto USMCA-led corridors through improved road links and digital customs, albeit from a low base. Their role as overflow production and nearshore service centers will gradually widen the geographic footprint of the North America courier, express, and parcel market, yet near-term volumes remain concentrated in the three core nations.
Competitive Landscape
Market concentration is moderately consolidated. UPS, FedEx, and USPS remain foundational, yet 2024’s revenue dip exposed sensitivity to cyclical headwinds. Strategic consolidation is reshaping the field: DSV’s takeover of DB Schenker forms a freight-parcel giant. Such scale amplifies bargaining power with aircraft lessors, vehicle OEMs, and technology vendors, fortifying cost leadership.
Technology investments dominate board agendas. FedEx allocates USD 2 billion to Network 2.0 for integrated sorting, while UPS channels over USD 500 million into healthcare-grade facilities. Both firms pilot autonomous ground vehicles and route-level AI to squeeze operational seconds. Mid-tier operator TFI International pursues niche heavy-haul assets to sidestep head-to-head parcel battles, and Canada Post experiments with carbon-neutral last-mile offerings to differentiate on sustainability.
Retailer logistics self-builds, including Amazon Logistics and Walmart GoLocal, intensify rivalry by cherry-picking profitable urban lanes. Incumbent carriers defend share through value-added services: installation, cash-on-delivery in Mexico, and secure high-value shipment escort in financial hubs. The field’s competitive dynamic is thus a blend of horizontal consolidation and vertical specialization.
North America Courier, Express, And Parcel (CEP) Industry Leaders
DHL Group
Fedex
United Parcel Service of America, Inc. (UPS)
TFI International Inc.
United States Postal Service (USPS)
- *Disclaimer: Major Players sorted in no particular order

Recent Industry Developments
- February 2025: FedEx introduced Network 2.0, a USD 2 billion program to merge express and ground operations for cost and service gains.
- January 2025: DHL closed its USD 750 million purchase of CRYOPDP, enhancing ultra-low-temperature capacity for biopharma customers.
- November 2024: TFI International finalized its USD 800 million acquisition of Daseke’s heavy-haul units, broadening specialized transport reach.
- August 2024: J.B. Hunt began a 5,000-container intermodal expansion, adding new rail partnerships across North America.


North America Courier, Express, And Parcel (CEP) Market Report Scope
Domestic, International are covered as segments by Destination. Express, Non-Express are covered as segments by Speed Of Delivery. Business-to-Business (B2B), Business-to-Consumer (B2C), Consumer-to-Consumer (C2C) are covered as segments by Model. Heavy Weight Shipments, Light Weight Shipments, Medium Weight Shipments are covered as segments by Shipment Weight. Air, Road, Others are covered as segments by Mode Of Transport. E-Commerce, Financial Services (BFSI), Healthcare, Manufacturing, Primary Industry, Wholesale and Retail Trade (Offline), Others are covered as segments by End User Industry. Canada, Mexico, United States are covered as segments by Country.| Domestic |
| International |
| Express |
| Non-Express |
| Business-to-Business (B2B) |
| Business-to-Consumer (B2C) |
| Consumer-to-Consumer (C2C) |
| Heavy Weight Shipments |
| Light Weight Shipments |
| Medium Weight Shipments |
| Air |
| Road |
| Others |
| E-Commerce |
| Financial Services (BFSI) |
| Healthcare |
| Manufacturing |
| Primary Industry |
| Wholesale and Retail Trade (Offline) |
| Others |
| Canada |
| Mexico |
| United States |
| Rest of North America |
| Destination | Domestic |
| International | |
| Speed of Delivery | Express |
| Non-Express | |
| Model | Business-to-Business (B2B) |
| Business-to-Consumer (B2C) | |
| Consumer-to-Consumer (C2C) | |
| Shipment Weight | Heavy Weight Shipments |
| Light Weight Shipments | |
| Medium Weight Shipments | |
| Mode of Transport | Air |
| Road | |
| Others | |
| End User Industry | E-Commerce |
| Financial Services (BFSI) | |
| Healthcare | |
| Manufacturing | |
| Primary Industry | |
| Wholesale and Retail Trade (Offline) | |
| Others | |
| Country | Canada |
| Mexico | |
| United States | |
| Rest of North America |


Market Definition
- Courier, Express, and Parcel - The Courier, Express, and Parcel services, often called as CEP Market, refers to the logistics and postal service providers which specialize in moving small goods (parcels/packages). It captures the overall market size (USD) and market volume (number of parcels) of (1) the shipments/parcels/packages which are under 70kgs/ 154lbs weight, (2) Business Customer packages viz. Business-to-Business (B2B) & Business-to-Consumer (B2C) as well as private customer packages (C2C), (3) non-express parcel delivery services (Standard and Deferred) as well as express parcel delivery services (Day-Definite-Express and Time-Definite-Express), (4) domestic as well as international shipments.
- Demographics - To analyse total addressable market demand, population growth & forecasts have been studied and presented in this industry trend. It represents population distribution across categories like gender (male/female), development area (urban/rural), major cities among other key parameters like population density and final consumption expenditure (growth and share % of GDP). This data has been used for assessing the fluctations in demand & consumption expenditure, and the major hotspots (cities) of potential demand.
- Domestic Courier Market - Domestic Courier Market refers to the CEP shipments wherein the origin and destination is within the boundary of the geography studied (country or region as per the scope of report). It captures the market size (USD) and market volume (number of parcels) of (1) the shipments/parcels/packages which are under 70kgs/ 154lbs weight, including light weight shipments, medium weight shipments and heavy weight shipments (2) Business Customer packages viz. Business-to-Business (B2B) & Business-to-Consumer (B2C) as well as private customer packages (C2C), (3) non-express parcel delivery services (Standard and Deferred) as well as express parcel delivery services (Day-Definite-Express and Time-Definite-Express).
- E-Commerce - This end user industry segment captures the external (outsourced) logistics expenditure incurred by the e-tailers, through online sales channel, on Courier, Express, and Parcel (CEP) services. The scope includes (i) the supply chain of a company's online customer orders being fulfilled, (ii) the process of getting a product from the point of manufacturing to the point at which it is delivered to consumers. It involves managing inventory (deferred as well as time critical), shipping, and distribution.
- Export Trends and Import Trends - Overall logistics performance of an economy is positively and significantly (statistically) correlated to its trade performance (exports and imports). Hence, in this industry trend, total value of trade, major commodities/ commodity groups and the major trade partners, for the studied geography (country or region as per the scope of report) have been analysed alongside the impact of major trade/logistics infrastructure investments & regulatory environment.
- Financial Services (BFSI) - This end user industry segment captures the external (outsourced) logistics expenditure incurred by the BFSI players, on Courier, Express, and Parcel (CEP) services. CEP is important to the financial services industry in shipping of confidential documents and files. The establishments in this sector are engaged in (i) financial transactions (that is, transactions involving the creation, liquidation, or change in ownership of financial assets) or in facilitating financial transactions, (ii) financial intermediation, (iii) the pooling of risk by underwriting annuities and insurance, (iv) providing specialized services that facilitate or support financial intermediation, insurance and employee benefit programs, and (v) monetary control - the monetary authorities.
- Fuel Price - Fuel price spikes can cause delays and diruption for logistics service providers (LSPs), while drops in the same can result in higher short-term profitability and increased market rivalry to offer consumers with the best deals. Hence, the fuel price variations have been studied over the review period and presented along with the causes as well as market impacts.
- GDP Distribution by Economic Activity - Nominal Gross Domestic Product and distribution of the same, across major economic sectors in the geography studied (country or region as per scope of the report) have been studied and presented in this industry trend. As GDP is positively related to the profitability and growth of logistics industry, this data has been used in adjunction to the input-output tables/ supply-use tables for analyzing the potential major contributing sectors towards the logistics demand.
- GDP Growth by Economic Activity - Growth of Nominal Gross Domestic Product across major economic sectors, for the geography studied (country or region as per scope of the report) have been presented in this industry trend. This data has been utilized for assessing the growth of logistics demand from all the market end users (economic sectors considered here).
- Healthcare - This end user industry segment captures the external (outsourced) logistics expenditure incurred by the Healthcare players (Hospitals, clinics, mrdical centres) , on Courier, Express, and Parcel (CEP) services. The scope includes CEP services involved in the defrerred as well time critical movement of medical goods & supplies (surgical supplies and instruments, including gloves, masks, syringes, equipment). The establishments in this sector (i) include the ones providing medical care exclusively (ii) deliver services by trained professionals (iii) involve processes, including labor inputs of health practitioners with the requisite expertise (iv) are defined based on the educational degree held by the practitioners included in the industry.
- Inflation - Variations in both Wholesale Price Inflation (YoY change in producer price index) and Consumer Price Inflation have been presented in this industry trend. This data has been used to assess the inflationary environment as it plays a vital role in smooth functioning of the supply chain, directly impacting the logistics operational cost components e.g., pricing of tyres, driver wages & benefits, energy/fuel prices, maintenace costs, toll charges, warehousing rents, custom brokerage, forwarding rates, courier rates etc. hence impacting the overall freight and logistics market.
- Infrastructure - As infrastructure plays a vital role in an economy's logistics performance, variables like length of roads, distribution of road length by surface category (paved v/s unpaved), distribution of road length by road classification (expressways v/s highways v/s other roads), rail length, volume of containers handled by major ports and tonnage handled by major airports have been analysed and presented in this industry trend.
- International Express Service Market - International Express Service Market refers to the CEP shipments wherein the origin or destination is not within the boundary of the geography studied (country or region as per the scope of report). It captures the market size (USD) and market volume (number of parcels) of (1) the shipments/parcels/packages which are under 70kgs/ 154lbs weight, including light weight shipments, medium weight shipments and heavy weight shipments (ii) Inter-Region as well as Intra-Region Shipments
- Key Industry Trends - The report section named "Key Industry Trends" include all the key variables/parameters studied to better analyze the market size estimates and forecasts. All the trends have been presented in the form of data points (time series or latest available data points) along with analysis of the paramter in the form of concise market relevant commentary, for the geography studied (country or region as per the scope of report).
- Key Strategic Moves - The action taken by a company to differentiate from its competitor or used as a general strategy is referred to as a key strategic move (KSM). This includes (1) Agreements (2) Expansions (3) Financial Restructuring (4) Mergers and Acquisitions (5) Partnerships, and (6) Product Innovations. Key players (Logistics Service Providers, LSPs) in the market have been shortlisted, their KSM have been studied and presented in this section.
- Logistics Performance - Logistics Performance and Logistics Costs are the backbone of trade, and influences trade costs, making countries compete globally. Logistics performance is influenced by market wide adopted supply chain management strategies, government services, investments & policies, fuel/ energy costs, inflationary environment etc. Hence, in this industry trend, the logistics performance of the geography studied (country/ region as per the scope of report) has been analysed and presented over the review period.
- Manufacturing - This end user industry segment captures the external (outsourced) logistics expenditure incurred by the Manufacturing industry (including Hi-Tech/Technology) players, on Courier, Express, and Parcel (CEP) services. The end user players considered are the establishments primarily engaged in the chemical, mechanical or physical transformation of materials or substances into new products. Logistics Service Providers (LSPs) play a crucial role in maintaining a smooth flow of raw materials across the supply chain, enabling timely delivery of finished goods to distributors or end customers and storing & supplying the raw materials to clients for just-in-time manufacturing.
- Other End Users - Other end user segment captures the external (outsourced) logistics expenditure incurred by the construction, real estate, educational services, and professional services (administrative, waste management, legal, architectural, engineering, design, consulting, scientific R&D), on Courier, Express, and Parcel (CEP) services. Logistics Service Providers (LSPs) plays a crucial role in the reliable movement of time critical supplies and documents to/from these industries such as transporting any equipment or resources required, shipping confidential documents and files.
- Primary Industry - This end user industry segment captures the external (outsourced) logistics expenditure incurred by the AFF (Agriculture, Fishing, and Forestry) and Extraction indsutry (Oil &Gas, Quarrying and Mining) players, on Courier, Express, and Parcel (CEP) services. The end user players considered are the establishments (i) primarily engaged in growing crops, raising animals, harvesting timber, harvesting fish & other animals from their natural habitats and providing related support activities; (ii) that extract naturally occurring mineral solids, such as coal and ores; liquid minerals, such as crude petroleum; and gases, such as natural gas. Herein, Logistics Service Providers (LSPs) (i) play a crucial role in acquisition, storage, handling, transportation, and distribution activities for the optimal & continuous flow of inputs (seeds, pesticides, fertilizers, equipment, and water) from manufacturers or suppliers to the producers and smooth flow of output (produce, agro-goods) to distributors/ consumers; (ii) cover entire phases from upstream to downstream and play a crucial role in the transportation of machinery, drilling equipments, extracted minerals, crude oil & natural gas and refined/ processed products from one place to another. This includes both termperature controlled and non-temperature controlled logistics, as and when required according to the shelf life of goods being transported or stored.
- Producer Price Inflation - It indicates inflation from viewpoint of the producers viz. the average selling price received for their output over a period of time. Annual change (YoY) of producer price index is reported as wholesale price inflation in the "Inflation" industry trend. As WPI captures dynamic price movements in most comprehensive way, it is widely used by governments, banks, industry, business circles and is deemed important in formulation of trade, fiscal and other economic policies. The data has been used in adjunction to consumer price inflation for better understanding the inflationary environment.
- Segmental Revenue - Segmental Revenue has been triangulated or computed and presented for all the major players in the market. It refers to the courier, express, and parcel (CEP) market specific revenue earned by the company, over the base year of study, in the geography studied (country or region as per the scope of report). It is computed through the study and analysis of major parameters like financials, service portfolio, employee strength, fleet size, investments, number of countries present in, major economies of concern, etc. that have been reported by the company in its annual reports, webpage. For companies having scarce financial disclosures, paid databases like D&B Hoovers, Dow Jones Factiva have been resorted to and verified through industry/expert interactions.
- Transport and Storage Sector GDP - Value and growth of Transport and Storage Sector GDP has a direct relation to the freight and logistics market size. Hence, this variable has been studied and presented over the review period, in value terms (USD) and as share % of total GDP, in this industry trend. The data has been supported by concise and relevant commentary around the investments, developments, and current market scenario.
- Trends in E-Commerce Industry - Enhanced internet connectivity and boom in smartphone penetration, coupled with increasing disposable incomes, has led to a phenomenal growth in the e-commerce market globally. Online shoppers require fast and efficient delivery of their orders leading to an increase in the demand for logistics services especially e-commerce fulfilment services. Hence, the Gross Merchandise Value (GMV), historial and projected growth, breakup of major commodity groups in e-commerce industry for the studied geography (country or region as per scope of the report) have been analysed and presented in this industry trend.
- Trends in Manufacturing Industry - Manufacturing industry involves the transformation of raw materials into finished products, while logistics industry ensures the efficient flow of raw materials to the factory, and the transport of manufactured products to the distributors & consumers. Demand-Supply of both industries are highly cross-linked and critical for a seamless supply chain. Hence, the Gross Value Added (GVA), breakup of GVA into major manufacturing sectors, and growth of manufacturing industry over the review period have been analysed and presented, in this industry trend.
- Wholesale and Retail Trade (Offline) - This end user industry segment captures the external (outsourced) logistics expenditure incurred by the wholesalers and retailers, through offline sales channel, on Courier, Express, and Parcel (CEP) services. The end user players considered are the establishments primarily engaged in wholesaling or retailing merchandise, generally without transformation, and rendering services incidental to the sale of merchandise. Logistics Service Providers (LSPs) plays a crucial role in the reliable movement of supplies to and finished products from production houses to the distributors and finally to the end customer covering activites like material sourcing, transportation, order fulfillment, warehousing & storage, demand forecasting, inventory management etc.
| Keyword | Definition |
|---|---|
| Axle Load | The axle load refers to the total load (weight) bearing on the roadway through wheels connected to a given axle. Across the globe, there are systems in place to ensure axle load monitoring, wherein surpassing the defined limits set by the concerned regulatory authority can lead to penalty/fine. For transportation of goods via road this can be an important determinant of costs as knowledge about the axle load limits can be used to (i) load the vehicle optimally for maximizing profits (ii) avoid exceeding the same and hence the probable fines associated (iii) avoid wear and tear of the vehicle (iv) avoid damage to pavement resulting in noticeable public maintenance and repair costs (v) achieve better turnaround time. |
| Back Haul | Backhaul is the return movement of a transport vehicle from its original destination to its original point of departure, and can include full, partial, or empty truck loads (all or part of the way) depending on the visibility of the local freight ecosystem. In this regard, transportation of empty containers to the point of origin, known as deadheading is also a significant factor, considering the supply/container shortages across the geographies, resulting in cost escalation and under optimized profit potential attainment. Generally, the carriers offer discounts on the backhaul, to secure freight for the trip. |
| Bill of Lading (BOL) | A bill of lading is a legal contract document issued by a carrier to a shipper to acknowledge reception of their cargo, and is evidence for the contract of carriage between the two parties. Broadly it details the (i) type, quantity, and other specifications of the goods being carried (ii) destination, and terms & conditions of the shipment (iii) carrier and drivers with all the necessary information to process the shipment, which can be used for insurance and customs clearance purposes (iv) assurance that the consignment is damage-free and ready to be shipped to the consignee. In this regard, a house bill of lading (HBL) is a document issued by a freight forwarder or a non-vessel operating common carrier (NVOCC) to acknowledge receipt of items for shipment (to a shipper). If shipments from several shippers are involved a master bill of lading (MBL) might be involved which is a consolidated version of the same for all the shipments being taken care of by the carrier (to a common destination) and might be issued by the carrier to the freight forwarder or the shipper (depending on who books the transport). |
| Bunkering | Bunkering is the process of supplying fuel to power the propulsion system of a ship. It includes the logistics of loading and distributing the fuel among available shipboard tanks. In this regard, (i) Bunker fuel is technically any type of fuel oil used aboard ships. It gets its name from the containers on ships and in ports that it is stored in; in the days of steam they were coal bunkers but now they are bunker-fuel tanks, (ii) Bunker refers to the spaces (Tank) on board a vessel to store fuel, (iii) Bunker trader refers to a person dealing in trade of bunker (fuel), (iv) Bunker call is made when a cargo ship anchors or berths in a port to take on bunker oil or supplies, (v) Bunkering service is the supply of a requested quality and quantity of bunkers to a ship. Bunkering is signficant from point of view of freight rates applicable to the shipper as Bunker Contribution (BUC)/ Fuel Adjustment Factor (FAF)/ Bunker Adjustment Factor (BAF) are applied by shipping lines to offset the effect of fluctuations in the cost of bunkers. |
| Cabotage | Transport by a vehicle registered in a country, performed on the national territory of another country. Cabotage law may restrict domestic cargo traffic to be carried in its own nationally registered, and sometimes built and crewed vehicles, though regulations vary across industries/commodity groups/countries and sometimes specify maximum allowable percentage of cabotage that can be serviced by foreign registered fleet. |
| C-commerce | Collaborative commerce (also known as C-commerce), (i) describes electronically enabled business interactions among an enterprise’s internal personnel, business partners and customers throughout a trading community (industry, industry segment, supply chain or supply chain segment); (ii) is the optimization of supply and distribution channels to capitalize on the global economy by using new technology efficiently. Advantages of C-commerce, to detail few include (i) maximization of organization's efficiency and profitability (ii) technology integration with physical channels to allow companies to work together (iii) increased information exchange such as inventory and product specifications, using the web as an intermediary (iv) increased competitiveness by reaching a broader audience. Examples of C-commerce, also known as peer-to-peer commerce, include (i) companies that allow consumers to rent things from each other, or marketplaces, such as Meta (formerly Facebook) Marketplace, that allow the sale of used goods; (ii) DoorDash teamed up with many national brands, such as McDonald’s and Chipotle, to offer fast food delivery, building their business model on c-commerce. They have since expanded their delivery service from restaurants to retailers and even offer 'fleets' of drivers to businesses. |
| Courier | A business/company that delivers packages/parcels/shipments (upto 70 kgs) including quick door to door pickup and delivery service for goods or documents, domestically or internationally, on a commercial contract basis. Example, DHL Group, FedEx, United Parcel Service of America, Inc., USPS, International Distributions Services, J&T Express, SF Express among several others |
| Cross docking | Cross docking is a practice in logistics management that includes unloading incoming delivery vehicles and loading the materials directly into outbound delivery vehicles, omitting traditional warehouse logistical practices and saving time and money. It requires close synchronization of both inbound and outbound movements. It is highly significant in reduction of costs pertaining to warehousing & storage (and the associated Value Added Services). |
| Cross Trade | International transport between two different countries performed by a vehicle registered in a third country. A third country is a country other than the country of loading/embarkation and the country of unloading/disembarkation. Cross Trade law may restrict international cargo traffic to be carried by respective country's registered vehicles, and sometimes built and crewed vehicles, though regulations vary across industries/commodity groups/countries and sometimes specify maximum allowable percentage of cross trade that can be serviced by foreign registered fleet. |
| Customs Clearance | The process of declaring and clearing cargoes through customs. It includes the procedures involved in getting cargo released by Customs through designated formalities such as presenting import license/permit, payment of import duties and other required documentations by the nature of the cargo. In this regard, a customs broker is a person or company licensed by the respective department of the country to act on behalf of freight importers and exporters. |
| Dangerous Goods | Dangerous goods (or hazardous materials or HAZMAT) include flammable liquids/solids, gases (compressed, liquified, dissolved under pressure), corrosives, oxidising substances, explosive substances and articles, substances which on contact with water emit flammable gasses, organic peroxides, toxic substances, infectious substances, radioactive materials, miscellaneous dangerous goods and articles. |
| First mile Delivery | First mile delivery refers to the (i) first stage of the freight/shipment/cargo/courier transportation (ii) the transportation of goods from a merchant’s premises or warehouse to the next fulfillment centre/warehouse/hub from where the goods are forwarded (iii) shipping goods from local distribution centers to stores (For retailers) (iv) transportation of finished goods from a plant or a factory to a distribution center (For manufacturers), (v) pick up of goods from the end-customer’s home or store followed by movement to a warehouse or storage location (movers and packers), (vi) process where goods are picked up from a retailer and then transferred to third-party logistics providers or courier service providers to be delivered to the end-consumer (e-commerce). Once the package reaches the next warehouse or the courier’s hub, it is then sorted and transported further until it reaches the customer’s doorstep. Example, if one chooses UPS as a courier, first-mile delivery will be the product being delivered from manufacturer's/retailer's warehouse to the UPS’s warehouse/ fulfilment centre. |
| Last Mile Delivery | Last mile delivery refers to the very last step of the delivery process when a parcel is moved from a transportation hub (warehouse or a distribution center or fulfillment centre) to its final destination, which usually is a personal residence/retail store/ business, or parcel locker. It accounts for around half of the total cost involved in entire process of first mile, middle mile, and last mile delivery, though it can vary shipment to shipment, based on commodity, business model and similar factors. |
| Milkrun | A Milk Run is a delivery method used to transport mixed loads from various suppliers to one customer, using lean management principles applied to logistics. Instead of each supplier sending a truck every week to meet the needs of one customer, one truck (or vehicle) visits the suppliers to pick up the loads for that customer. This method of transport got its name from the dairy industry practice, where one tanker used to collect milk from several dairy farms for delivery to a milk processing company. A milk run can be a more efficient way to handle logistics but require proper planning. If the route involves products from different companies, there is need for an agreement about cost-sharing and other aspects of the cooperative delivery arrangement. Once the group settles these issues, this delivery method can save time and money for everyone by pooling operation costs and resources. |
| Multi country consolidation | Multi-Country Consolidation (MCC) is a cost-effective solution that consolidates one's cargo from different countries of origin to build Full Container Loads (FCL). MCC is most suitable for companies that import light volumes of goods from multiple countries but want to take advantage of the more economic FCL freight rates. Apart from costing some of the other advantages include (i) flexibility to choose suppliers from a wider range of origin countries without worrying about the logistics to final destination from each origin, (ii) ability to pick the most suitable suppliers from many different countries for one's business operations. The increase in one's sourcing options by MCC provides the kind of flexibility needed in competitive global markets. |
| Q-commerce | Q-commerce, also referred to as quick commerce, is a type of e-commerce where emphasis is on quick deliveries, typically in less than an hour. The companies providing Q-Commerce services might have vertically intergrated model or might be using third party delivery platforms (outsourced logistics). It has advantages like (i) competitve USP, (ii) potential to earn greater profit margins, (iii) better customer experience, (iv) guaranteed availability of products, (v) traceability, and (vi) scaleability. |
| ReverseLogistics | Reverse logistics is a type of supply chain management that moves goods from customers back to the sellers or manufacturers and may involve ciruclar economy principles (3Rs) viz. recycling, reuse (repurposing, reselling), reducing or repairing. In this regard, reverse commerce (or Recommerce) is the selling of previously owned items through physical or online marketplaces/distribution channels to buyers who reuse, recycle or resell them. |


Research Methodology
Mordor Intelligence follows a four-step methodology in all our reports.
- Step-1: Identify Key Variables: In order to build a robust forecasting methodology, the variables and factors identified in Step-1 are tested against available historical market numbers. Through an iterative process, the variables required for market forecast are set and the model is built on the basis of these variables.
- Step-2: Build a Market Model: Market-size estimations for the forecast years are in nominal terms. Inflation is considered to be a part of the pricing, and the average selling price (ASP) is varying throughout the forecast period for each country
- Step-3: Validate and Finalize: In this important step, all market numbers, variables and analyst calls are validated through an extensive network of primary research experts from the market studied. The respondents are selected across levels and functions to generate a holistic picture of the market studied.
- Step-4: Research Outputs: Syndicated Reports, Custom Consulting Assignments, Databases & Subscription Platforms


