Market Overview
| Study Period | 2018 - 2031 |
|---|---|
| Forecast Data Period | 2026 - 2031 |
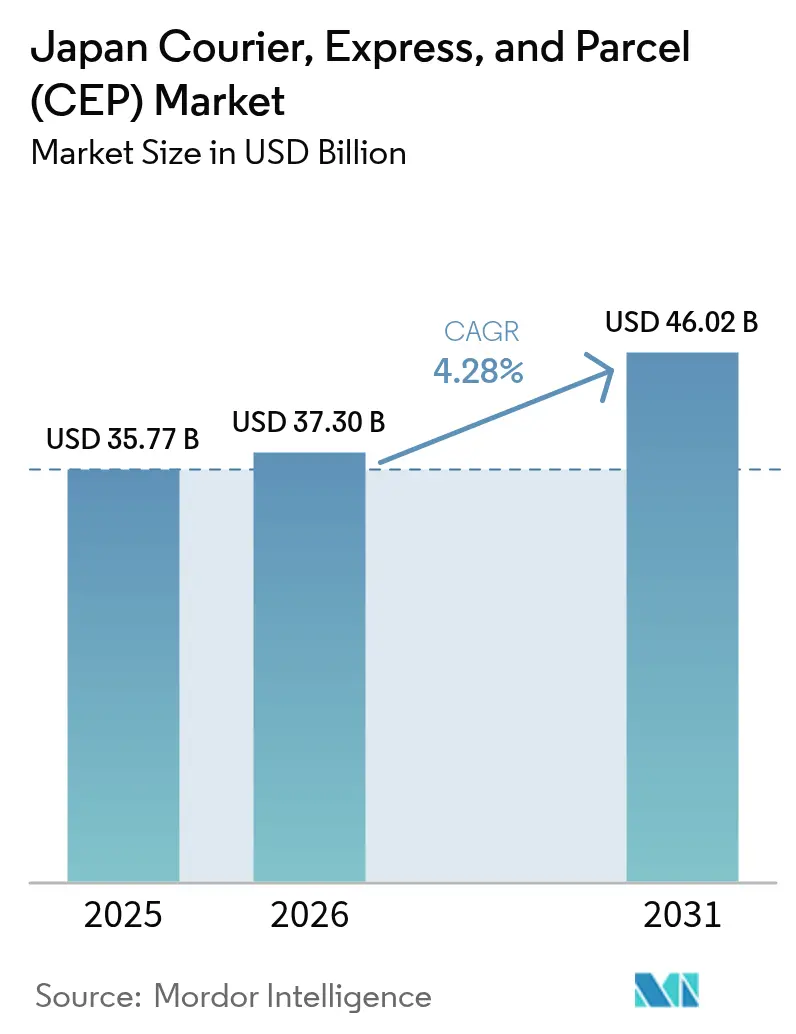
| Base Year Market Size (2025) | USD 35.77 Billion |
| Market Size (2026) | USD 37.3 Billion |
| Market Size (2031) | USD 46.02 Billion |
| Growth Rate (2026 - 2031) | 4.28% CAGR |
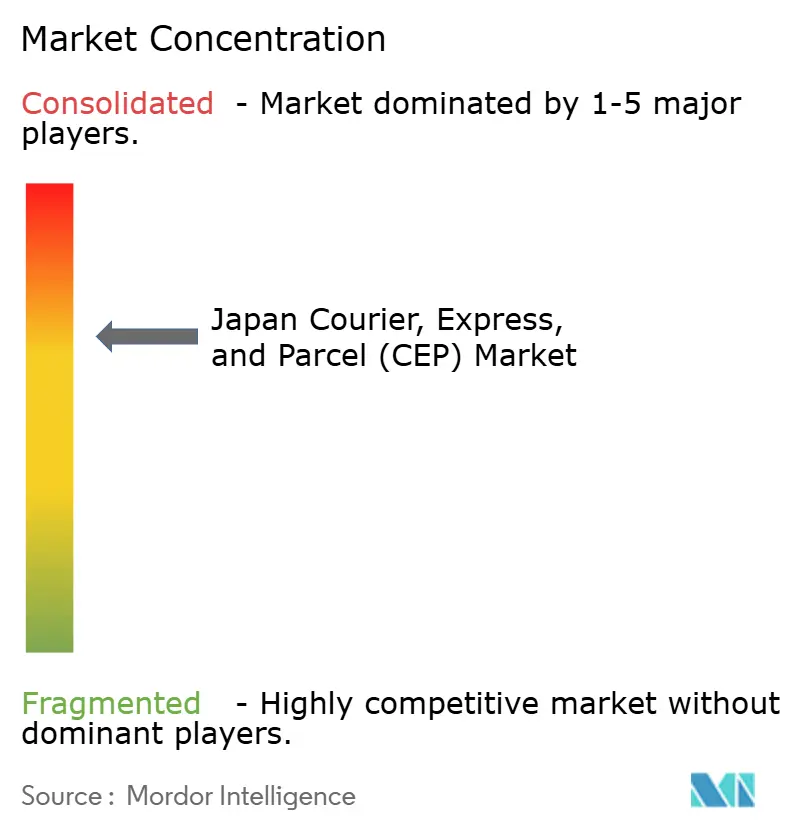
| Market Concentration | Medium |
Major Players *Disclaimer: Major Players sorted in no particular order Image © Mordor Intelligence. Reuse requires attribution under CC BY 4.0. | |
Japan Courier, Express, And Parcel (CEP) Market Analysis by Mordor Intelligence
The Japan courier, express, and parcel market size was valued at USD 35.77 billion in 2025 and estimated to grow from USD 37.3 billion in 2026 to reach USD 46.02 billion by 2031, at a CAGR of 4.28% during the forecast period (2026-2031). This forecast reflects how a mature logistics network is adapting to the 2024 overtime cap on drivers, a surge in digital commerce, and demographic pressures linked to an aging population. E-commerce growth of 9.23% year over year continues to lift small-parcel volumes, compelling carriers to modernize hubs and last-mile operations. Labor scarcity is accelerating automation, while government incentives for low-emission fleets are shaping capital allocation. International parcel flows are rising as cross-border platforms court Japanese buyers, adding complexity around customs and compliance. Together, these forces are steering service design, pricing, and investment priorities across the Japan courier, express, and parcel market.
Key Report Takeaways
- By destination, domestic shipments accounted for 63.55% of the Japan courier, express, and parcel market share in 2025; international services are forecast to expand at a 4.41% CAGR between 2026-2031.
- By speed of delivery, non-express modes held 74.10% share of the Japan courier, express, and parcel market size in 2025, while express services are advancing at a 4.86% CAGR between 2026-2031.
- By model, business-to-consumer (B2C) captured 51.25% revenue share in 2025; consumer-to-consumer (C2C) is set to rise at a 3.42% CAGR between 2026-2031.
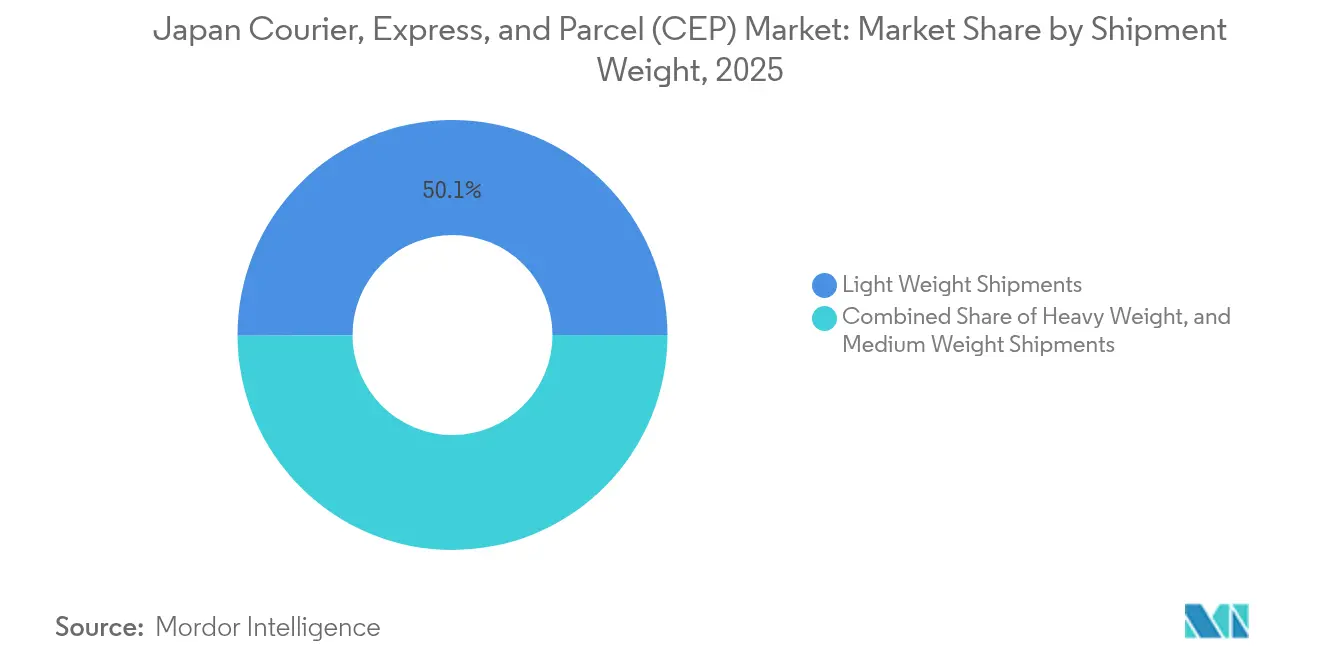
- By shipment weight, light parcels commanded 50.05% share of the Japan courier, express, and parcel market size in 2025 and heavy parcels are growing at a 3.92% CAGR between 2026-2031.
- By mode of transport, road transport led with 50.62% share in 2025; air transport is projected to grow at a 3.61% CAGR between 2026-2031.
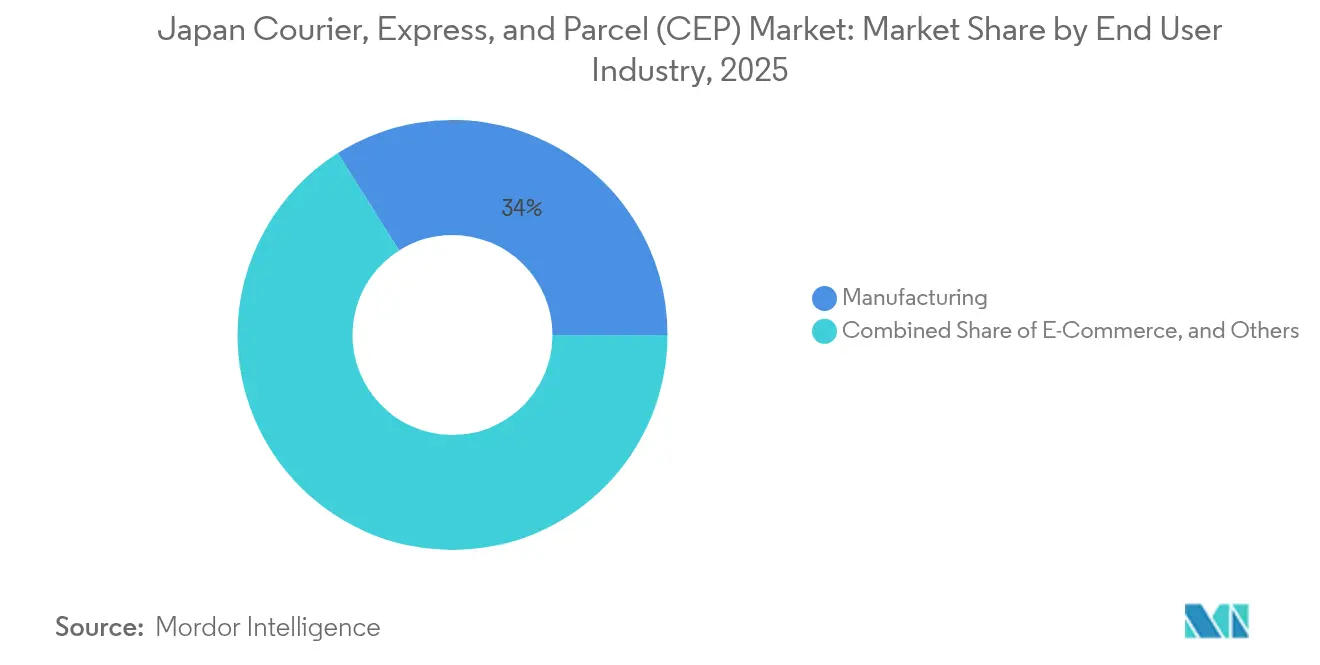
- By end user industry, manufacturing dominated with 33.95% of the Japan courier, express, and parcel market share in 2025, whereas e-commerce is poised for the fastest 4.62% CAGR between 2026-2031.
Note: Market size and forecast figures in this report are generated using Mordor Intelligence’s proprietary estimation framework, updated with the latest available data and insights as of 2026.
Japan Courier, Express, And Parcel (CEP) Market Trends and Insights
Drivers Impact Analysis*
| Driver | (≈) % Impact on CAGR Forecast | Geographic Relevance | Impact Timeline |
|---|---|---|---|
| E-commerce boom driving B2C parcel volumes | +1.2% | Nationwide, Tokyo-Osaka corridor | Short term (≤ 2 years) |
| Corporate demand for same-day intra-city deliveries | +0.8% | Tokyo, Osaka, Nagoya | Medium term (2-4 years) |
| Growing cross-border e-commerce imports | +0.6% | National, airport gateways | Medium term (2-4 years) |
| Aging population and home-delivery healthcare | +0.4% | Country-wide, rural prefectures | Long term (≥ 4 years) |
| Carbon-neutral last-mile vehicle incentives | +0.3% | Urban centers | Long term (≥ 4 years) |
| Ship-from-store expansion by omnichannel retailers | +0.5% | Major retail chains nationwide | Medium term (2-4 years) |
| Source: Mordor Intelligence | |||


E-commerce Boom Driving B2C Parcel Volumes
B2C e-commerce transactions climbed 9.23% year over year, funneling higher volumes of small parcels into carrier networks and pushing companies to deploy micro-fulfillment centers near demand clusters. As order frequencies rise, route density improves but delivery promises tighten, prompting investments in AI-based dispatch and consumer-facing tracking tools. Retailers are deepening omnichannel strategies under national digital transformation programs, further anchoring parcel growth. Carriers must now balance scale economies with cost pressures from free-shipping promotions. Success hinges on flexible automation that handles flux in daily parcel loads while protecting unit margins[1]“Transport Policy Framework,” Ministry of Land, Infrastructure, Transport and Tourism, mlit.go.jp .
Corporate Demand for Same-Day Intra-City Deliveries
Enterprises in Tokyo, Osaka, and Nagoya are paying premiums for intra-city deliveries completed within hours to reduce inventory buffers and keep production flowing. Predictable shipment profiles allow carriers to run dedicated same-day loops that maximize vehicle utilization. Advanced routing engines and real-time traffic feeds create tight delivery windows that corporate clients demand. Urban congestion, however, restricts van access during peak hours, pushing carriers toward cargo bikes, consolidation hubs, and robotic drop-offs approved under smart-city pilots. These adaptations widen service gaps between tech-enabled leaders and smaller firms unable to fund new assets[2]“E-Commerce Market Survey,” Ministry of Economy, Trade and Industry, meti.go.jp.
Growing Cross-Border E-Commerce Imports into Japan
Japanese consumers are buying more goods from Asian and North American platforms, lifting demand for customs-cleared delivery offerings that blend duty calculation, language support, and reverse-logistics options. Carriers with bonded warehouses near Narita and Kansai airports enjoy a barrier to entry rooted in compliance know-how and capital-heavy infrastructure. While premiums offset complexity, investments in automated tariff engines and data integration with customs are essential. Regional trade agreements are trimming paperwork, yet stringent consumer-protection laws mean carriers must still navigate intricate return-processing rules unique to Japan.
Aging Population Requiring Home-Delivery Healthcare Logistics
Japan’s median age exceeds 48 years, spurring steady demand for prescription drug drop-offs, medical device replenishment, and sample transport that all require GDP-certified handling. Temperature-controlled micro-vehicles and IoT-enabled totes ensure cold-chain integrity from depot to doorstep. Stable volume under multiyear healthcare contracts cushions carriers against cyclical swings in consumer retail. Service reliability is paramount, prompting higher investment in validation audits and specialized training. This defensible niche aligns with government goals for home-based elder care, making it a strategic pillar for growth amid declining working-age populations.
Restraints Impact Analysis*
| Restraint | (≈) % Impact on CAGR Forecast | Geographic Relevance | Impact Timeline |
|---|---|---|---|
| Chronic driver shortage and rising labor costs | -1.8% | Nationwide, acute in suburban and rural areas | Short term (≤ 2 years) |
| Urban congestion rules limiting vehicle access | -0.7% | Tokyo and Osaka metropolitan regions | Medium term (2-4 years) |
| High last-mile costs in rural prefectures | -0.4% | Mountainous and low-density prefectures | Long term (≥ 4 years) |
| Strict data-privacy rules slowing drone adoption | -0.2% | Country-wide, stronger oversight in cities | Medium term (2-4 years) |
| Source: Mordor Intelligence | |||
Chronic Driver Shortage and Rising Labor Costs
The 2024 overtime limit capped annual extra hours at 960, sidelining an estimated 14% of nationwide trucking capacity and inflating per-parcel costs as carriers offer higher wages and bonuses to retain staff. Automation in sorting yards and autonomous shuttle pilots partially offset staffing gaps, yet rural routes remain vulnerable due to sparse demand and limited tech feasibility. Consolidation among regional carriers is accelerating as smaller operators struggle under rising payrolls and compliance audits[3]“Urban Transport Policies,” Tokyo Metropolitan Government, metro.tokyo.lg.jp .
Urban Congestion Regulations Limiting Delivery Vehicle Access
Municipal roadmaps that prioritize pedestrian zones restrict commercial vans during peak hours, forcing carriers to pre-position goods in micro depots and use low-speed robots or cargo bikes for the final leg. Time-window constraints misalign with consumer preferences for evening deliveries, amplifying failed-delivery rates. Compliance costs mount as fleets require telematics to prove adherence to zone rules. While congestion tolls aim to reduce emissions, they also erode express-delivery margins unless offset by premium surcharges[4]“Regional Development Statistics,” Ministry of Internal Affairs and Communications, soumu.go.jp.
*Our forecasts treat driver/restraint impacts as directional, not additive. The impact forecasts reflect baseline growth, mix effects, and variable interactions.
Segment Analysis
By End User Industry: Manufacturing Dominance Faces E-Commerce Challenge
Manufacturing generated 33.95% of 2025 revenue, reflecting just-in-time parts flows and export documentation services. Yet e-commerce, growing at 4.62% CAGR between 2026-2031, is closing the gap as direct-to-consumer brands outsource fulfillment. Healthcare, financial services, and agriculture each impose unique compliance demands such as cold-chain integrity or secure chain-of-custody, prompting carriers to create vertical-specific SOPs.
Manufacturers value rigid on-time-in-full metrics and bulk shipment discounts, whereas online merchants reward carriers for parcel-level visibility and effortless returns. Providers tailoring segmented service catalogs—industrial freight desks, fashion returns portals, pharma cold lockers—build stickier relationships and enhance wallet share across the Japan courier, express, and parcel market.


By Destination: Domestic Dominance Drives Operational Scale
Domestic shipments captured 63.55% of the Japan courier, express, and parcel market in 2025, reflecting dense intercity corridors and synchronized inventory cycles among manufacturers and retailers. This scale allows carriers to schedule trunk lines with near-full loads, supporting cost leadership strategies. International traffic, though smaller, posts a 4.41% CAGR between 2026-2031 as cross-border marketplaces expand, pushing carriers to invest in bonded facilities, multilingual customer care, and integrated duty-payment platforms. Competitive differentiation pivots on customs-clearance speed, a critical KPI for imported fashion and electronics sellers targeting next-day delivery from overseas gateways.
Domestic parcel volumes hinge on consumer promotional calendars and just-in-time manufacturing, creating predictable peaks around fiscal year-end and holiday seasons. International growth, by contrast, tracks foreign platform promotions and currency swings. Carriers leveraging bilateral trade agreements and automated harmonized-code matching are poised to win in this higher-margin segment. Yet they must balance resources, because adding international lanes without diluting core domestic service quality risks eroding the Japan courier, express, and parcel market reputation for reliability.
By Speed of Delivery: Express Services Gain Momentum Despite Non-Express Dominance
Non-express options held a 74.10% share in 2025, signaling that cost remains paramount for most shippers. Still, express offerings are climbing at 4.86% CAGR between 2026-2031, driven by subscription-commerce models and corporate spare-parts programs that mandate same-day fulfillment. These services rely on dedicated line-haul schedules, premium cargo space at airports, and dynamic route planning that uses live traffic feeds. Higher price points partially offset incremental costs from night-shift wages and priority handling.
Service bifurcation is sharpening operational cultures: standard networks pursue lean staffing and high-throughput automation, while express divisions cultivate white-glove protocols and advanced customer portals. Investments in IoT sensors and predictive ETAs bolster the perceived value of express lanes. As consumer expectations tighten, carriers integrating both service tiers on a single digital platform can flex capacity based on demand swings, reinforcing their stake in the Japan courier, express, and parcel market.
By Shipment Weight: Light Parcels Dominate Volume, Heavy Shipments Drive Growth
Light weight parcels accounted for 50.05% of 2025 shipments, benefiting from automation-friendly dimensions that glide through high-speed sorters. Heavy weight parcels grow faster at 3.92% CAGR between 2026-2031, propelled by online furniture and industrial machinery parts that exceed 20 kg. Sorting centers now feature mixed-weight lanes that adjust roller pitch and clearance heights automatically, cutting manual touches and injury risk.
The proliferation of light parcels enables route densification, lowering per-stop costs. Heavy items, while fewer, command surcharges and special-handling fees that lift revenue per piece. Balancing both streams requires modular fleet design; vans with fold-away bulkheads quickly switch between palletized freight and small-parcel racks. This versatility strengthens operator resilience in the Japan courier, express, and parcel market.
By Mode of Transport: Road Transport Maintains Leadership Amid Modal Shift
Road conveyed 50.62% of parcels in 2025 due to unmatched door-to-door flexibility. Air freight, at a 3.61% CAGR between 2026-2031, underpins express and cross-border services where velocity justifies higher cost. Rail and coastal shipping address cost-sensitive lanes, leveraging government subsidies that reward lower emissions. Modal diversification is encouraged through grants for intermodal hubs that link trucking docks with rail spurs.
Rising diesel prices and decarbonization targets push carriers to experiment with electric trucks on urban routes and hydrogen fuel cells for longer hauls. Some operators now run night trains carrying roll cages between Osaka and Tokyo, freeing daytime highway slots for same-day vans. Effective orchestration across modes is emerging as a competitive moat within the Japan courier, express, and parcel market.
By Model: B2C Leadership Reflects Consumer-Driven Evolution
B2C consignments represented 51.25% of 2025 volume, propelled by household orders of apparel, groceries, and electronics. Peak-shopping events create daily surges that test sortation capacity and delivery-window accuracy. C2C traffic, rising at 3.42% CAGR between 2026-2031, mirrors the popularity of resale apps that move single-item parcels across prefectures. B2B flows remain critical for supply-chain continuity but witness fewer dispatches as manufacturers shift toward consolidated shipments.
Omnichannel retail has blurred B2C and B2B boundaries, with store replenishment sometimes routed through the same urban hubs that feed home deliveries. This convergence requires flexible labeling and invoicing systems that can switch between tax-inclusive consumer formats and wholesale documentation. Carriers adept at integrating these data layers maintain a stronger grip on the Japan courier, express, and parcel industry.
Geography Analysis
Greater Tokyo and Osaka generate the highest parcel densities, allowing four-hour tour loops that cover hundreds of stops. These megaregions provide the critical mass supporting same-day promises and micro-fulfillment investments. Coastal industrial belts add predictable B2B freight, while remote prefectures confront sparse volumes that inflate delivery unit costs threefold compared with metro areas.
Mountainous terrain and fragmented islands complicate route planning; ferries and air taxis carry urgent parcels to Okinawa and Hokkaido. Rural demographics skew older, increasing medical supply shipments but limiting discretionary e-commerce spend. Government regional-revitalization grants subsidize locker banks and drone tests aimed at lowering last-mile expense, yet economic viability hinges on pooling volumes across carriers.
Cross-prefecture migration patterns toward urban centers shift demand west-to-east, reinforcing the dominance of trunk lanes linking Nagoya, Osaka, and Tokyo. As high-speed rail extensions come online, carriers explore containerized parcel pods that transfer seamlessly between train flatcars and electric vans, tightening service cycles while cutting emissions across the Japan courier, express, and parcel market.
Competitive Landscape
The market shows moderate consolidation. Yamato Holdings, Japan Post, and SG Holdings lead on network scale, automation spending, and vertical solutions. Yamato’s Kyushu acquisition expanded regional reach and underpinned autonomous-robot pilots in Tokyo, bolstering last-mile productivity. Japan Post leverages its post-office footprint to roll out nationwide locker banks, smoothing failed-delivery reattempts. SG Holdings’ 30% EV fleet target by 2027 positions the company to win eco-conscious corporate accounts.
Smaller carriers specialize: Nippon Express focuses on cross-border cold chain via its USD 150 million Narita hub, capturing life-science demand. Tech-startups supply route-planning software and crowdsourced couriers, pressuring incumbents to open API gateways. Joint ventures between retailers and logistics players test in-store pick-and-pack models that bypass central depots, challenging legacy hub-and-spoke economics.
Regulation continues to shape rivalry. The 2024 driver-hour cap favors cash-rich incumbents that can automate depots and finance EV fleets, potentially accelerating consolidation. Nevertheless, niche entrants that master healthcare compliance or rural drone delivery can carve profitable footholds, keeping the Japan courier, express, and parcel market competitively vibrant.
Japan Courier, Express, And Parcel (CEP) Industry Leaders
Japan Post Holdings Co., Ltd.
SG Holdings Co., Ltd.
Yamato Holdings Co., Ltd.
Nippon Express Holdings
DHL Group
- *Disclaimer: Major Players sorted in no particular order

Recent Industry Developments
- November 2024: Yamato Holdings acquired Kyushu logistics assets and began urban autonomous robot pilots in Tokyo and Osaka.
- October 2024: SG Holdings launched a fleet electrification program targeting 30% EV adoption by 2027, coupled with carbon-neutral services for corporate shippers.
- September 2024: Nippon Express opened a USD 150 million automated international hub at Narita Airport featuring expanded cold-chain capacity.
- August 2024: FedEx partnered with regional carriers to debut same-day delivery in Tokyo, adding sort centers and dedicated urban fleets.


Japan Courier, Express, And Parcel (CEP) Market Report Scope
Domestic, International are covered as segments by Destination. Express, Non-Express are covered as segments by Speed Of Delivery. Business-to-Business (B2B), Business-to-Consumer (B2C), Consumer-to-Consumer (C2C) are covered as segments by Model. Heavy Weight Shipments, Light Weight Shipments, Medium Weight Shipments are covered as segments by Shipment Weight. Air, Road, Others are covered as segments by Mode Of Transport. E-Commerce, Financial Services (BFSI), Healthcare, Manufacturing, Primary Industry, Wholesale and Retail Trade (Offline), Others are covered as segments by End User Industry.Destination
| Domestic |
| International |
Speed of Delivery
| Express |
| Non-Express |
Model
| Business-to-Business (B2B) |
| Business-to-Consumer (B2C) |
| Consumer-to-Consumer (C2C) |
Shipment Weight
| Heavy Weight Shipments |
| Light Weight Shipments |
| Medium Weight Shipments |
Mode of Transport
| Air |
| Road |
| Others |
End User Industry
| E-Commerce |
| Financial Services (BFSI) |
| Healthcare |
| Manufacturing |
| Primary Industry |
| Wholesale and Retail Trade (Offline) |
| Others |
| Destination | Domestic |
| International | |
| Speed of Delivery | Express |
| Non-Express | |
| Model | Business-to-Business (B2B) |
| Business-to-Consumer (B2C) | |
| Consumer-to-Consumer (C2C) | |
| Shipment Weight | Heavy Weight Shipments |
| Light Weight Shipments | |
| Medium Weight Shipments | |
| Mode of Transport | Air |
| Road | |
| Others | |
| End User Industry | E-Commerce |
| Financial Services (BFSI) | |
| Healthcare | |
| Manufacturing | |
| Primary Industry | |
| Wholesale and Retail Trade (Offline) | |
| Others |


Market Definition
- Courier, Express, and Parcel - The Courier, Express, and Parcel services, often called as CEP Market, refers to the logistics and postal service providers which specialize in moving small goods (parcels/packages). It captures the overall market size (USD) and market volume (number of parcels) of (1) the shipments/parcels/packages which are under 70kgs/ 154lbs weight, (2) Business Customer packages viz. Business-to-Business (B2B) & Business-to-Consumer (B2C) as well as private customer packages (C2C), (3) non-express parcel delivery services (Standard and Deferred) as well as express parcel delivery services (Day-Definite-Express and Time-Definite-Express), (4) domestic as well as international shipments.
- Demographics - To analyse total addressable market demand, population growth & forecasts have been studied and presented in this industry trend. It represents population distribution across categories like gender (male/female), development area (urban/rural), major cities among other key parameters like population density and final consumption expenditure (growth and share % of GDP). This data has been used for assessing the fluctations in demand & consumption expenditure, and the major hotspots (cities) of potential demand.
- Domestic Courier Market - Domestic Courier Market refers to the CEP shipments wherein the origin and destination is within the boundary of the geography studied (country or region as per the scope of report). It captures the market size (USD) and market volume (number of parcels) of (1) the shipments/parcels/packages which are under 70kgs/ 154lbs weight, including light weight shipments, medium weight shipments and heavy weight shipments (2) Business Customer packages viz. Business-to-Business (B2B) & Business-to-Consumer (B2C) as well as private customer packages (C2C), (3) non-express parcel delivery services (Standard and Deferred) as well as express parcel delivery services (Day-Definite-Express and Time-Definite-Express).
- E-Commerce - This end user industry segment captures the external (outsourced) logistics expenditure incurred by the e-tailers, through online sales channel, on Courier, Express, and Parcel (CEP) services. The scope includes (i) the supply chain of a company's online customer orders being fulfilled, (ii) the process of getting a product from the point of manufacturing to the point at which it is delivered to consumers. It involves managing inventory (deferred as well as time critical), shipping, and distribution.
- Export Trends and Import Trends - Overall logistics performance of an economy is positively and significantly (statistically) correlated to its trade performance (exports and imports). Hence, in this industry trend, total value of trade, major commodities/ commodity groups and the major trade partners, for the studied geography (country or region as per the scope of report) have been analysed alongside the impact of major trade/logistics infrastructure investments & regulatory environment.
- Financial Services (BFSI) - This end user industry segment captures the external (outsourced) logistics expenditure incurred by the BFSI players, on Courier, Express, and Parcel (CEP) services. CEP is important to the financial services industry in shipping of confidential documents and files. The establishments in this sector are engaged in (i) financial transactions (that is, transactions involving the creation, liquidation, or change in ownership of financial assets) or in facilitating financial transactions, (ii) financial intermediation, (iii) the pooling of risk by underwriting annuities and insurance, (iv) providing specialized services that facilitate or support financial intermediation, insurance and employee benefit programs, and (v) monetary control - the monetary authorities.
- Fuel Price - Fuel price spikes can cause delays and diruption for logistics service providers (LSPs), while drops in the same can result in higher short-term profitability and increased market rivalry to offer consumers with the best deals. Hence, the fuel price variations have been studied over the review period and presented along with the causes as well as market impacts.
- GDP Distribution by Economic Activity - Nominal Gross Domestic Product and distribution of the same, across major economic sectors in the geography studied (country or region as per scope of the report) have been studied and presented in this industry trend. As GDP is positively related to the profitability and growth of logistics industry, this data has been used in adjunction to the input-output tables/ supply-use tables for analyzing the potential major contributing sectors towards the logistics demand.
- GDP Growth by Economic Activity - Growth of Nominal Gross Domestic Product across major economic sectors, for the geography studied (country or region as per scope of the report) have been presented in this industry trend. This data has been utilized for assessing the growth of logistics demand from all the market end users (economic sectors considered here).
- Healthcare - This end user industry segment captures the external (outsourced) logistics expenditure incurred by the Healthcare players (Hospitals, clinics, mrdical centres) , on Courier, Express, and Parcel (CEP) services. The scope includes CEP services involved in the defrerred as well time critical movement of medical goods & supplies (surgical supplies and instruments, including gloves, masks, syringes, equipment). The establishments in this sector (i) include the ones providing medical care exclusively (ii) deliver services by trained professionals (iii) involve processes, including labor inputs of health practitioners with the requisite expertise (iv) are defined based on the educational degree held by the practitioners included in the industry.
- Inflation - Variations in both Wholesale Price Inflation (YoY change in producer price index) and Consumer Price Inflation have been presented in this industry trend. This data has been used to assess the inflationary environment as it plays a vital role in smooth functioning of the supply chain, directly impacting the logistics operational cost components e.g., pricing of tyres, driver wages & benefits, energy/fuel prices, maintenace costs, toll charges, warehousing rents, custom brokerage, forwarding rates, courier rates etc. hence impacting the overall freight and logistics market.
- Infrastructure - As infrastructure plays a vital role in an economy's logistics performance, variables like length of roads, distribution of road length by surface category (paved v/s unpaved), distribution of road length by road classification (expressways v/s highways v/s other roads), rail length, volume of containers handled by major ports and tonnage handled by major airports have been analysed and presented in this industry trend.
- International Express Service Market - International Express Service Market refers to the CEP shipments wherein the origin or destination is not within the boundary of the geography studied (country or region as per the scope of report). It captures the market size (USD) and market volume (number of parcels) of (1) the shipments/parcels/packages which are under 70kgs/ 154lbs weight, including light weight shipments, medium weight shipments and heavy weight shipments (ii) Inter-Region as well as Intra-Region Shipments
- Key Industry Trends - The report section named "Key Industry Trends" include all the key variables/parameters studied to better analyze the market size estimates and forecasts. All the trends have been presented in the form of data points (time series or latest available data points) along with analysis of the paramter in the form of concise market relevant commentary, for the geography studied (country or region as per the scope of report).
- Key Strategic Moves - The action taken by a company to differentiate from its competitor or used as a general strategy is referred to as a key strategic move (KSM). This includes (1) Agreements (2) Expansions (3) Financial Restructuring (4) Mergers and Acquisitions (5) Partnerships, and (6) Product Innovations. Key players (Logistics Service Providers, LSPs) in the market have been shortlisted, their KSM have been studied and presented in this section.
- Logistics Performance - Logistics Performance and Logistics Costs are the backbone of trade, and influences trade costs, making countries compete globally. Logistics performance is influenced by market wide adopted supply chain management strategies, government services, investments & policies, fuel/ energy costs, inflationary environment etc. Hence, in this industry trend, the logistics performance of the geography studied (country/ region as per the scope of report) has been analysed and presented over the review period.
- Manufacturing - This end user industry segment captures the external (outsourced) logistics expenditure incurred by the Manufacturing industry (including Hi-Tech/Technology) players, on Courier, Express, and Parcel (CEP) services. The end user players considered are the establishments primarily engaged in the chemical, mechanical or physical transformation of materials or substances into new products. Logistics Service Providers (LSPs) play a crucial role in maintaining a smooth flow of raw materials across the supply chain, enabling timely delivery of finished goods to distributors or end customers and storing & supplying the raw materials to clients for just-in-time manufacturing.
- Other End Users - Other end user segment captures the external (outsourced) logistics expenditure incurred by the construction, real estate, educational services, and professional services (administrative, waste management, legal, architectural, engineering, design, consulting, scientific R&D), on Courier, Express, and Parcel (CEP) services. Logistics Service Providers (LSPs) plays a crucial role in the reliable movement of time critical supplies and documents to/from these industries such as transporting any equipment or resources required, shipping confidential documents and files.
- Primary Industry - This end user industry segment captures the external (outsourced) logistics expenditure incurred by the AFF (Agriculture, Fishing, and Forestry) and Extraction indsutry (Oil &Gas, Quarrying and Mining) players, on Courier, Express, and Parcel (CEP) services. The end user players considered are the establishments (i) primarily engaged in growing crops, raising animals, harvesting timber, harvesting fish & other animals from their natural habitats and providing related support activities; (ii) that extract naturally occurring mineral solids, such as coal and ores; liquid minerals, such as crude petroleum; and gases, such as natural gas. Herein, Logistics Service Providers (LSPs) (i) play a crucial role in acquisition, storage, handling, transportation, and distribution activities for the optimal & continuous flow of inputs (seeds, pesticides, fertilizers, equipment, and water) from manufacturers or suppliers to the producers and smooth flow of output (produce, agro-goods) to distributors/ consumers; (ii) cover entire phases from upstream to downstream and play a crucial role in the transportation of machinery, drilling equipments, extracted minerals, crude oil & natural gas and refined/ processed products from one place to another. This includes both termperature controlled and non-temperature controlled logistics, as and when required according to the shelf life of goods being transported or stored.
- Producer Price Inflation - It indicates inflation from viewpoint of the producers viz. the average selling price received for their output over a period of time. Annual change (YoY) of producer price index is reported as wholesale price inflation in the "Inflation" industry trend. As WPI captures dynamic price movements in most comprehensive way, it is widely used by governments, banks, industry, business circles and is deemed important in formulation of trade, fiscal and other economic policies. The data has been used in adjunction to consumer price inflation for better understanding the inflationary environment.
- Segmental Revenue - Segmental Revenue has been triangulated or computed and presented for all the major players in the market. It refers to the courier, express, and parcel (CEP) market specific revenue earned by the company, over the base year of study, in the geography studied (country or region as per the scope of report). It is computed through the study and analysis of major parameters like financials, service portfolio, employee strength, fleet size, investments, number of countries present in, major economies of concern, etc. that have been reported by the company in its annual reports, webpage. For companies having scarce financial disclosures, paid databases like D&B Hoovers, Dow Jones Factiva have been resorted to and verified through industry/expert interactions.
- Transport and Storage Sector GDP - Value and growth of Transport and Storage Sector GDP has a direct relation to the freight and logistics market size. Hence, this variable has been studied and presented over the review period, in value terms (USD) and as share % of total GDP, in this industry trend. The data has been supported by concise and relevant commentary around the investments, developments, and current market scenario.
- Trends in E-Commerce Industry - Enhanced internet connectivity and boom in smartphone penetration, coupled with increasing disposable incomes, has led to a phenomenal growth in the e-commerce market globally. Online shoppers require fast and efficient delivery of their orders leading to an increase in the demand for logistics services especially e-commerce fulfilment services. Hence, the Gross Merchandise Value (GMV), historial and projected growth, breakup of major commodity groups in e-commerce industry for the studied geography (country or region as per scope of the report) have been analysed and presented in this industry trend.
- Trends in Manufacturing Industry - Manufacturing industry involves the transformation of raw materials into finished products, while logistics industry ensures the efficient flow of raw materials to the factory, and the transport of manufactured products to the distributors & consumers. Demand-Supply of both industries are highly cross-linked and critical for a seamless supply chain. Hence, the Gross Value Added (GVA), breakup of GVA into major manufacturing sectors, and growth of manufacturing industry over the review period have been analysed and presented, in this industry trend.
- Wholesale and Retail Trade (Offline) - This end user industry segment captures the external (outsourced) logistics expenditure incurred by the wholesalers and retailers, through offline sales channel, on Courier, Express, and Parcel (CEP) services. The end user players considered are the establishments primarily engaged in wholesaling or retailing merchandise, generally without transformation, and rendering services incidental to the sale of merchandise. Logistics Service Providers (LSPs) plays a crucial role in the reliable movement of supplies to and finished products from production houses to the distributors and finally to the end customer covering activites like material sourcing, transportation, order fulfillment, warehousing & storage, demand forecasting, inventory management etc.
| Keyword | Definition |
|---|---|
| Axle Load | The axle load refers to the total load (weight) bearing on the roadway through wheels connected to a given axle. Across the globe, there are systems in place to ensure axle load monitoring, wherein surpassing the defined limits set by the concerned regulatory authority can lead to penalty/fine. For transportation of goods via road this can be an important determinant of costs as knowledge about the axle load limits can be used to (i) load the vehicle optimally for maximizing profits (ii) avoid exceeding the same and hence the probable fines associated (iii) avoid wear and tear of the vehicle (iv) avoid damage to pavement resulting in noticeable public maintenance and repair costs (v) achieve better turnaround time. |
| Back Haul | Backhaul is the return movement of a transport vehicle from its original destination to its original point of departure, and can include full, partial, or empty truck loads (all or part of the way) depending on the visibility of the local freight ecosystem. In this regard, transportation of empty containers to the point of origin, known as deadheading is also a significant factor, considering the supply/container shortages across the geographies, resulting in cost escalation and under optimized profit potential attainment. Generally, the carriers offer discounts on the backhaul, to secure freight for the trip. |
| Bill of Lading (BOL) | A bill of lading is a legal contract document issued by a carrier to a shipper to acknowledge reception of their cargo, and is evidence for the contract of carriage between the two parties. Broadly it details the (i) type, quantity, and other specifications of the goods being carried (ii) destination, and terms & conditions of the shipment (iii) carrier and drivers with all the necessary information to process the shipment, which can be used for insurance and customs clearance purposes (iv) assurance that the consignment is damage-free and ready to be shipped to the consignee. In this regard, a house bill of lading (HBL) is a document issued by a freight forwarder or a non-vessel operating common carrier (NVOCC) to acknowledge receipt of items for shipment (to a shipper). If shipments from several shippers are involved a master bill of lading (MBL) might be involved which is a consolidated version of the same for all the shipments being taken care of by the carrier (to a common destination) and might be issued by the carrier to the freight forwarder or the shipper (depending on who books the transport). |
| Bunkering | Bunkering is the process of supplying fuel to power the propulsion system of a ship. It includes the logistics of loading and distributing the fuel among available shipboard tanks. In this regard, (i) Bunker fuel is technically any type of fuel oil used aboard ships. It gets its name from the containers on ships and in ports that it is stored in; in the days of steam they were coal bunkers but now they are bunker-fuel tanks, (ii) Bunker refers to the spaces (Tank) on board a vessel to store fuel, (iii) Bunker trader refers to a person dealing in trade of bunker (fuel), (iv) Bunker call is made when a cargo ship anchors or berths in a port to take on bunker oil or supplies, (v) Bunkering service is the supply of a requested quality and quantity of bunkers to a ship. Bunkering is signficant from point of view of freight rates applicable to the shipper as Bunker Contribution (BUC)/ Fuel Adjustment Factor (FAF)/ Bunker Adjustment Factor (BAF) are applied by shipping lines to offset the effect of fluctuations in the cost of bunkers. |
| Cabotage | Transport by a vehicle registered in a country, performed on the national territory of another country. Cabotage law may restrict domestic cargo traffic to be carried in its own nationally registered, and sometimes built and crewed vehicles, though regulations vary across industries/commodity groups/countries and sometimes specify maximum allowable percentage of cabotage that can be serviced by foreign registered fleet. |
| C-commerce | Collaborative commerce (also known as C-commerce), (i) describes electronically enabled business interactions among an enterprise’s internal personnel, business partners and customers throughout a trading community (industry, industry segment, supply chain or supply chain segment); (ii) is the optimization of supply and distribution channels to capitalize on the global economy by using new technology efficiently. Advantages of C-commerce, to detail few include (i) maximization of organization's efficiency and profitability (ii) technology integration with physical channels to allow companies to work together (iii) increased information exchange such as inventory and product specifications, using the web as an intermediary (iv) increased competitiveness by reaching a broader audience. Examples of C-commerce, also known as peer-to-peer commerce, include (i) companies that allow consumers to rent things from each other, or marketplaces, such as Meta (formerly Facebook) Marketplace, that allow the sale of used goods; (ii) DoorDash teamed up with many national brands, such as McDonald’s and Chipotle, to offer fast food delivery, building their business model on c-commerce. They have since expanded their delivery service from restaurants to retailers and even offer 'fleets' of drivers to businesses. |
| Courier | A business/company that delivers packages/parcels/shipments (upto 70 kgs) including quick door to door pickup and delivery service for goods or documents, domestically or internationally, on a commercial contract basis. Example, DHL Group, FedEx, United Parcel Service of America, Inc., USPS, International Distributions Services, J&T Express, SF Express among several others |
| Cross docking | Cross docking is a practice in logistics management that includes unloading incoming delivery vehicles and loading the materials directly into outbound delivery vehicles, omitting traditional warehouse logistical practices and saving time and money. It requires close synchronization of both inbound and outbound movements. It is highly significant in reduction of costs pertaining to warehousing & storage (and the associated Value Added Services). |
| Cross Trade | International transport between two different countries performed by a vehicle registered in a third country. A third country is a country other than the country of loading/embarkation and the country of unloading/disembarkation. Cross Trade law may restrict international cargo traffic to be carried by respective country's registered vehicles, and sometimes built and crewed vehicles, though regulations vary across industries/commodity groups/countries and sometimes specify maximum allowable percentage of cross trade that can be serviced by foreign registered fleet. |
| Customs Clearance | The process of declaring and clearing cargoes through customs. It includes the procedures involved in getting cargo released by Customs through designated formalities such as presenting import license/permit, payment of import duties and other required documentations by the nature of the cargo. In this regard, a customs broker is a person or company licensed by the respective department of the country to act on behalf of freight importers and exporters. |
| Dangerous Goods | Dangerous goods (or hazardous materials or HAZMAT) include flammable liquids/solids, gases (compressed, liquified, dissolved under pressure), corrosives, oxidising substances, explosive substances and articles, substances which on contact with water emit flammable gasses, organic peroxides, toxic substances, infectious substances, radioactive materials, miscellaneous dangerous goods and articles. |
| First mile Delivery | First mile delivery refers to the (i) first stage of the freight/shipment/cargo/courier transportation (ii) the transportation of goods from a merchant’s premises or warehouse to the next fulfillment centre/warehouse/hub from where the goods are forwarded (iii) shipping goods from local distribution centers to stores (For retailers) (iv) transportation of finished goods from a plant or a factory to a distribution center (For manufacturers), (v) pick up of goods from the end-customer’s home or store followed by movement to a warehouse or storage location (movers and packers), (vi) process where goods are picked up from a retailer and then transferred to third-party logistics providers or courier service providers to be delivered to the end-consumer (e-commerce). Once the package reaches the next warehouse or the courier’s hub, it is then sorted and transported further until it reaches the customer’s doorstep. Example, if one chooses UPS as a courier, first-mile delivery will be the product being delivered from manufacturer's/retailer's warehouse to the UPS’s warehouse/ fulfilment centre. |
| Last Mile Delivery | Last mile delivery refers to the very last step of the delivery process when a parcel is moved from a transportation hub (warehouse or a distribution center or fulfillment centre) to its final destination, which usually is a personal residence/retail store/ business, or parcel locker. It accounts for around half of the total cost involved in entire process of first mile, middle mile, and last mile delivery, though it can vary shipment to shipment, based on commodity, business model and similar factors. |
| Milkrun | A Milk Run is a delivery method used to transport mixed loads from various suppliers to one customer, using lean management principles applied to logistics. Instead of each supplier sending a truck every week to meet the needs of one customer, one truck (or vehicle) visits the suppliers to pick up the loads for that customer. This method of transport got its name from the dairy industry practice, where one tanker used to collect milk from several dairy farms for delivery to a milk processing company. A milk run can be a more efficient way to handle logistics but require proper planning. If the route involves products from different companies, there is need for an agreement about cost-sharing and other aspects of the cooperative delivery arrangement. Once the group settles these issues, this delivery method can save time and money for everyone by pooling operation costs and resources. |
| Multi country consolidation | Multi-Country Consolidation (MCC) is a cost-effective solution that consolidates one's cargo from different countries of origin to build Full Container Loads (FCL). MCC is most suitable for companies that import light volumes of goods from multiple countries but want to take advantage of the more economic FCL freight rates. Apart from costing some of the other advantages include (i) flexibility to choose suppliers from a wider range of origin countries without worrying about the logistics to final destination from each origin, (ii) ability to pick the most suitable suppliers from many different countries for one's business operations. The increase in one's sourcing options by MCC provides the kind of flexibility needed in competitive global markets. |
| Q-commerce | Q-commerce, also referred to as quick commerce, is a type of e-commerce where emphasis is on quick deliveries, typically in less than an hour. The companies providing Q-Commerce services might have vertically intergrated model or might be using third party delivery platforms (outsourced logistics). It has advantages like (i) competitve USP, (ii) potential to earn greater profit margins, (iii) better customer experience, (iv) guaranteed availability of products, (v) traceability, and (vi) scaleability. |
| ReverseLogistics | Reverse logistics is a type of supply chain management that moves goods from customers back to the sellers or manufacturers and may involve ciruclar economy principles (3Rs) viz. recycling, reuse (repurposing, reselling), reducing or repairing. In this regard, reverse commerce (or Recommerce) is the selling of previously owned items through physical or online marketplaces/distribution channels to buyers who reuse, recycle or resell them. |


Research Methodology
Mordor Intelligence follows a four-step methodology in all our reports.
- Step-1: Identify Key Variables: In order to build a robust forecasting methodology, the variables and factors identified in Step-1 are tested against available historical market numbers. Through an iterative process, the variables required for market forecast are set and the model is built on the basis of these variables.
- Step-2: Build a Market Model: Market-size estimations for the forecast years are in nominal terms. Inflation is considered to be a part of the pricing, and the average selling price (ASP) is varying throughout the forecast period for each country
- Step-3: Validate and Finalize: In this important step, all market numbers, variables and analyst calls are validated through an extensive network of primary research experts from the market studied. The respondents are selected across levels and functions to generate a holistic picture of the market studied.
- Step-4: Research Outputs: Syndicated Reports, Custom Consulting Assignments, Databases & Subscription Platforms


