Market Overview
| Study Period | 2018 - 2031 |
|---|---|
| Forecast Data Period | 2026 - 2031 |
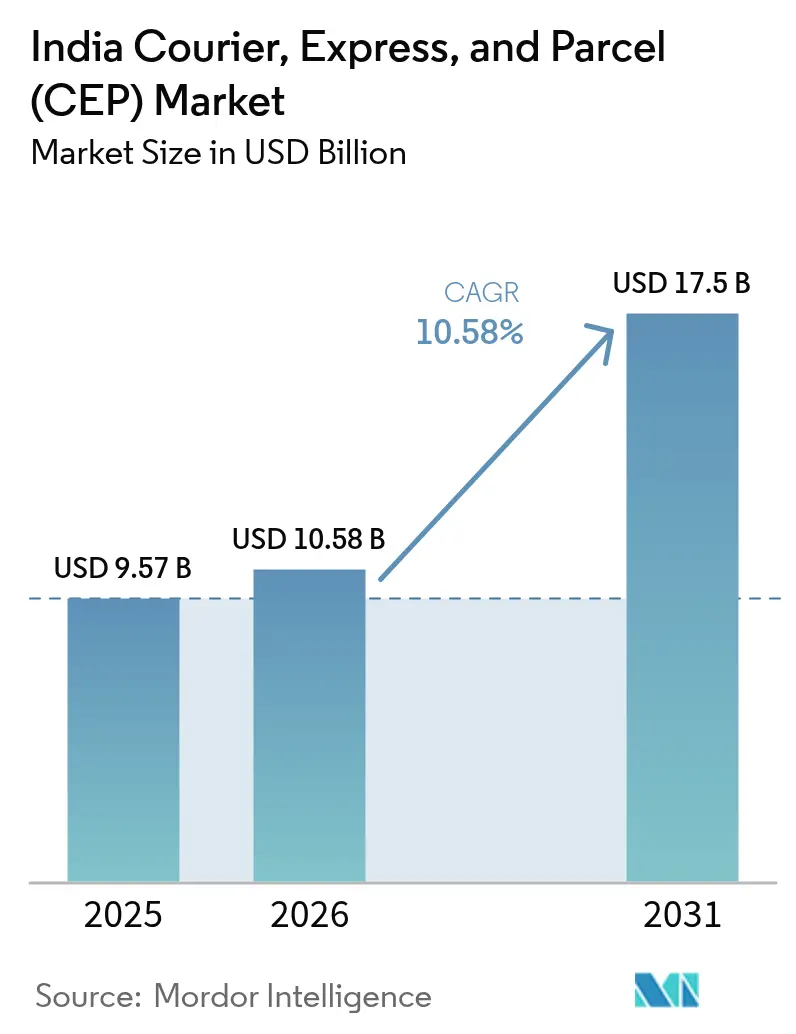
| Base Year Market Size (2025) | USD 9.57 Billion |
| Market Size (2026) | USD 10.58 Billion |
| Market Size (2031) | USD 17.5 Billion |
| Growth Rate (2026 - 2031) | 10.58% CAGR |
| Market Concentration | Medium |
Major Players
*Disclaimer: Major Players sorted in no particular order Image © Mordor Intelligence. Reuse requires attribution under CC BY 4.0. |
|
India Courier, Express, And Parcel (CEP) Market Analysis by Mordor Intelligence
The India courier, express, and parcel market size was valued at USD 9.57 billion in 2025 and estimated to grow from USD 10.58 billion in 2026 to reach USD 17.5 billion by 2031, at a CAGR of 10.58% during the forecast period (2026-2031). Rising e-commerce penetration, systematic infrastructure upgrades under the National Logistics Policy, and digital platforms such as the Open Network for Digital Commerce are the primary forces propelling growth. Domestic parcels account for nearly three-fifths of all volumes, yet international shipments expand more rapidly as micro-, small-, and medium-sized exporters leverage streamlined customs hubs. Express deliveries outpace non-express services because urban consumers now view one-day fulfillment as standard, while the government’s EV incentives and drone sandbox approvals promise cost efficiencies in the long run. Competitive intensity increases as incumbents modernize networks to keep pace with agile start-ups that deploy IoT tracking and electric two-wheelers in congested metros.
Key Report Takeaways
- By destination, domestic parcels commanded a 59.05% of the India courier, express, and parcel market share in 2025, whereas international shipments are forecast to grow at an 10.72% CAGR between 2026-2031.
- By delivery speed, non-express services held 54.35% of the India courier, express, and parcel market size in 2025, while express deliveries are advancing at an 11.02% CAGR between 2026 and 2031.
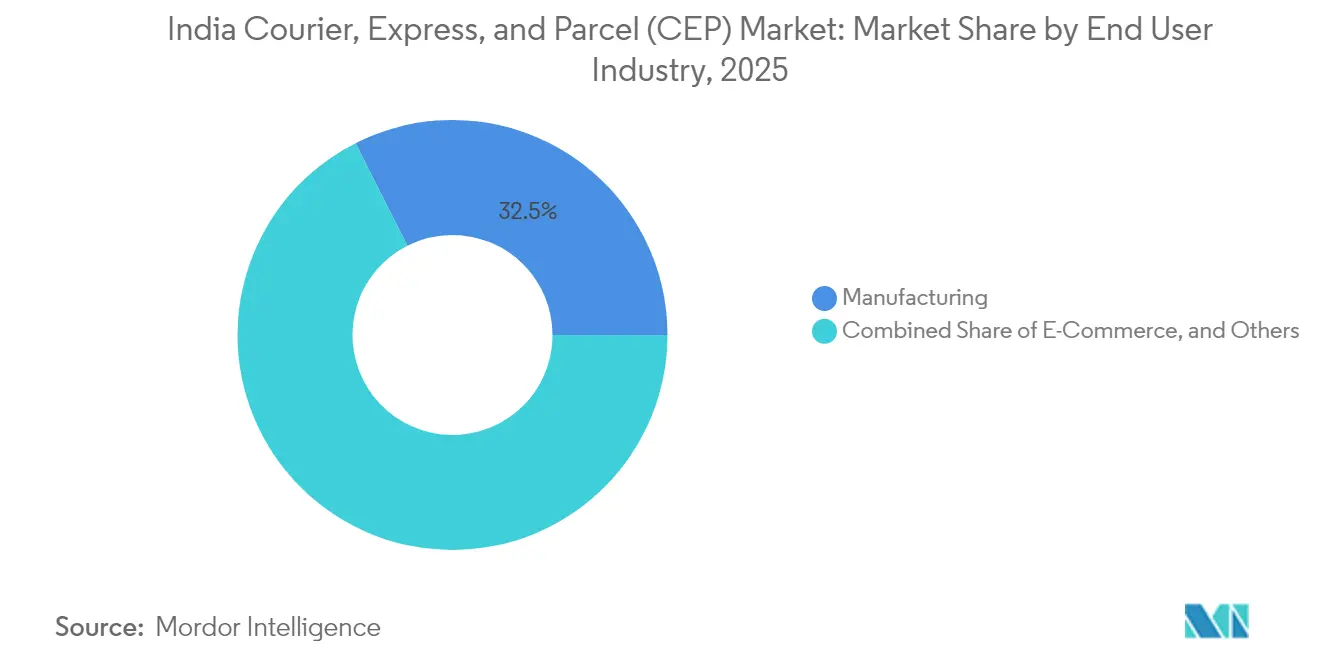
- By end user industry, manufacturing generated 32.45% of 2025 revenue, yet e-commerce logistics is projected to expand at an 11.32% CAGR between 2026-2031.
- By mode, road transport retained 56.10% of the revenue share in 2025, whereas air freight is growing at a 8.89% CAGR between 2026-2031.
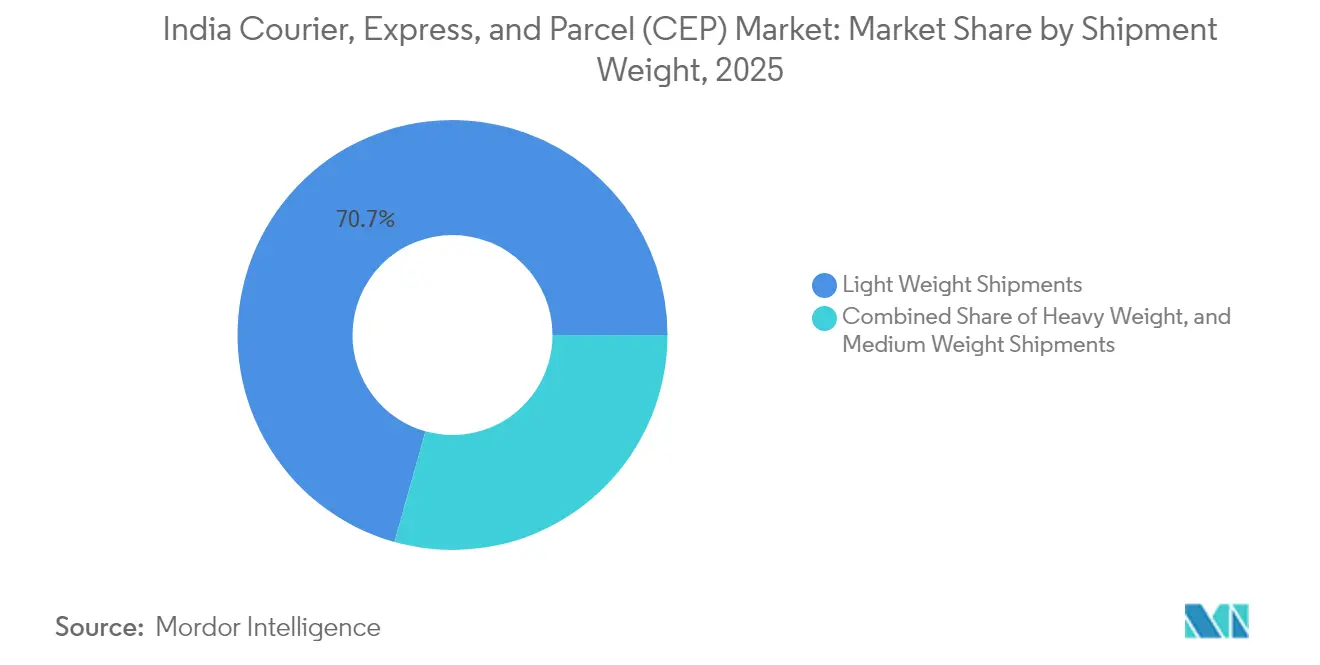
- By shipment weight, light weight parcels dominated with a 70.65% share in 2025, but medium-weight consignments are set to climb at an 7.78% CAGR between 2026-2031.
- By business model, business-to-consumer shipments led with 56.70% of the India courier, express, and parcel market size in 2025, while business-to-business logistics is gaining traction at a 5.18% CAGR between 2026-2031.
Note: Market size and forecast figures in this report are generated using Mordor Intelligence’s proprietary estimation framework, updated with the latest available data and insights as of 2026.
India Courier, Express, And Parcel (CEP) Market Trends and Insights
Drivers Impact Analysis*
| Driver | (≈) % Impact on CAGR Forecast | Geographic Relevance | Impact Timeline |
|---|---|---|---|
| E-commerce boom and hyperlocal Q-commerce expansion | +2.8% | Tier-1 cities with spillover to tier-2 | Short term (≤ 2 years) |
| National logistics policy driving cost efficiencies | +2.1% | Key freight corridors | Medium term (2-4 years) |
| Surge in cross-border MSME exports via ONDC and FTAs | +1.9% | Export hubs in Gujarat, Tamil Nadu, Maharashtra | Medium term (2-4 years) |
| Government push for EV fleets and green logistics | +1.4% | Major metros | Long term (≥ 4 years) |
| Drone and BVLOS regulatory sandbox approvals | +0.8% | Urban and remote pilot zones | Long term (≥ 4 years) |
| 5G-enabled IoT for real-time parcel visibility | +1.2% | National | Short term (≤ 2 years) |
| Source: Mordor Intelligence | |||


E-commerce Boom and Hyperlocal Q-commerce Expansion
Quick-commerce platforms have reduced delivery windows from 24 hours to as little as 10 minutes, prompting parcel companies to establish dark stores within a 3 kilometer radius of dense demand clusters. In February 2025 DTDC opened its first Bengaluru dark store to support 2-to-4-hour fulfillment, signaling a strategic swing from pure transport to inventory positioning. The India courier, express, and parcel market sees regional operators exploiting local real-estate knowledge to outmaneuver hub-and-spoke incumbents. Although working capital requirements rise as inventory shifts closer to shoppers, operators command premium pricing that offsets the cost of micro-fulfillment. The trend unlocks new revenue pools among direct-to-consumer brands seeking faster delivery to differentiate[1]“National Logistics Policy 2024 Overview,” Press Information Bureau, pib.gov.in.
National Logistics Policy Driving Cost Efficiencies
The PM Gati Shakti program integrates 16 ministries under one digital platform, trimming bureaucratic delays that once added several days to inter-city transit. Dedicated freight corridors now cut Delhi–Mumbai road haul times by up to 40%, improving asset utilization across the India courier, express, and parcel market. Unified Logistics Interface Platform data sharing lowers detention costs at checkpoints, while planned first-mile connectivity upgrades target the 40–50% cost share historically absorbed by urban pick-ups and drop-offs. Successful policy execution hinges on synchronized state participation because logistics sits on the concurrent list, but pilot corridors already demonstrate tangible savings[2]“Grade-A Supply Outlook 2025,” Warehousing Association of India, wwi.org.in.
Surge in Cross-Border MSME Exports via ONDC and FTAs
MSME exports tripled to INR 12.39 lakh crore (USD 149.3 billion) in 2024-25 after ONDC gave small sellers digital storefronts and simplified customs workflows. India’s first e-commerce export hub, slated to go live by March 2025, reduces clearance times from a week to two days, lifting international parcel revenues that are typically three to four times higher per kilogram than domestic consignments. As free-trade agreements lower tariffs, CEP operators with robust overseas networks capture disproportionate value within the India courier, express, and parcel market, though they must master diverse compliance regimes to retain competitiveness.
Government Push for EV Fleets and Green Logistics
The INR 10,900 crore (USD 1.30 billion) PM E-DRIVE scheme subsidizes electric vans and two-wheelers, enabling operators to hedge against diesel volatility and urban emission restrictions. Delhi’s 2030 mandate for fully electric commercial fleets accelerates early adoption across last-mile routes where stop-and-start driving favors battery economics. While charging gaps persist on long-haul lanes, OEM localization under production-linked incentives is moving unit costs downward. Companies that transition early expect fuel and maintenance savings within three years, reinforcing margin resilience across the India courier, express, and parcel market.
Restraints Impact Analysis*
| Restraint | (≈) % Impact on CAGR Forecast | Geographic Relevance | Impact Timeline |
|---|---|---|---|
| Fragmented warehousing and first-mile infrastructure | -1.6% | Tier-2 and tier-3 cities | Medium term (2-4 years) |
| Volatile diesel prices despite VAT cuts | -1.2% | National | Short term (≤ 2 years) |
| Supply-demand gap in skilled last-mile workforce | -0.9% | Major metros | Short term (≤ 2 years) |
| Crowded urban airspace delaying drone corridors | -0.7% | Dense city centers | Long term (≥ 4 years) |
| Source: Mordor Intelligence | |||
Fragmented Warehousing and First-Mile Infrastructure
More than 70% of Indian warehouses remain unorganized, limiting access to automation and cold-chain features fundamental to modern parcel handling. Grade-A capacity is rising but remains concentrated in tier-1 cities, forcing regional manufacturers to haul freight long distances before reaching organized networks. Hyperlocal models thus struggle to scale beyond metros because stock must sit within 3 kilometers of demand. For the India courier, express, and parcel market this fragmentation inflates first-mile costs and constrains time-critical categories such as fresh food or biologics[3]“Logistics Infrastructure Investment Program,” Government of Maharashtra, maha.gov.in.
Supply-Demand Gap in Skilled Last-Mile Workforce
An estimated deficit of 200,000 trained couriers emerged across top metros during 2024 peaks, pushing companies to hire temporary workers lacking protocol training. Wage inflation follows quick-commerce entrants that bid aggressively for riders, compressing sector margins. Traditional operators in the India courier, express, and parcel industry respond by launching rural recruitment schemes and certified training academies, yet onboarding cycles lag seasonal demand spikes, sustaining service variability[4]"Logistics sector faces shortage of skilled workers: Industry body." Business Standard, business-standard.com.
*Our forecasts treat driver/restraint impacts as directional, not additive. The impact forecasts reflect baseline growth, mix effects, and variable interactions.
Segment Analysis
By End-User Industry: E-commerce Outpaces Manufacturing
Manufacturing contributed 32.45% of 2025 demand, but e-commerce consignments grow the fastest at 11.32% CAGR (2026-2031), stimulated by government export ambitions of USD 200–300 billion by 2030.
Reverse logistics and high return rates complicate cost structures, yet the scale of online retail secures a pivotal role for parcel operators. The India courier, express, and parcel market therefore balances industrial bulk flows with agile consumer deliveries, requiring segmented networks to serve both profitably.


By Destination: Cross-Border Growth Accelerates
International parcels are on track to post an 10.72% CAGR between 2026-2031, even though domestic consignments held 59.05% of the India courier, express, and parcel market share in 2025. Amazon-enabled Indian sellers surpassed USD 13 billion in exports last year, validating the appeal of high-margin, low-weight cross-border traffic.
Premium revenue per kilogram and Gujarat-, Tamil Nadu-, and Maharashtra-based export clusters lure operators into building customs brokerage and reverse logistics capabilities. However, the India courier, express, and parcel market must still widen domestic reach into tier-2 cities, where organized networks remain thin and delivery windows lenient enough to offset infrastructure gaps.
By Speed of Delivery: Express Services Gain Momentum
Express consignments are rising at an 11.02% CAGR (2026-2031) and claim price premiums that cushion elevated operating costs. DTDC’s same-day Bengaluru roll-out illustrates how conventional networks pivot toward micro-fulfillment to stay relevant.
Non-express volumes remain dominant with a 54.35% share of revenue in 2025, due to price sensitivity outside tier-1 cities, but service expectations are climbing. Consequently, the India courier, express, and parcel market size tied to tracked, time-defined services is expanding faster than legacy bulk freight, forcing all operators to upgrade sortation tech and route planning algorithms.
By Shipment Weight: Medium Parcels Surge
Lightweight items kept a 70.65% hold on 2025 revenues, but medium-weight shipments lead growth at 7.78% CAGR (2026-2031). Allcargo Gati’s 24-hour air offer targets machinery spares and semi-finished parts that incur high downtime penalties.
Handling these mid-range weights requires upgraded conveyor belts and dynamic routing that prevent cross-contamination with fragile e-commerce packets, prompting infrastructure spending throughout the India courier, express, and parcel market.
By Mode of Transport: Air Freight Accelerates
Road retained 56.10% of the India courier, express, and parcel market size in 2025, yet air moves are accelerating at 8.89% CAGR (2026-2031) as exporters and premium e-tailers insist on 48-hour global reach.
Cargo-only aircraft orders and airport freighter bays are expanding, although fuel price swings may limit adoption among cost-sensitive segments. Drone corridors, once approved, could carve a new intra-city air layer, reinforcing the modal shift toward speed.
By Model: B2B Logistics Digitizes Rapidly
Business-to-consumer parcels represented 56.70% of the India courier, express, and parcel market in 2025, yet B2B shipments show a resilient 5.18% CAGR (2026-2031) as factories integrate digital ordering with delivery APIs.
Enterprise clients demand tighter SLAs and real-time visibility, creating space for tech-savvy providers. Smaller consumer-to-consumer flows also rise with social-commerce apps, adding volume diversity but posing margin management challenges across the India courier, express, and parcel industry.
Geography Analysis
Northern and western corridors together processed close to 60% of national parcel volumes in 2025, propelled by industrial bases in Delhi NCR, Gujarat, and Maharashtra. State incentives such as Maharashtra’s USD 600 million logistics plan aim to solidify the region as the hub of the India courier, express, and parcel market.
Southern states, especially Tamil Nadu and Karnataka, supply technology exports and automotive components that demand rapid logistics support. Bengaluru’s high digital maturity drives express uptake, whereas Chennai benefits from port-air multimodal connectivity. Eastern India remains under-served despite policy focus; limited grade-A warehousing and lower e-commerce penetration slow adoption.
Tier-2 and tier-3 cities now form the next battleground as ONDC’s 1,000-city footprint injects new volumes. Local firms leverage intimate route knowledge and flexible cost structures, yet national players hold an advantage in technology, EV fleets, and centralized control centers that enhance reliability across the India courier, express, and parcel market.
Competitive Landscape
The market is moderately consolidated; the top five operators account for a significant share of revenue, giving mid-tier specialists room to flourish. Incumbents such as Blue Dart and India Post rely on wide physical coverage, while Delhivery and Ecom Express harness data science for dynamic route planning. Delhivery’s USD 168 million purchase of Ecom Express in April 2025 highlights consolidation designed to unlock synergies in automation and last-mile density.
Technology defines differentiation: AI-assisted demand forecasting, IoT-enabled cold boxes, and blockchain-based customs clearance all reduce errors and boost on-time delivery. Simultaneously, sustainability pressures see fleets migrating to electric two-wheelers and CNG trucks, a transition accelerated by the PM E-DRIVE incentives.
Regulatory scrutiny intensifies as the Competition Commission probes potential price coordination among global integrators. Transparent tariff structures and compliance with data-sharing norms will shape competitive trust, especially as the India courier, express, and parcel market attracts overseas entrants seeking exposure to India’s fast-growing digital economy.
India Courier, Express, And Parcel (CEP) Industry Leaders
-
Blue Dart Express Limited
-
Delhivery Ltd.
-
DHL Group
-
Instakart Services Private Limited
-
DTDC Express
- *Disclaimer: Major Players sorted in no particular order

Recent Industry Developments
- June 2025: Allcargo Gati unveiled a 24-hour guaranteed air service tailored to medium-weight industrial consignments.
- April 2025: Delhivery agreed to acquire Ecom Express for INR 1,400 crore (USD 168 million) to deepen last-mile reach and unify technology stacks.
- February 2025: DTDC introduced 2-to-4-hour rapid commerce delivery and opened its first Bengaluru dark store focused on D2C merchants.
- January 2025: Blue Dart commissioned a 250,000 square-foot automated hub in Delhi to boost northern capacity and cut sorting times.


India Courier, Express, And Parcel (CEP) Market Report Scope
Domestic, International are covered as segments by Destination. Express, Non-Express are covered as segments by Speed Of Delivery. Business-to-Business (B2B), Business-to-Consumer (B2C), Consumer-to-Consumer (C2C) are covered as segments by Model. Heavy Weight Shipments, Light Weight Shipments, Medium Weight Shipments are covered as segments by Shipment Weight. Air, Road, Others are covered as segments by Mode Of Transport. E-Commerce, Financial Services (BFSI), Healthcare, Manufacturing, Primary Industry, Wholesale and Retail Trade (Offline), Others are covered as segments by End User Industry.
Destination
| Domestic |
| International |
Speed of Delivery
| Express |
| Non-Express |
Model
| Business-to-Business (B2B) |
| Business-to-Consumer (B2C) |
| Consumer-to-Consumer (C2C) |
Shipment Weight
| Heavy Weight Shipments |
| Light Weight Shipments |
| Medium Weight Shipments |
Mode of Transport
| Air |
| Road |
| Others |
End User Industry
| E-Commerce |
| Financial Services (BFSI) |
| Healthcare |
| Manufacturing |
| Primary Industry |
| Wholesale and Retail Trade (Offline) |
| Others |
| Destination | Domestic |
| International | |
| Speed of Delivery | Express |
| Non-Express | |
| Model | Business-to-Business (B2B) |
| Business-to-Consumer (B2C) | |
| Consumer-to-Consumer (C2C) | |
| Shipment Weight | Heavy Weight Shipments |
| Light Weight Shipments | |
| Medium Weight Shipments | |
| Mode of Transport | Air |
| Road | |
| Others | |
| End User Industry | E-Commerce |
| Financial Services (BFSI) | |
| Healthcare | |
| Manufacturing | |
| Primary Industry | |
| Wholesale and Retail Trade (Offline) | |
| Others |


Market Definition
- Courier, Express, and Parcel - The Courier, Express, and Parcel services, often called as CEP Market, refers to the logistics and postal service providers which specialize in moving small goods (parcels/packages). It captures the overall market size (USD) and market volume (number of parcels) of (1) the shipments/parcels/packages which are under 70kgs/ 154lbs weight, (2) Business Customer packages viz. Business-to-Business (B2B) & Business-to-Consumer (B2C) as well as private customer packages (C2C), (3) non-express parcel delivery services (Standard and Deferred) as well as express parcel delivery services (Day-Definite-Express and Time-Definite-Express), (4) domestic as well as international shipments.
- Demographics - To analyse total addressable market demand, population growth & forecasts have been studied and presented in this industry trend. It represents population distribution across categories like gender (male/female), development area (urban/rural), major cities among other key parameters like population density and final consumption expenditure (growth and share % of GDP). This data has been used for assessing the fluctations in demand & consumption expenditure, and the major hotspots (cities) of potential demand.
- Domestic Courier Market - Domestic Courier Market refers to the CEP shipments wherein the origin and destination is within the boundary of the geography studied (country or region as per the scope of report). It captures the market size (USD) and market volume (number of parcels) of (1) the shipments/parcels/packages which are under 70kgs/ 154lbs weight, including light weight shipments, medium weight shipments and heavy weight shipments (2) Business Customer packages viz. Business-to-Business (B2B) & Business-to-Consumer (B2C) as well as private customer packages (C2C), (3) non-express parcel delivery services (Standard and Deferred) as well as express parcel delivery services (Day-Definite-Express and Time-Definite-Express).
- E-Commerce - This end user industry segment captures the external (outsourced) logistics expenditure incurred by the e-tailers, through online sales channel, on Courier, Express, and Parcel (CEP) services. The scope includes (i) the supply chain of a company's online customer orders being fulfilled, (ii) the process of getting a product from the point of manufacturing to the point at which it is delivered to consumers. It involves managing inventory (deferred as well as time critical), shipping, and distribution.
- Export Trends and Import Trends - Overall logistics performance of an economy is positively and significantly (statistically) correlated to its trade performance (exports and imports). Hence, in this industry trend, total value of trade, major commodities/ commodity groups and the major trade partners, for the studied geography (country or region as per the scope of report) have been analysed alongside the impact of major trade/logistics infrastructure investments & regulatory environment.
- Financial Services (BFSI) - This end user industry segment captures the external (outsourced) logistics expenditure incurred by the BFSI players, on Courier, Express, and Parcel (CEP) services. CEP is important to the financial services industry in shipping of confidential documents and files. The establishments in this sector are engaged in (i) financial transactions (that is, transactions involving the creation, liquidation, or change in ownership of financial assets) or in facilitating financial transactions, (ii) financial intermediation, (iii) the pooling of risk by underwriting annuities and insurance, (iv) providing specialized services that facilitate or support financial intermediation, insurance and employee benefit programs, and (v) monetary control - the monetary authorities.
- Fuel Price - Fuel price spikes can cause delays and diruption for logistics service providers (LSPs), while drops in the same can result in higher short-term profitability and increased market rivalry to offer consumers with the best deals. Hence, the fuel price variations have been studied over the review period and presented along with the causes as well as market impacts.
- GDP Distribution by Economic Activity - Nominal Gross Domestic Product and distribution of the same, across major economic sectors in the geography studied (country or region as per scope of the report) have been studied and presented in this industry trend. As GDP is positively related to the profitability and growth of logistics industry, this data has been used in adjunction to the input-output tables/ supply-use tables for analyzing the potential major contributing sectors towards the logistics demand.
- GDP Growth by Economic Activity - Growth of Nominal Gross Domestic Product across major economic sectors, for the geography studied (country or region as per scope of the report) have been presented in this industry trend. This data has been utilized for assessing the growth of logistics demand from all the market end users (economic sectors considered here).
- Healthcare - This end user industry segment captures the external (outsourced) logistics expenditure incurred by the Healthcare players (Hospitals, clinics, mrdical centres) , on Courier, Express, and Parcel (CEP) services. The scope includes CEP services involved in the defrerred as well time critical movement of medical goods & supplies (surgical supplies and instruments, including gloves, masks, syringes, equipment). The establishments in this sector (i) include the ones providing medical care exclusively (ii) deliver services by trained professionals (iii) involve processes, including labor inputs of health practitioners with the requisite expertise (iv) are defined based on the educational degree held by the practitioners included in the industry.
- Inflation - Variations in both Wholesale Price Inflation (YoY change in producer price index) and Consumer Price Inflation have been presented in this industry trend. This data has been used to assess the inflationary environment as it plays a vital role in smooth functioning of the supply chain, directly impacting the logistics operational cost components e.g., pricing of tyres, driver wages & benefits, energy/fuel prices, maintenace costs, toll charges, warehousing rents, custom brokerage, forwarding rates, courier rates etc. hence impacting the overall freight and logistics market.
- Infrastructure - As infrastructure plays a vital role in an economy's logistics performance, variables like length of roads, distribution of road length by surface category (paved v/s unpaved), distribution of road length by road classification (expressways v/s highways v/s other roads), rail length, volume of containers handled by major ports and tonnage handled by major airports have been analysed and presented in this industry trend.
- International Express Service Market - International Express Service Market refers to the CEP shipments wherein the origin or destination is not within the boundary of the geography studied (country or region as per the scope of report). It captures the market size (USD) and market volume (number of parcels) of (1) the shipments/parcels/packages which are under 70kgs/ 154lbs weight, including light weight shipments, medium weight shipments and heavy weight shipments (ii) Inter-Region as well as Intra-Region Shipments
- Key Industry Trends - The report section named "Key Industry Trends" include all the key variables/parameters studied to better analyze the market size estimates and forecasts. All the trends have been presented in the form of data points (time series or latest available data points) along with analysis of the paramter in the form of concise market relevant commentary, for the geography studied (country or region as per the scope of report).
- Key Strategic Moves - The action taken by a company to differentiate from its competitor or used as a general strategy is referred to as a key strategic move (KSM). This includes (1) Agreements (2) Expansions (3) Financial Restructuring (4) Mergers and Acquisitions (5) Partnerships, and (6) Product Innovations. Key players (Logistics Service Providers, LSPs) in the market have been shortlisted, their KSM have been studied and presented in this section.
- Logistics Performance - Logistics Performance and Logistics Costs are the backbone of trade, and influences trade costs, making countries compete globally. Logistics performance is influenced by market wide adopted supply chain management strategies, government services, investments & policies, fuel/ energy costs, inflationary environment etc. Hence, in this industry trend, the logistics performance of the geography studied (country/ region as per the scope of report) has been analysed and presented over the review period.
- Manufacturing - This end user industry segment captures the external (outsourced) logistics expenditure incurred by the Manufacturing industry (including Hi-Tech/Technology) players, on Courier, Express, and Parcel (CEP) services. The end user players considered are the establishments primarily engaged in the chemical, mechanical or physical transformation of materials or substances into new products. Logistics Service Providers (LSPs) play a crucial role in maintaining a smooth flow of raw materials across the supply chain, enabling timely delivery of finished goods to distributors or end customers and storing & supplying the raw materials to clients for just-in-time manufacturing.
- Other End Users - Other end user segment captures the external (outsourced) logistics expenditure incurred by the construction, real estate, educational services, and professional services (administrative, waste management, legal, architectural, engineering, design, consulting, scientific R&D), on Courier, Express, and Parcel (CEP) services. Logistics Service Providers (LSPs) plays a crucial role in the reliable movement of time critical supplies and documents to/from these industries such as transporting any equipment or resources required, shipping confidential documents and files.
- Primary Industry - This end user industry segment captures the external (outsourced) logistics expenditure incurred by the AFF (Agriculture, Fishing, and Forestry) and Extraction indsutry (Oil &Gas, Quarrying and Mining) players, on Courier, Express, and Parcel (CEP) services. The end user players considered are the establishments (i) primarily engaged in growing crops, raising animals, harvesting timber, harvesting fish & other animals from their natural habitats and providing related support activities; (ii) that extract naturally occurring mineral solids, such as coal and ores; liquid minerals, such as crude petroleum; and gases, such as natural gas. Herein, Logistics Service Providers (LSPs) (i) play a crucial role in acquisition, storage, handling, transportation, and distribution activities for the optimal & continuous flow of inputs (seeds, pesticides, fertilizers, equipment, and water) from manufacturers or suppliers to the producers and smooth flow of output (produce, agro-goods) to distributors/ consumers; (ii) cover entire phases from upstream to downstream and play a crucial role in the transportation of machinery, drilling equipments, extracted minerals, crude oil & natural gas and refined/ processed products from one place to another. This includes both termperature controlled and non-temperature controlled logistics, as and when required according to the shelf life of goods being transported or stored.
- Producer Price Inflation - It indicates inflation from viewpoint of the producers viz. the average selling price received for their output over a period of time. Annual change (YoY) of producer price index is reported as wholesale price inflation in the "Inflation" industry trend. As WPI captures dynamic price movements in most comprehensive way, it is widely used by governments, banks, industry, business circles and is deemed important in formulation of trade, fiscal and other economic policies. The data has been used in adjunction to consumer price inflation for better understanding the inflationary environment.
- Segmental Revenue - Segmental Revenue has been triangulated or computed and presented for all the major players in the market. It refers to the courier, express, and parcel (CEP) market specific revenue earned by the company, over the base year of study, in the geography studied (country or region as per the scope of report). It is computed through the study and analysis of major parameters like financials, service portfolio, employee strength, fleet size, investments, number of countries present in, major economies of concern, etc. that have been reported by the company in its annual reports, webpage. For companies having scarce financial disclosures, paid databases like D&B Hoovers, Dow Jones Factiva have been resorted to and verified through industry/expert interactions.
- Transport and Storage Sector GDP - Value and growth of Transport and Storage Sector GDP has a direct relation to the freight and logistics market size. Hence, this variable has been studied and presented over the review period, in value terms (USD) and as share % of total GDP, in this industry trend. The data has been supported by concise and relevant commentary around the investments, developments, and current market scenario.
- Trends in E-Commerce Industry - Enhanced internet connectivity and boom in smartphone penetration, coupled with increasing disposable incomes, has led to a phenomenal growth in the e-commerce market globally. Online shoppers require fast and efficient delivery of their orders leading to an increase in the demand for logistics services especially e-commerce fulfilment services. Hence, the Gross Merchandise Value (GMV), historial and projected growth, breakup of major commodity groups in e-commerce industry for the studied geography (country or region as per scope of the report) have been analysed and presented in this industry trend.
- Trends in Manufacturing Industry - Manufacturing industry involves the transformation of raw materials into finished products, while logistics industry ensures the efficient flow of raw materials to the factory, and the transport of manufactured products to the distributors & consumers. Demand-Supply of both industries are highly cross-linked and critical for a seamless supply chain. Hence, the Gross Value Added (GVA), breakup of GVA into major manufacturing sectors, and growth of manufacturing industry over the review period have been analysed and presented, in this industry trend.
- Wholesale and Retail Trade (Offline) - This end user industry segment captures the external (outsourced) logistics expenditure incurred by the wholesalers and retailers, through offline sales channel, on Courier, Express, and Parcel (CEP) services. The end user players considered are the establishments primarily engaged in wholesaling or retailing merchandise, generally without transformation, and rendering services incidental to the sale of merchandise. Logistics Service Providers (LSPs) plays a crucial role in the reliable movement of supplies to and finished products from production houses to the distributors and finally to the end customer covering activites like material sourcing, transportation, order fulfillment, warehousing & storage, demand forecasting, inventory management etc.
| Keyword | Definition |
|---|---|
| Axle Load | The axle load refers to the total load (weight) bearing on the roadway through wheels connected to a given axle. Across the globe, there are systems in place to ensure axle load monitoring, wherein surpassing the defined limits set by the concerned regulatory authority can lead to penalty/fine. For transportation of goods via road this can be an important determinant of costs as knowledge about the axle load limits can be used to (i) load the vehicle optimally for maximizing profits (ii) avoid exceeding the same and hence the probable fines associated (iii) avoid wear and tear of the vehicle (iv) avoid damage to pavement resulting in noticeable public maintenance and repair costs (v) achieve better turnaround time. |
| Back Haul | Backhaul is the return movement of a transport vehicle from its original destination to its original point of departure, and can include full, partial, or empty truck loads (all or part of the way) depending on the visibility of the local freight ecosystem. In this regard, transportation of empty containers to the point of origin, known as deadheading is also a significant factor, considering the supply/container shortages across the geographies, resulting in cost escalation and under optimized profit potential attainment. Generally, the carriers offer discounts on the backhaul, to secure freight for the trip. |
| Bill of Lading (BOL) | A bill of lading is a legal contract document issued by a carrier to a shipper to acknowledge reception of their cargo, and is evidence for the contract of carriage between the two parties. Broadly it details the (i) type, quantity, and other specifications of the goods being carried (ii) destination, and terms & conditions of the shipment (iii) carrier and drivers with all the necessary information to process the shipment, which can be used for insurance and customs clearance purposes (iv) assurance that the consignment is damage-free and ready to be shipped to the consignee. In this regard, a house bill of lading (HBL) is a document issued by a freight forwarder or a non-vessel operating common carrier (NVOCC) to acknowledge receipt of items for shipment (to a shipper). If shipments from several shippers are involved a master bill of lading (MBL) might be involved which is a consolidated version of the same for all the shipments being taken care of by the carrier (to a common destination) and might be issued by the carrier to the freight forwarder or the shipper (depending on who books the transport). |
| Bunkering | Bunkering is the process of supplying fuel to power the propulsion system of a ship. It includes the logistics of loading and distributing the fuel among available shipboard tanks. In this regard, (i) Bunker fuel is technically any type of fuel oil used aboard ships. It gets its name from the containers on ships and in ports that it is stored in; in the days of steam they were coal bunkers but now they are bunker-fuel tanks, (ii) Bunker refers to the spaces (Tank) on board a vessel to store fuel, (iii) Bunker trader refers to a person dealing in trade of bunker (fuel), (iv) Bunker call is made when a cargo ship anchors or berths in a port to take on bunker oil or supplies, (v) Bunkering service is the supply of a requested quality and quantity of bunkers to a ship. Bunkering is signficant from point of view of freight rates applicable to the shipper as Bunker Contribution (BUC)/ Fuel Adjustment Factor (FAF)/ Bunker Adjustment Factor (BAF) are applied by shipping lines to offset the effect of fluctuations in the cost of bunkers. |
| Cabotage | Transport by a vehicle registered in a country, performed on the national territory of another country. Cabotage law may restrict domestic cargo traffic to be carried in its own nationally registered, and sometimes built and crewed vehicles, though regulations vary across industries/commodity groups/countries and sometimes specify maximum allowable percentage of cabotage that can be serviced by foreign registered fleet. |
| C-commerce | Collaborative commerce (also known as C-commerce), (i) describes electronically enabled business interactions among an enterprise’s internal personnel, business partners and customers throughout a trading community (industry, industry segment, supply chain or supply chain segment); (ii) is the optimization of supply and distribution channels to capitalize on the global economy by using new technology efficiently. Advantages of C-commerce, to detail few include (i) maximization of organization's efficiency and profitability (ii) technology integration with physical channels to allow companies to work together (iii) increased information exchange such as inventory and product specifications, using the web as an intermediary (iv) increased competitiveness by reaching a broader audience. Examples of C-commerce, also known as peer-to-peer commerce, include (i) companies that allow consumers to rent things from each other, or marketplaces, such as Meta (formerly Facebook) Marketplace, that allow the sale of used goods; (ii) DoorDash teamed up with many national brands, such as McDonald’s and Chipotle, to offer fast food delivery, building their business model on c-commerce. They have since expanded their delivery service from restaurants to retailers and even offer 'fleets' of drivers to businesses. |
| Courier | A business/company that delivers packages/parcels/shipments (upto 70 kgs) including quick door to door pickup and delivery service for goods or documents, domestically or internationally, on a commercial contract basis. Example, DHL Group, FedEx, United Parcel Service of America, Inc., USPS, International Distributions Services, J&T Express, SF Express among several others |
| Cross docking | Cross docking is a practice in logistics management that includes unloading incoming delivery vehicles and loading the materials directly into outbound delivery vehicles, omitting traditional warehouse logistical practices and saving time and money. It requires close synchronization of both inbound and outbound movements. It is highly significant in reduction of costs pertaining to warehousing & storage (and the associated Value Added Services). |
| Cross Trade | International transport between two different countries performed by a vehicle registered in a third country. A third country is a country other than the country of loading/embarkation and the country of unloading/disembarkation. Cross Trade law may restrict international cargo traffic to be carried by respective country's registered vehicles, and sometimes built and crewed vehicles, though regulations vary across industries/commodity groups/countries and sometimes specify maximum allowable percentage of cross trade that can be serviced by foreign registered fleet. |
| Customs Clearance | The process of declaring and clearing cargoes through customs. It includes the procedures involved in getting cargo released by Customs through designated formalities such as presenting import license/permit, payment of import duties and other required documentations by the nature of the cargo. In this regard, a customs broker is a person or company licensed by the respective department of the country to act on behalf of freight importers and exporters. |
| Dangerous Goods | Dangerous goods (or hazardous materials or HAZMAT) include flammable liquids/solids, gases (compressed, liquified, dissolved under pressure), corrosives, oxidising substances, explosive substances and articles, substances which on contact with water emit flammable gasses, organic peroxides, toxic substances, infectious substances, radioactive materials, miscellaneous dangerous goods and articles. |
| First mile Delivery | First mile delivery refers to the (i) first stage of the freight/shipment/cargo/courier transportation (ii) the transportation of goods from a merchant’s premises or warehouse to the next fulfillment centre/warehouse/hub from where the goods are forwarded (iii) shipping goods from local distribution centers to stores (For retailers) (iv) transportation of finished goods from a plant or a factory to a distribution center (For manufacturers), (v) pick up of goods from the end-customer’s home or store followed by movement to a warehouse or storage location (movers and packers), (vi) process where goods are picked up from a retailer and then transferred to third-party logistics providers or courier service providers to be delivered to the end-consumer (e-commerce). Once the package reaches the next warehouse or the courier’s hub, it is then sorted and transported further until it reaches the customer’s doorstep. Example, if one chooses UPS as a courier, first-mile delivery will be the product being delivered from manufacturer's/retailer's warehouse to the UPS’s warehouse/ fulfilment centre. |
| Last Mile Delivery | Last mile delivery refers to the very last step of the delivery process when a parcel is moved from a transportation hub (warehouse or a distribution center or fulfillment centre) to its final destination, which usually is a personal residence/retail store/ business, or parcel locker. It accounts for around half of the total cost involved in entire process of first mile, middle mile, and last mile delivery, though it can vary shipment to shipment, based on commodity, business model and similar factors. |
| Milkrun | A Milk Run is a delivery method used to transport mixed loads from various suppliers to one customer, using lean management principles applied to logistics. Instead of each supplier sending a truck every week to meet the needs of one customer, one truck (or vehicle) visits the suppliers to pick up the loads for that customer. This method of transport got its name from the dairy industry practice, where one tanker used to collect milk from several dairy farms for delivery to a milk processing company. A milk run can be a more efficient way to handle logistics but require proper planning. If the route involves products from different companies, there is need for an agreement about cost-sharing and other aspects of the cooperative delivery arrangement. Once the group settles these issues, this delivery method can save time and money for everyone by pooling operation costs and resources. |
| Multi country consolidation | Multi-Country Consolidation (MCC) is a cost-effective solution that consolidates one's cargo from different countries of origin to build Full Container Loads (FCL). MCC is most suitable for companies that import light volumes of goods from multiple countries but want to take advantage of the more economic FCL freight rates. Apart from costing some of the other advantages include (i) flexibility to choose suppliers from a wider range of origin countries without worrying about the logistics to final destination from each origin, (ii) ability to pick the most suitable suppliers from many different countries for one's business operations. The increase in one's sourcing options by MCC provides the kind of flexibility needed in competitive global markets. |
| Q-commerce | Q-commerce, also referred to as quick commerce, is a type of e-commerce where emphasis is on quick deliveries, typically in less than an hour. The companies providing Q-Commerce services might have vertically intergrated model or might be using third party delivery platforms (outsourced logistics). It has advantages like (i) competitve USP, (ii) potential to earn greater profit margins, (iii) better customer experience, (iv) guaranteed availability of products, (v) traceability, and (vi) scaleability. |
| ReverseLogistics | Reverse logistics is a type of supply chain management that moves goods from customers back to the sellers or manufacturers and may involve ciruclar economy principles (3Rs) viz. recycling, reuse (repurposing, reselling), reducing or repairing. In this regard, reverse commerce (or Recommerce) is the selling of previously owned items through physical or online marketplaces/distribution channels to buyers who reuse, recycle or resell them. |


Research Methodology
Mordor Intelligence follows a four-step methodology in all our reports.
- Step-1: Identify Key Variables: In order to build a robust forecasting methodology, the variables and factors identified in Step-1 are tested against available historical market numbers. Through an iterative process, the variables required for market forecast are set and the model is built on the basis of these variables.
- Step-2: Build a Market Model: Market-size estimations for the forecast years are in nominal terms. Inflation is considered to be a part of the pricing, and the average selling price (ASP) is varying throughout the forecast period for each country
- Step-3: Validate and Finalize: In this important step, all market numbers, variables and analyst calls are validated through an extensive network of primary research experts from the market studied. The respondents are selected across levels and functions to generate a holistic picture of the market studied.
- Step-4: Research Outputs: Syndicated Reports, Custom Consulting Assignments, Databases & Subscription Platforms


