Market Overview
| Study Period | 2020 - 2031 |
|---|---|
| Forecast Data Period | 2026 - 2031 |
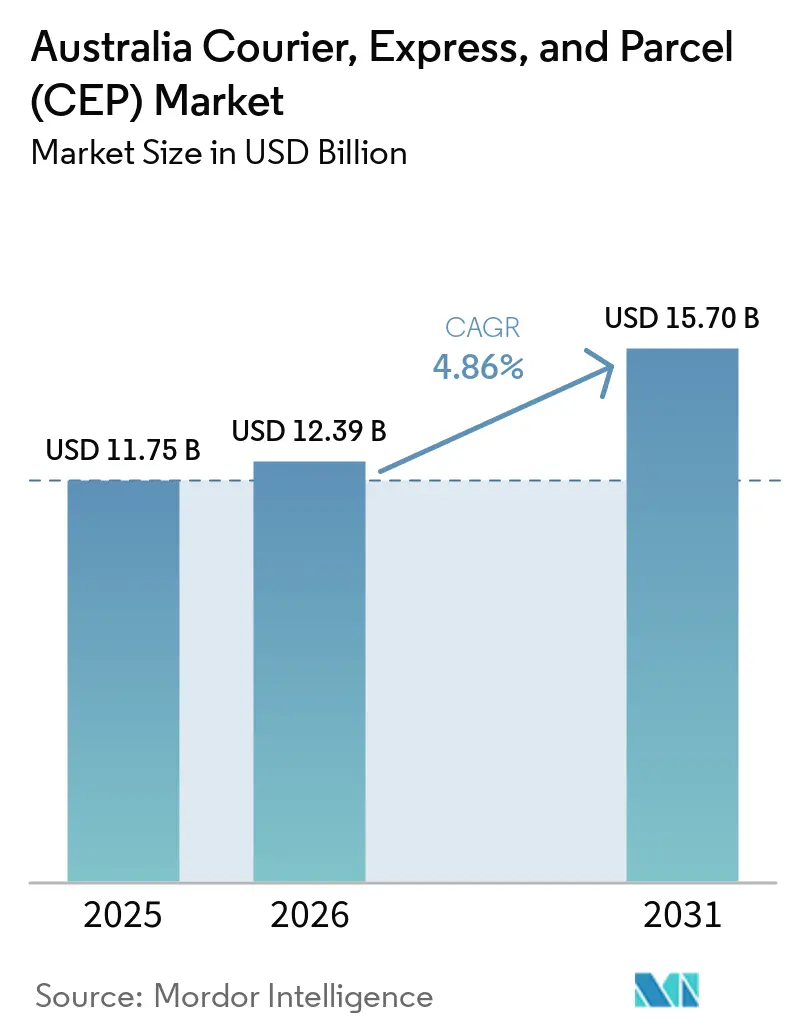
| Base Year Market Size (2025) | USD 11.75 Billion |
| Market Size (2026) | USD 12.39 Billion |
| Market Size (2031) | USD 15.70 Billion |
| Growth Rate (2026 - 2031) | 4.86% CAGR |
| Market Concentration | High |
Major Players *Disclaimer: Major Players sorted in no particular order Image © Mordor Intelligence. Reuse requires attribution under CC BY 4.0. | |
Australia Courier, Express, and Parcel (CEP) Market Analysis by Mordor Intelligence
The Australia courier, express, and parcel (CEP) market size is expected to increase from USD 11.75 billion in 2025 to USD 12.39 billion in 2026 and reach USD 15.70 billion by 2031, growing at a 4.86% CAGR over 2026-2031. Steady headline growth conceals a realignment of parcel flows as wholesale B2B marketplaces fragment bulk freight into higher-frequency shipments, while federal and state infrastructure programs compress line-haul transit windows. Road continues to handle the largest share of parcels, yet air freight is gaining as healthcare cold-chain and time-definite services command price premiums. Domestic volumes dominate overall activity, although faster growth in international flows signals rising cross-border e-commerce participation. Competitive pressure intensifies around sustainability and cybersecurity investments, with operators racing to electrify fleets, harden IT systems, and secure first-mover advantage in rural drone corridors.
Key Report Takeaways
- By mode of transport, road held 41.90% of the Australia courier, express, and parcel (CEP) market share in 2025, while air freight is projected to expand at a 5.35% CAGR through 2031.
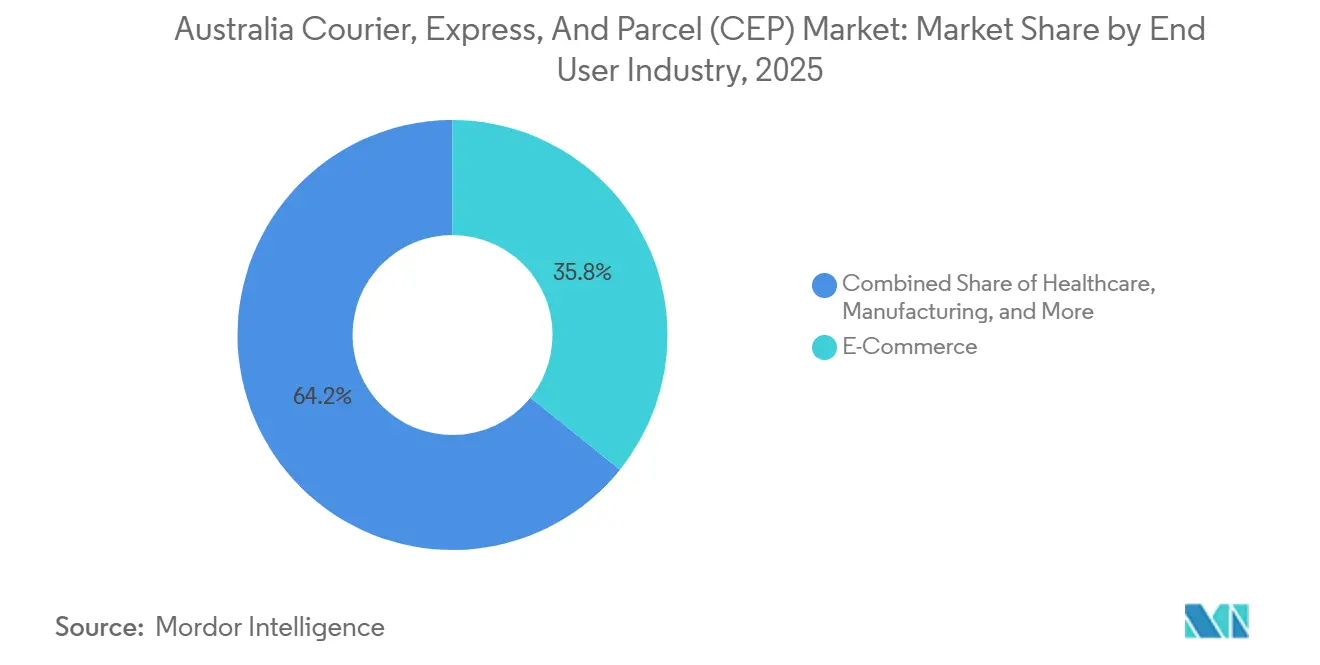
- By end user industry, e-commerce led with 35.78% revenue share in 2025, healthcare logistics is forecast to advance at a 5.28% CAGR to 2031.
- By destination, domestic parcels accounted for 62.90% of the Australia courier, express, and parcel market (CEP) size in 2025, and international volumes are growing at a 5.02% CAGR over 2026-2031.
- By model, C2C shipments registered the fastest expansion at a 6.84% CAGR between 2026-2031, challenging B2C’s 47.09% share.
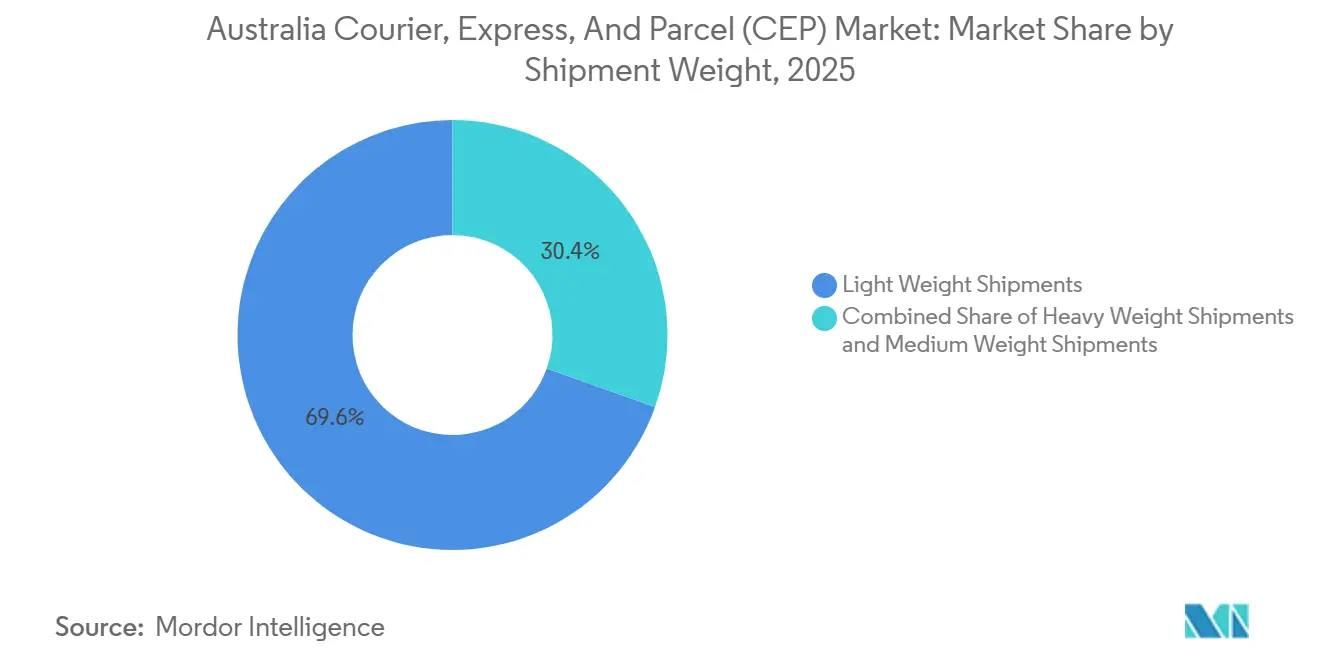
- By shipment weight, light-weight shipments accounted for 69.56% of the Australia courier, express, and parcel (CEP) market share in 2025, while medium-weight shipments are projected to grow at a 4-5% CAGR through 2031.
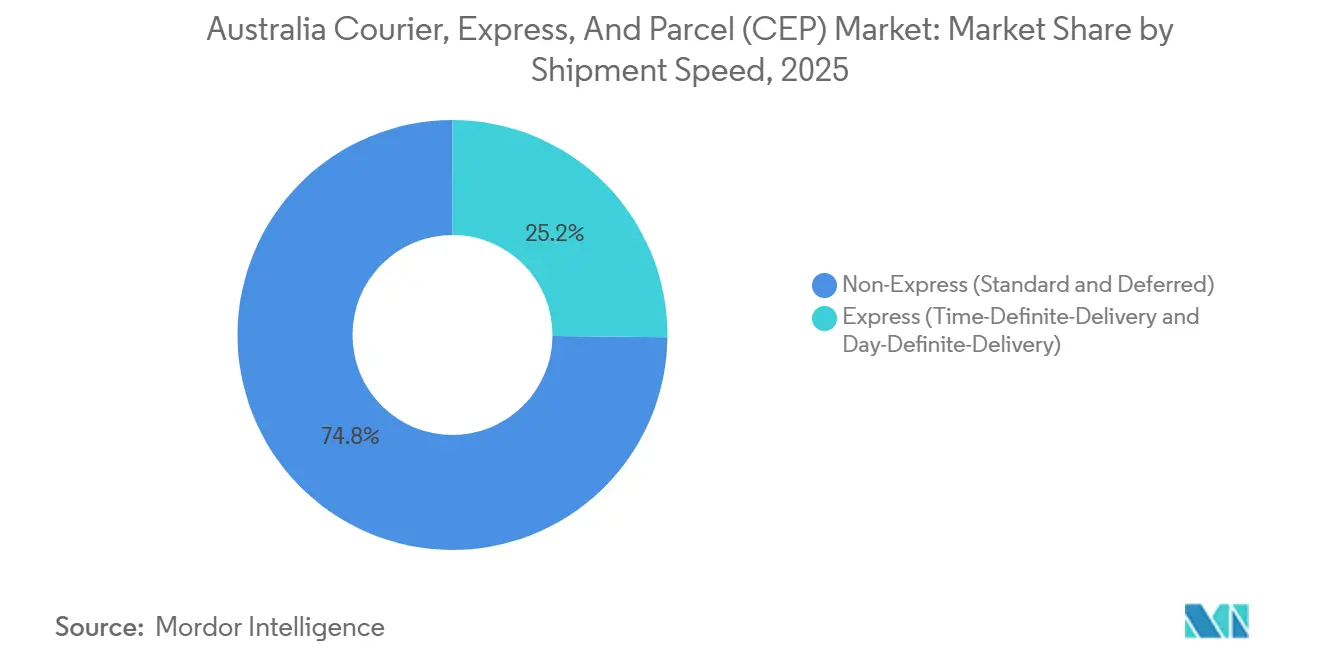
- By shipment speed, non-express shipments held 74.84% of the Australia courier, express, and parcel (CEP) market share in 2025, whereas express shipments are expected to expand at a 5-6% CAGR through 2031.
Note: Market size and forecast figures in this report are generated using Mordor Intelligence’s proprietary estimation framework, updated with the latest available data and insights as of 2026.
Australia Courier, Express, and Parcel (CEP) Market Trends and Insights
Drivers Impact Analysis*
| Driver | (~) % Impact on CAGR Forecast | Geographic Relevance | Impact Timeline |
|---|---|---|---|
| Wholesale e-commerce marketplaces are accelerating B2B parcel volumes | 0.7% | National, with concentration in Sydney, Melbourne, and industrial corridors | Medium term (2-4 years) |
| Federal "Inland Rail" & state road-upgrade pipeline shrinking inter-capital transit times | 0.6% | Melbourne-Brisbane corridor, with spillover to Sydney-Adelaide routes | Long term (≥ 4 years) |
| Healthcare cold-chain demand (pharma, biologics, specialty foods) is boosting premium express lanes | 0.5% | Metropolitan areas with hospital clusters and pharmaceutical distribution hubs | Short term (≤ 2 years) |
| Subscription-commerce boom driving predictable recurring parcel flows | 0.4% | Urban centers with high household density and digital penetration | Medium term (2-4 years) |
| CASA-approved BVLOS drone corridors enabling rural last-mile delivery pilots | 0.3% | Regional Queensland, NSW, with expansion to the remote Northern Territory | Long term (≥ 4 years) |
| Mandated carbon-reporting rules (Climate-related Financial Disclosure Bill 2025), elevating low-emission delivery procurement | 0.4% | National, with early adoption by ASX-listed retailers and government procurement | Medium term (2-4 years) |
| Source: Mordor Intelligence | |||


Wholesale E-Commerce Marketplaces Accelerating B2B Parcel Volumes
Digital wholesale platforms allow small retailers and hospitality venues to order inventory in carton-level lots that move through parcel networks rather than pallets. Parcel counts, therefore, climb even when overall tonnage is flat, forcing CEP operators to redesign sorting layouts around higher stop density and smaller average weights. The Australian Bureau of Statistics recorded AUD 82.3 billion (USD 54.7 billion) of wholesale turnover in Q4 2024, with australia ecommerce digital channels expanding fastest. As manufacturers adopt these platforms to cut working capital, next-day service levels once confined to B2C now apply to B2B, creating a durable uplift in express demand[1].
Federal Inland Rail & State Road-Upgrade Pipeline Shrinking Inter-Capital Transit Times
The 1,700 km Melbourne-Brisbane Inland Rail, scheduled for completion in 2027, is expected to cut up to 10 hours off line-haul journeys. Combined with state highway upgrades, the program enables double-stacked containers and smoother freight flows that rebalance cost-to-speed equations in medium and heavy parcel tiers. Providers can shift some traffic from overnight air to high-speed rail, widening service offerings without compromising delivery windows, while regional merchants gain parity with capital-city peers[2]Australian Rail Track Corporation, “Inland Rail,” inlandrail.artc.com.au.
Healthcare Cold-Chain Demand Boosting Premium Express Lanes
UPS Healthcare’s 2024 investment added 22,000 m² of temperature-controlled capacity in Australia and Singapore to serve biologics, gene therapies, and high-value seafood. Cold-chain parcels travel in insulated packaging with real-time monitoring, tolerating minimal delays. Regulatory oversight from the Therapeutic Goods Administration favors established CEP firms with validated processes, creating high-margin lanes that justify dedicated air uplift and late-night sort operations.
Subscription-Commerce Boom Driving Predictable Recurring Parcel Flows
Meal kits, pet supplies, and personal-care subscriptions generate fixed delivery cadences that enhance network load planning. Operators negotiate long-term contracts with predictable pickup volumes, allowing tighter driver scheduling and higher drop densities. Retailers treat delivery performance as integral to customer lifetime value, awarding multi-year deals to carriers that meet on-time metrics and sustainability targets. Predictability reduces per-parcel cost, sustaining profitability even as base rates face deflationary pressure.
Restraints Impact Analysis*
| Restraint | (~) % Impact on CAGR Forecast | Geographic Relevance | Impact Timeline |
|---|---|---|---|
| Tighter bio-security screening at gateways is adding dwell-time and cost for inbound parcels | -0.4% | International gateway airports and seaports (Sydney, Melbourne, Brisbane) | Short term (≤ 2 years) |
| Chronic driver shortfall as heavy-vehicle workforce ages and visa caps persist | -0.5% | National, with acute pressure in metropolitan areas and regional routes | Medium term (2-4 years) |
| Escalating cybersecurity breaches are eroding consumer trust in parcel-tracking platforms | -0.3% | National, with a higher impact in urban e-commerce segments | Short term (≤ 2 years) |
| Rising insurance premiums for high-capacity EV delivery fleets due to battery-fire risk profile | -0.2% | Metropolitan areas with EV fleet concentration | Medium term (2-4 years) |
| Source: Mordor Intelligence | |||
Tighter Biosecurity Screening at Gateways
The Department of Agriculture escalated parcel inspections after prohibited plant material detections, adding 24-72 hours to clearance for flagged items. Extra storage fees and staffing costs erode margins on cross-border e-commerce consignments, while customers downgrade service ratings when promised delivery dates slip. CEP firms must budget for X-ray upgrades and staff accreditation to maintain compliance[3]Department of Agriculture, “Biosecurity Requirements,” agriculture.gov.au.
Chronic Driver Shortfall as Workforce Ages
NatRoad estimates a shortage of 26,000 heavy-vehicle drivers, with a median age above 50 years. Wage inflation outpaces general labor costs, and visa caps restrict access to overseas talent. Capacity tightness peaks during holiday surges, compelling networks to cap volumes or pay costly overtime. Investment in route-optimization software and automation only partially offsets the human-resource deficit.
*Our forecasts treat driver/restraint impacts as directional, not additive. The impact forecasts reflect baseline growth, mix effects, and variable interactions.
Segment Analysis
By End User: E-Commerce Extends Lead While Healthcare Gains Momentum
E-commerce accounted for 35.78% of Australia courier, express, and parcel (CEP) market share in 2025 and is forecast to grow at 5.30% CAGR, ensuring the Australia courier, express, and parcel market size continues to tilt toward direct-to-consumer fulfillment. Re-platformed grocery, auto-parts, and DIY categories lift average parcel weight, steering investment toward mixed-weight sortation lines.
Stable demand from manufacturing, wholesale, and BFSI segments provides baseline volume that tempers peak-season volatility. Subscription models in personal care and pet supplies reinforce recurring flows, helping carriers amortize fixed network costs. The Australia courier, express, and parcel (CEP) market share for e-commerce is therefore likely to stay above one-third through 2031 even as other verticals accelerate.


By Destination: International Parcels Rise From a Smaller Base
Domestic services held 62.90% share of the Australia courier, express, and parcel (CEP) market size in 2025, anchored by dense metro corridors where stop consolidation drives low unit cost. International services, though smaller in absolute terms, are growing at a 5.02% CAGR as SMEs embrace global marketplaces. Enhanced customs pre-clearance and duty-paid solutions compress end-to-end transit, yet strict biosecurity checks prolong dwell times at Sydney and Melbourne gateways.
Currency shifts also influence flows: a weaker AUD stimulates exports but elevates the landed cost of imports. Carriers hedge exposure by pricing fuel and security surcharges in AUD while settling international line-haul in USD equivalents. The divergent growth paths keep domestic revenues dominant but elevate international services as a strategic growth pillar.
By Model: C2C Platforms Challenge B2C Dominance
B2C deliveries represented 47.09% of the Australia courier, express, and parcel (CEP) market size in 2025, yet C2C consignments are climbing fastest at a 6.84% CAGR as social-commerce apps mainstream second-hand trading. The informal nature of C2C packaging drives higher loss and damage ratios, prompting carriers to roll out low-cost protective satchels and in-app pickup booking.
B2B volumes, reshaped by wholesale marketplaces, increasingly mirror B2C frequency but maintain higher average weight. Hybrid offerings now bundle pallet break-down, pick-pack, and parcel distribution for SMEs, blurring traditional model lines while retaining distinct billing structures.
By Shipment Weight: Light Parcels Still Rule, but Medium Class Accelerates
Shipments ≤5 kg delivered 69.56% of the Australia courier, express, and parcel (CEP) market share in 2025, reflecting dominance of fashion, electronics, and books. However, medium parcels between 5 kg and 31.5 kg are forecast to grow 5.35% CAGR as flat-pack furniture and home-gym equipment move into direct-ship models. The Australia courier, express, and parcel (CEP) market size for medium parcels will benefit from Inland Rail’s double-stack capability, reducing long-haul road reliance.
Automation favors light-weight handling, yet carriers invest in semi-automatic tilt-tray sorters that handle cartons up to 25 kg to support channel mix shifts. Dimensional-weight billing incentivizes merchants to shrink-pack orders, but bulky items still drive revenue growth out of proportion to their shipment count.
By Shipment Speed: Express Services Capture Premium Demand
Non-express services controlled 74.84% of Australia courier, express, and parcel (CEP) market share in 2025, but express lanes are expanding at 5.56% CAGR, stimulated by cold-chain pharmaceuticals and urgent replacement parts. Same-day metropolitan delivery is now table stakes for major e-retailers, leading carriers to open twilight sort cycles and micro-hubs inside city limits.
Express yields run 40-60% above standard, offsetting higher fixed costs from dedicated line-haul and priority sortation. The Australia courier, express, and parcel (CEP) market share for express could edge toward 30% by 2031 if service adoption in groceries and health accelerates.
By Mode of Transport: Road Dominates While Air Gains on High-Value Segments
Road held 41.90% of the Australia courier, express, and parcel (CEP) market share in 2025 thanks to door-to-door flexibility and expanding freeway networks. Air traffic is growing 5.35% CAGR, with UPS adding Shenzhen-Sydney uplifts that trim Asia Pacific lead times by two days. Air’s premium is justified for biologics, electronics launches, and time-critical auto parts, although Inland Rail may divert some medium-weight consignments to rail once operational.
Sustainability reporting nudges shippers toward lower-carbon modes, but the total cost of service remains paramount. Road electrification pilots in Melbourne and Brisbane test economic feasibility under rising insurance premiums tied to battery-fire risk[4]Civil Aviation Safety Authority, “RPAS BVLOS Approvals,” casa.gov.au.
Geography Analysis
Domestic parcel density is heaviest along the east-coast urban spine linking Brisbane, Sydney, and Melbourne, where 70% of Australians reside. These cities host mega-sort centers capable of processing 30,000 parcels per hour, enabling sub-USD 4 urban delivery economics and underpinning network profitability.
Regional towns benefit from the Inland Rail program and state road upgrades that shorten truck lead times by up to 15%, encouraging e-retailers to extend next-day guarantees beyond capitals. CASA’s BVLOS approvals allow Wing Aviation to trial 10-minute drone flights in low-density Queensland communities, reducing last-mile cost in zones where van routes average fewer than five drops per hour.
International flows cluster at Sydney Kingsford Smith, Melbourne Tullamarine, and Brisbane airports, each equipped with on-airport x-ray and bonded facilities sized for 20% annual parcel growth. Biosecurity inspection constraints present the chief bottleneck, adding 24-72 hours for flagged consignments and raising storage charges that carriers must absorb or pass through to customers. Despite these hurdles, cross-border demand from New Zealand, the United States, and the UK is resilient, buoyed by platform-enabled SME exports and consumer thirst for imported fashion and electronics.
Competitive Landscape
Australia Post remains the largest single operator, especially in standard parcel and regional delivery, yet its share slipped below 35% as DHL, FedEx, UPS, and Aramex gained in international express. December 2024 saw Singapore Post exit through a USD 516.2 million sale of CouriersPlease and Border Express to Pacific Equity Partners, signaling portfolio realignment among foreign incumbents.
Leading players differentiate through technology: AI route engines cut urban van mileage by 12-15%, while blockchain-verified carbon accounting wins enterprise tenders subject to Climate-related Financial Disclosure rules. Cyber resilience has become table stakes after the 2024 BHF Couriers breach prompted industry-wide penetration-testing and multifactor authentication rollouts.
Niche specialists thrive in cold-chain, subscription-commerce, and C2C micro-fulfillment. Sendle markets carbon-neutral delivery to SMEs, while StarTrack leverages Australia Post’s network for high-capacity interstate line-haul. Moderate concentration combined with high regulatory compliance costs favors operators able to scale sustainability, security, and automation investments across diverse revenue streams.
Australia Courier, Express, and Parcel (CEP) Industry Leaders
Australia Post Group
Toll Group
DHL Express
FedEx
CouriersPlease (SingPost)
- *Disclaimer: Major Players sorted in no particular order

Recent Industry Developments
- May 2026: FedEx Australia signed a three-year services agreement with Locate Technologies’ Locate2u platform. The deal will support driver onboarding, compliance, contractor payments, and delivery management across a phased rollout for part of FedEx Australia’s national fleet.
- April 2026: Australia Post opened its largest air and speed hub at Brisbane Airport in April 2026, adding a major new parcel-processing site to its national network. The 78,000 m² facility can handle up to 250,000 parcels a day and uses direct airside access to speed up deliveries across Queensland and beyond.
- February 2026: Toll Group and Asahi Beverages launched five electric rigid trucks in Perth as part of Toll’s next phase of its heavy EV program. The fleet will handle more than 36,000 beverage deliveries a year from Asahi’s Forrestfield center, while replacing diesel trucks and cutting about 140 tons of CO₂ emissions annually.
- January 2025: Telstra partnered with Starlink for direct-to-device satellite services targeting rural connectivity gaps.


Australia Courier, Express, and Parcel (CEP) Market Report Scope
Destination
| Domestic |
| International |
Speed of Delivery
| Express |
| Non-Express |
Model
| Business-to-Business (B2B) |
| Business-to-Consumer (B2C) |
| Consumer-to-Consumer (C2C) |
Shipment Weight
| Heavy Weight Shipments |
| Light Weight Shipments |
| Medium Weight Shipments |
Mode of Transport
| Air |
| Road |
| Others |
End User Industry
| E-Commerce |
| Financial Services (BFSI) |
| Healthcare |
| Manufacturing |
| Primary Industry |
| Wholesale and Retail Trade (Offline) |
| Others |
| Destination | Domestic |
| International | |
| Speed of Delivery | Express |
| Non-Express | |
| Model | Business-to-Business (B2B) |
| Business-to-Consumer (B2C) | |
| Consumer-to-Consumer (C2C) | |
| Shipment Weight | Heavy Weight Shipments |
| Light Weight Shipments | |
| Medium Weight Shipments | |
| Mode of Transport | Air |
| Road | |
| Others | |
| End User Industry | E-Commerce |
| Financial Services (BFSI) | |
| Healthcare | |
| Manufacturing | |
| Primary Industry | |
| Wholesale and Retail Trade (Offline) | |
| Others |


Market Definition
- Courier, Express, and Parcel - The Courier, Express, and Parcel services, often called as CEP Market, refers to the logistics and postal service providers which specialize in moving small goods (parcels/packages). It captures the overall market size (USD) and market volume (number of parcels) of (1) the shipments/parcels/packages which are under 70kgs/ 154lbs weight, (2) Business Customer packages viz. Business-to-Business (B2B) & Business-to-Consumer (B2C) as well as private customer packages (C2C), (3) non-express parcel delivery services (Standard and Deferred) as well as express parcel delivery services (Day-Definite-Express and Time-Definite-Express), (4) domestic as well as international shipments.
- Demographics - To analyse total addressable market demand, population growth & forecasts have been studied and presented in this industry trend. It represents population distribution across categories like gender (male/female), development area (urban/rural), major cities among other key parameters like population density and final consumption expenditure (growth and share % of GDP). This data has been used for assessing the fluctations in demand & consumption expenditure, and the major hotspots (cities) of potential demand.
- Domestic Courier Market - Domestic Courier Market refers to the CEP shipments wherein the origin and destination is within the boundary of the geography studied (country or region as per the scope of report). It captures the market size (USD) and market volume (number of parcels) of (1) the shipments/parcels/packages which are under 70kgs/ 154lbs weight, including light weight shipments, medium weight shipments and heavy weight shipments (2) Business Customer packages viz. Business-to-Business (B2B) & Business-to-Consumer (B2C) as well as private customer packages (C2C), (3) non-express parcel delivery services (Standard and Deferred) as well as express parcel delivery services (Day-Definite-Express and Time-Definite-Express).
- E-Commerce - This end user industry segment captures the external (outsourced) logistics expenditure incurred by the e-tailers, through online sales channel, on Courier, Express, and Parcel (CEP) services. The scope includes (i) the supply chain of a company's online customer orders being fulfilled, (ii) the process of getting a product from the point of manufacturing to the point at which it is delivered to consumers. It involves managing inventory (deferred as well as time critical), shipping, and distribution.
- Export Trends and Import Trends - Overall logistics performance of an economy is positively and significantly (statistically) correlated to its trade performance (exports and imports). Hence, in this industry trend, total value of trade, major commodities/ commodity groups and the major trade partners, for the studied geography (country or region as per the scope of report) have been analysed alongside the impact of major trade/logistics infrastructure investments & regulatory environment.
- Financial Services (BFSI) - This end user industry segment captures the external (outsourced) logistics expenditure incurred by the BFSI players, on Courier, Express, and Parcel (CEP) services. CEP is important to the financial services industry in shipping of confidential documents and files. The establishments in this sector are engaged in (i) financial transactions (that is, transactions involving the creation, liquidation, or change in ownership of financial assets) or in facilitating financial transactions, (ii) financial intermediation, (iii) the pooling of risk by underwriting annuities and insurance, (iv) providing specialized services that facilitate or support financial intermediation, insurance and employee benefit programs, and (v) monetary control - the monetary authorities.
- Fuel Price - Fuel price spikes can cause delays and diruption for logistics service providers (LSPs), while drops in the same can result in higher short-term profitability and increased market rivalry to offer consumers with the best deals. Hence, the fuel price variations have been studied over the review period and presented along with the causes as well as market impacts.
- GDP Distribution by Economic Activity - Nominal Gross Domestic Product and distribution of the same, across major economic sectors in the geography studied (country or region as per scope of the report) have been studied and presented in this industry trend. As GDP is positively related to the profitability and growth of logistics industry, this data has been used in adjunction to the input-output tables/ supply-use tables for analyzing the potential major contributing sectors towards the logistics demand.
- GDP Growth by Economic Activity - Growth of Nominal Gross Domestic Product across major economic sectors, for the geography studied (country or region as per scope of the report) have been presented in this industry trend. This data has been utilized for assessing the growth of logistics demand from all the market end users (economic sectors considered here).
- Healthcare - This end user industry segment captures the external (outsourced) logistics expenditure incurred by the Healthcare players (Hospitals, clinics, mrdical centres) , on Courier, Express, and Parcel (CEP) services. The scope includes CEP services involved in the defrerred as well time critical movement of medical goods & supplies (surgical supplies and instruments, including gloves, masks, syringes, equipment). The establishments in this sector (i) include the ones providing medical care exclusively (ii) deliver services by trained professionals (iii) involve processes, including labor inputs of health practitioners with the requisite expertise (iv) are defined based on the educational degree held by the practitioners included in the industry.
- Inflation - Variations in both Wholesale Price Inflation (YoY change in producer price index) and Consumer Price Inflation have been presented in this industry trend. This data has been used to assess the inflationary environment as it plays a vital role in smooth functioning of the supply chain, directly impacting the logistics operational cost components e.g., pricing of tyres, driver wages & benefits, energy/fuel prices, maintenace costs, toll charges, warehousing rents, custom brokerage, forwarding rates, courier rates etc. hence impacting the overall freight and logistics market.
- Infrastructure - As infrastructure plays a vital role in an economy's logistics performance, variables like length of roads, distribution of road length by surface category (paved v/s unpaved), distribution of road length by road classification (expressways v/s highways v/s other roads), rail length, volume of containers handled by major ports and tonnage handled by major airports have been analysed and presented in this industry trend.
- International Express Service Market - International Express Service Market refers to the CEP shipments wherein the origin or destination is not within the boundary of the geography studied (country or region as per the scope of report). It captures the market size (USD) and market volume (number of parcels) of (1) the shipments/parcels/packages which are under 70kgs/ 154lbs weight, including light weight shipments, medium weight shipments and heavy weight shipments (ii) Inter-Region as well as Intra-Region Shipments
- Key Industry Trends - The report section named "Key Industry Trends" include all the key variables/parameters studied to better analyze the market size estimates and forecasts. All the trends have been presented in the form of data points (time series or latest available data points) along with analysis of the paramter in the form of concise market relevant commentary, for the geography studied (country or region as per the scope of report).
- Key Strategic Moves - The action taken by a company to differentiate from its competitor or used as a general strategy is referred to as a key strategic move (KSM). This includes (1) Agreements (2) Expansions (3) Financial Restructuring (4) Mergers and Acquisitions (5) Partnerships, and (6) Product Innovations. Key players (Logistics Service Providers, LSPs) in the market have been shortlisted, their KSM have been studied and presented in this section.
- Logistics Performance - Logistics Performance and Logistics Costs are the backbone of trade, and influences trade costs, making countries compete globally. Logistics performance is influenced by market wide adopted supply chain management strategies, government services, investments & policies, fuel/ energy costs, inflationary environment etc. Hence, in this industry trend, the logistics performance of the geography studied (country/ region as per the scope of report) has been analysed and presented over the review period.
- Manufacturing - This end user industry segment captures the external (outsourced) logistics expenditure incurred by the Manufacturing industry (including Hi-Tech/Technology) players, on Courier, Express, and Parcel (CEP) services. The end user players considered are the establishments primarily engaged in the chemical, mechanical or physical transformation of materials or substances into new products. Logistics Service Providers (LSPs) play a crucial role in maintaining a smooth flow of raw materials across the supply chain, enabling timely delivery of finished goods to distributors or end customers and storing & supplying the raw materials to clients for just-in-time manufacturing.
- Other End Users - Other end user segment captures the external (outsourced) logistics expenditure incurred by the construction, real estate, educational services, and professional services (administrative, waste management, legal, architectural, engineering, design, consulting, scientific R&D), on Courier, Express, and Parcel (CEP) services. Logistics Service Providers (LSPs) plays a crucial role in the reliable movement of time critical supplies and documents to/from these industries such as transporting any equipment or resources required, shipping confidential documents and files.
- Primary Industry - This end user industry segment captures the external (outsourced) logistics expenditure incurred by the AFF (Agriculture, Fishing, and Forestry) and Extraction indsutry (Oil &Gas, Quarrying and Mining) players, on Courier, Express, and Parcel (CEP) services. The end user players considered are the establishments (i) primarily engaged in growing crops, raising animals, harvesting timber, harvesting fish & other animals from their natural habitats and providing related support activities; (ii) that extract naturally occurring mineral solids, such as coal and ores; liquid minerals, such as crude petroleum; and gases, such as natural gas. Herein, Logistics Service Providers (LSPs) (i) play a crucial role in acquisition, storage, handling, transportation, and distribution activities for the optimal & continuous flow of inputs (seeds, pesticides, fertilizers, equipment, and water) from manufacturers or suppliers to the producers and smooth flow of output (produce, agro-goods) to distributors/ consumers; (ii) cover entire phases from upstream to downstream and play a crucial role in the transportation of machinery, drilling equipments, extracted minerals, crude oil & natural gas and refined/ processed products from one place to another. This includes both termperature controlled and non-temperature controlled logistics, as and when required according to the shelf life of goods being transported or stored.
- Producer Price Inflation - It indicates inflation from viewpoint of the producers viz. the average selling price received for their output over a period of time. Annual change (YoY) of producer price index is reported as wholesale price inflation in the "Inflation" industry trend. As WPI captures dynamic price movements in most comprehensive way, it is widely used by governments, banks, industry, business circles and is deemed important in formulation of trade, fiscal and other economic policies. The data has been used in adjunction to consumer price inflation for better understanding the inflationary environment.
- Segmental Revenue - Segmental Revenue has been triangulated or computed and presented for all the major players in the market. It refers to the courier, express, and parcel (CEP) market specific revenue earned by the company, over the base year of study, in the geography studied (country or region as per the scope of report). It is computed through the study and analysis of major parameters like financials, service portfolio, employee strength, fleet size, investments, number of countries present in, major economies of concern, etc. that have been reported by the company in its annual reports, webpage. For companies having scarce financial disclosures, paid databases like D&B Hoovers, Dow Jones Factiva have been resorted to and verified through industry/expert interactions.
- Transport and Storage Sector GDP - Value and growth of Transport and Storage Sector GDP has a direct relation to the freight and logistics market size. Hence, this variable has been studied and presented over the review period, in value terms (USD) and as share % of total GDP, in this industry trend. The data has been supported by concise and relevant commentary around the investments, developments, and current market scenario.
- Trends in E-Commerce Industry - Enhanced internet connectivity and boom in smartphone penetration, coupled with increasing disposable incomes, has led to a phenomenal growth in the e-commerce market globally. Online shoppers require fast and efficient delivery of their orders leading to an increase in the demand for logistics services especially e-commerce fulfilment services. Hence, the Gross Merchandise Value (GMV), historial and projected growth, breakup of major commodity groups in e-commerce industry for the studied geography (country or region as per scope of the report) have been analysed and presented in this industry trend.
- Trends in Manufacturing Industry - Manufacturing industry involves the transformation of raw materials into finished products, while logistics industry ensures the efficient flow of raw materials to the factory, and the transport of manufactured products to the distributors & consumers. Demand-Supply of both industries are highly cross-linked and critical for a seamless supply chain. Hence, the Gross Value Added (GVA), breakup of GVA into major manufacturing sectors, and growth of manufacturing industry over the review period have been analysed and presented, in this industry trend.
- Wholesale and Retail Trade (Offline) - This end user industry segment captures the external (outsourced) logistics expenditure incurred by the wholesalers and retailers, through offline sales channel, on Courier, Express, and Parcel (CEP) services. The end user players considered are the establishments primarily engaged in wholesaling or retailing merchandise, generally without transformation, and rendering services incidental to the sale of merchandise. Logistics Service Providers (LSPs) plays a crucial role in the reliable movement of supplies to and finished products from production houses to the distributors and finally to the end customer covering activites like material sourcing, transportation, order fulfillment, warehousing & storage, demand forecasting, inventory management etc.
| Keyword | Definition |
|---|---|
| Axle Load | The axle load refers to the total load (weight) bearing on the roadway through wheels connected to a given axle. Across the globe, there are systems in place to ensure axle load monitoring, wherein surpassing the defined limits set by the concerned regulatory authority can lead to penalty/fine. For transportation of goods via road this can be an important determinant of costs as knowledge about the axle load limits can be used to (i) load the vehicle optimally for maximizing profits (ii) avoid exceeding the same and hence the probable fines associated (iii) avoid wear and tear of the vehicle (iv) avoid damage to pavement resulting in noticeable public maintenance and repair costs (v) achieve better turnaround time. |
| Back Haul | Backhaul is the return movement of a transport vehicle from its original destination to its original point of departure, and can include full, partial, or empty truck loads (all or part of the way) depending on the visibility of the local freight ecosystem. In this regard, transportation of empty containers to the point of origin, known as deadheading is also a significant factor, considering the supply/container shortages across the geographies, resulting in cost escalation and under optimized profit potential attainment. Generally, the carriers offer discounts on the backhaul, to secure freight for the trip. |
| Bill of Lading (BOL) | A bill of lading is a legal contract document issued by a carrier to a shipper to acknowledge reception of their cargo, and is evidence for the contract of carriage between the two parties. Broadly it details the (i) type, quantity, and other specifications of the goods being carried (ii) destination, and terms & conditions of the shipment (iii) carrier and drivers with all the necessary information to process the shipment, which can be used for insurance and customs clearance purposes (iv) assurance that the consignment is damage-free and ready to be shipped to the consignee. In this regard, a house bill of lading (HBL) is a document issued by a freight forwarder or a non-vessel operating common carrier (NVOCC) to acknowledge receipt of items for shipment (to a shipper). If shipments from several shippers are involved a master bill of lading (MBL) might be involved which is a consolidated version of the same for all the shipments being taken care of by the carrier (to a common destination) and might be issued by the carrier to the freight forwarder or the shipper (depending on who books the transport). |
| Bunkering | Bunkering is the process of supplying fuel to power the propulsion system of a ship. It includes the logistics of loading and distributing the fuel among available shipboard tanks. In this regard, (i) Bunker fuel is technically any type of fuel oil used aboard ships. It gets its name from the containers on ships and in ports that it is stored in; in the days of steam they were coal bunkers but now they are bunker-fuel tanks, (ii) Bunker refers to the spaces (Tank) on board a vessel to store fuel, (iii) Bunker trader refers to a person dealing in trade of bunker (fuel), (iv) Bunker call is made when a cargo ship anchors or berths in a port to take on bunker oil or supplies, (v) Bunkering service is the supply of a requested quality and quantity of bunkers to a ship. Bunkering is signficant from point of view of freight rates applicable to the shipper as Bunker Contribution (BUC)/ Fuel Adjustment Factor (FAF)/ Bunker Adjustment Factor (BAF) are applied by shipping lines to offset the effect of fluctuations in the cost of bunkers. |
| Cabotage | Transport by a vehicle registered in a country, performed on the national territory of another country. Cabotage law may restrict domestic cargo traffic to be carried in its own nationally registered, and sometimes built and crewed vehicles, though regulations vary across industries/commodity groups/countries and sometimes specify maximum allowable percentage of cabotage that can be serviced by foreign registered fleet. |
| C-commerce | Collaborative commerce (also known as C-commerce), (i) describes electronically enabled business interactions among an enterprise’s internal personnel, business partners and customers throughout a trading community (industry, industry segment, supply chain or supply chain segment); (ii) is the optimization of supply and distribution channels to capitalize on the global economy by using new technology efficiently. Advantages of C-commerce, to detail few include (i) maximization of organization's efficiency and profitability (ii) technology integration with physical channels to allow companies to work together (iii) increased information exchange such as inventory and product specifications, using the web as an intermediary (iv) increased competitiveness by reaching a broader audience. Examples of C-commerce, also known as peer-to-peer commerce, include (i) companies that allow consumers to rent things from each other, or marketplaces, such as Meta (formerly Facebook) Marketplace, that allow the sale of used goods; (ii) DoorDash teamed up with many national brands, such as McDonald’s and Chipotle, to offer fast food delivery, building their business model on c-commerce. They have since expanded their delivery service from restaurants to retailers and even offer 'fleets' of drivers to businesses. |
| Courier | A business/company that delivers packages/parcels/shipments (upto 70 kgs) including quick door to door pickup and delivery service for goods or documents, domestically or internationally, on a commercial contract basis. Example, DHL Group, FedEx, United Parcel Service of America, Inc., USPS, International Distributions Services, J&T Express, SF Express among several others |
| Cross docking | Cross docking is a practice in logistics management that includes unloading incoming delivery vehicles and loading the materials directly into outbound delivery vehicles, omitting traditional warehouse logistical practices and saving time and money. It requires close synchronization of both inbound and outbound movements. It is highly significant in reduction of costs pertaining to warehousing & storage (and the associated Value Added Services). |
| Cross Trade | International transport between two different countries performed by a vehicle registered in a third country. A third country is a country other than the country of loading/embarkation and the country of unloading/disembarkation. Cross Trade law may restrict international cargo traffic to be carried by respective country's registered vehicles, and sometimes built and crewed vehicles, though regulations vary across industries/commodity groups/countries and sometimes specify maximum allowable percentage of cross trade that can be serviced by foreign registered fleet. |
| Customs Clearance | The process of declaring and clearing cargoes through customs. It includes the procedures involved in getting cargo released by Customs through designated formalities such as presenting import license/permit, payment of import duties and other required documentations by the nature of the cargo. In this regard, a customs broker is a person or company licensed by the respective department of the country to act on behalf of freight importers and exporters. |
| Dangerous Goods | Dangerous goods (or hazardous materials or HAZMAT) include flammable liquids/solids, gases (compressed, liquified, dissolved under pressure), corrosives, oxidising substances, explosive substances and articles, substances which on contact with water emit flammable gasses, organic peroxides, toxic substances, infectious substances, radioactive materials, miscellaneous dangerous goods and articles. |
| First mile Delivery | First mile delivery refers to the (i) first stage of the freight/shipment/cargo/courier transportation (ii) the transportation of goods from a merchant’s premises or warehouse to the next fulfillment centre/warehouse/hub from where the goods are forwarded (iii) shipping goods from local distribution centers to stores (For retailers) (iv) transportation of finished goods from a plant or a factory to a distribution center (For manufacturers), (v) pick up of goods from the end-customer’s home or store followed by movement to a warehouse or storage location (movers and packers), (vi) process where goods are picked up from a retailer and then transferred to third-party logistics providers or courier service providers to be delivered to the end-consumer (e-commerce). Once the package reaches the next warehouse or the courier’s hub, it is then sorted and transported further until it reaches the customer’s doorstep. Example, if one chooses UPS as a courier, first-mile delivery will be the product being delivered from manufacturer's/retailer's warehouse to the UPS’s warehouse/ fulfilment centre. |
| Last Mile Delivery | Last mile delivery refers to the very last step of the delivery process when a parcel is moved from a transportation hub (warehouse or a distribution center or fulfillment centre) to its final destination, which usually is a personal residence/retail store/ business, or parcel locker. It accounts for around half of the total cost involved in entire process of first mile, middle mile, and last mile delivery, though it can vary shipment to shipment, based on commodity, business model and similar factors. |
| Milkrun | A Milk Run is a delivery method used to transport mixed loads from various suppliers to one customer, using lean management principles applied to logistics. Instead of each supplier sending a truck every week to meet the needs of one customer, one truck (or vehicle) visits the suppliers to pick up the loads for that customer. This method of transport got its name from the dairy industry practice, where one tanker used to collect milk from several dairy farms for delivery to a milk processing company. A milk run can be a more efficient way to handle logistics but require proper planning. If the route involves products from different companies, there is need for an agreement about cost-sharing and other aspects of the cooperative delivery arrangement. Once the group settles these issues, this delivery method can save time and money for everyone by pooling operation costs and resources. |
| Multi country consolidation | Multi-Country Consolidation (MCC) is a cost-effective solution that consolidates one's cargo from different countries of origin to build Full Container Loads (FCL). MCC is most suitable for companies that import light volumes of goods from multiple countries but want to take advantage of the more economic FCL freight rates. Apart from costing some of the other advantages include (i) flexibility to choose suppliers from a wider range of origin countries without worrying about the logistics to final destination from each origin, (ii) ability to pick the most suitable suppliers from many different countries for one's business operations. The increase in one's sourcing options by MCC provides the kind of flexibility needed in competitive global markets. |
| Q-commerce | Q-commerce, also referred to as quick commerce, is a type of e-commerce where emphasis is on quick deliveries, typically in less than an hour. The companies providing Q-Commerce services might have vertically intergrated model or might be using third party delivery platforms (outsourced logistics). It has advantages like (i) competitve USP, (ii) potential to earn greater profit margins, (iii) better customer experience, (iv) guaranteed availability of products, (v) traceability, and (vi) scaleability. |
| ReverseLogistics | Reverse logistics is a type of supply chain management that moves goods from customers back to the sellers or manufacturers and may involve ciruclar economy principles (3Rs) viz. recycling, reuse (repurposing, reselling), reducing or repairing. In this regard, reverse commerce (or Recommerce) is the selling of previously owned items through physical or online marketplaces/distribution channels to buyers who reuse, recycle or resell them. |


Research Methodology
Mordor Intelligence follows a four-step methodology in all our reports.
- Step-1: Identify Key Variables: In order to build a robust forecasting methodology, the variables and factors identified in Step-1 are tested against available historical market numbers. Through an iterative process, the variables required for market forecast are set and the model is built on the basis of these variables.
- Step-2: Build a Market Model: Market-size estimations for the forecast years are in nominal terms. Inflation is considered to be a part of the pricing, and the average selling price (ASP) is varying throughout the forecast period for each country
- Step-3: Validate and Finalize: In this important step, all market numbers, variables and analyst calls are validated through an extensive network of primary research experts from the market studied. The respondents are selected across levels and functions to generate a holistic picture of the market studied.
- Step-4: Research Outputs: Syndicated Reports, Custom Consulting Assignments, Databases & Subscription Platforms


