New York Data Center Market Size and Share
Market Overview
| Study Period | 2019 - 2031 |
|---|---|
| Forecast Data Period | 2025 - 2031 |
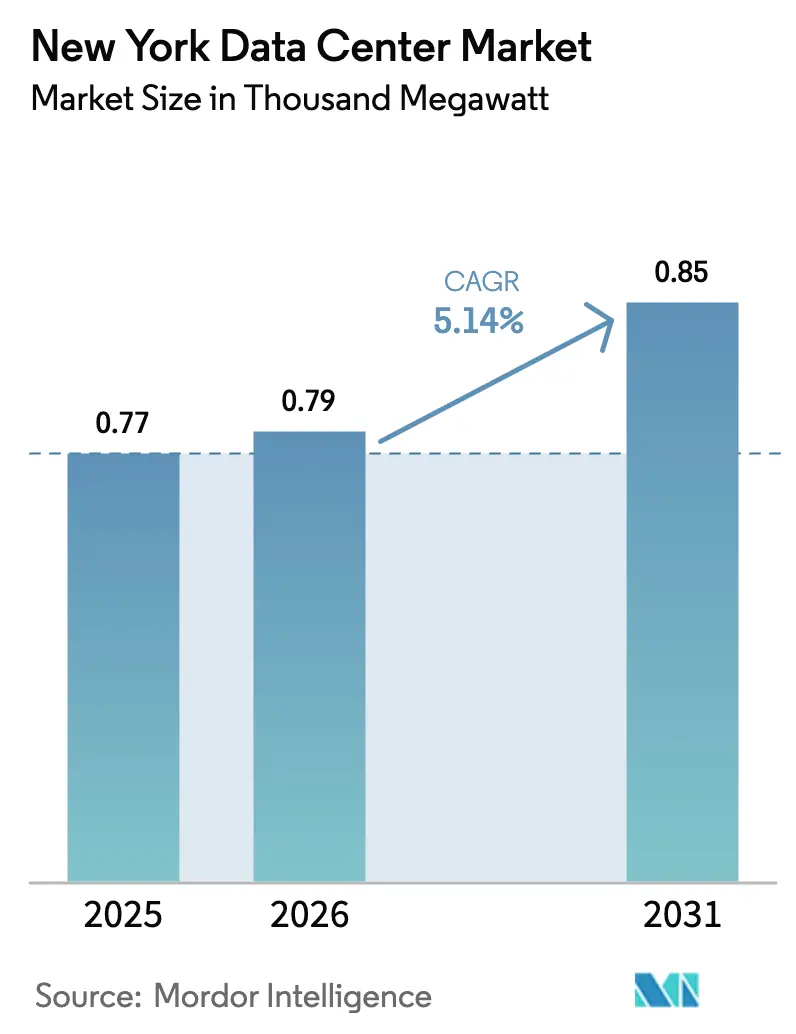
| Base Year Market Size (2025) | 0.77 Thousand megawatt |
| Market Volume (2026) | 0.79 Thousand megawatt |
| Market Volume (2031) | 0.85 Thousand megawatt |
| Growth Rate (2025 - 2031) | 5.14% CAGR |
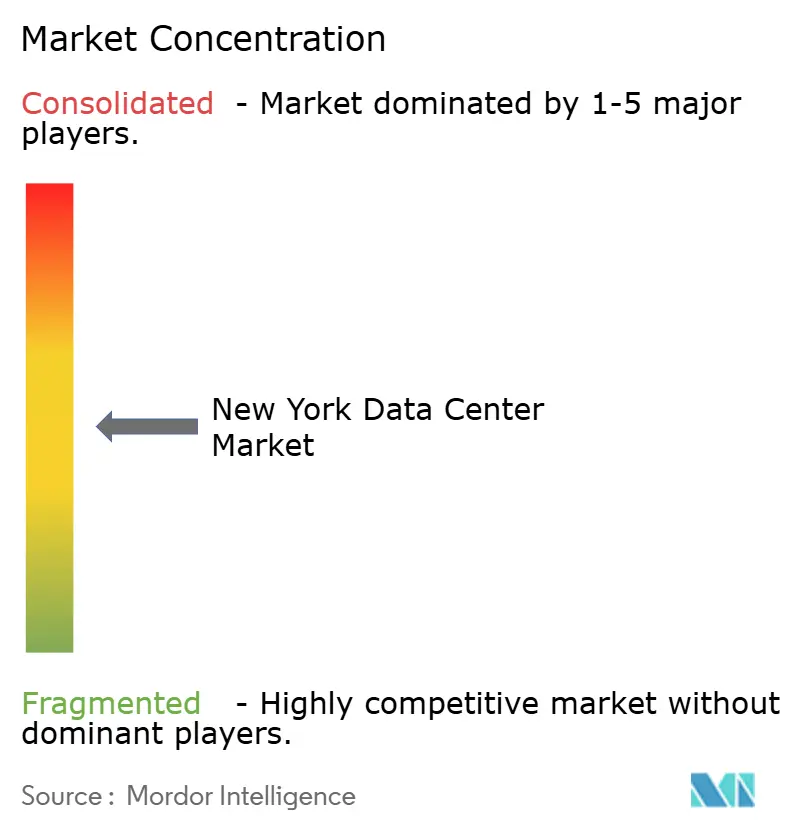
| Market Concentration | Medium |
Major Players *Disclaimer: Major Players sorted in no particular order Image © Mordor Intelligence. Reuse requires attribution under CC BY 4.0. | |
New York Data Center Market Analysis by Mordor Intelligence
The New York data center market size stands at 854.5 MW in 2025 and is projected to reach 1,154.2 MW by 2031, representing a 5.14% CAGR over the forecast period. Wall Street’s need for sub-millisecond order executions, the proliferation of hyperscale cloud campuses, and a wave of office-to-data-center conversions in Midtown are anchoring demand growth. Power-dense AI training clusters are pushing rack requirements from 5–10 kW toward 50 kW and beyond, accelerating adoption of liquid cooling and renewable-powered designs. Competitive intensity is rising as incumbents fight for the limited parcels with both dual-feed utility access and ample fiber routes. At the same time, Local Law 97 and statewide carbon-neutrality targets are forcing operators to sign long-term green-energy contracts or add on-site generation, tilting the playing field toward firms with balance-sheet strength. Capacity shortfalls flagged by the grid operator, combined with multi-billion-dollar equity inflows, set the stage for continued price premiums in prime locations.
Key Report Takeaways
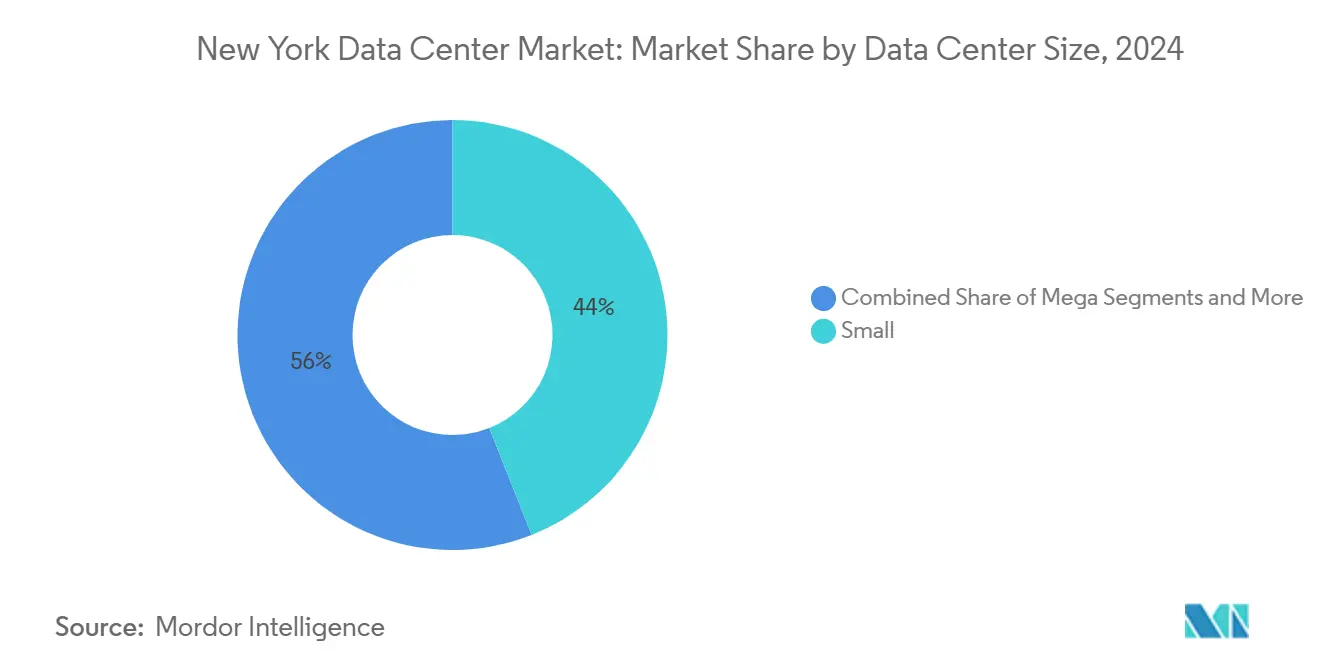
- By data center size, the Small category captured 44% of the New York data center market share in 2024, while Large sites are forecast to record the fastest 6.1% CAGR through 2031.
- By tier standard, Tier III facilities accounted for 60% of the New York data center market size in 2024, while Tier IV builds are advancing at a 6.60% CAGR through 2031.
- By end-user industry, IT and Telecom represented a 43% share of the New York data center market size in 2024, and cloud/telecom hybrid use cases are expanding at a 4.86% CAGR to 2031.
Note: Market size and forecast figures in this report are generated using Mordor Intelligence’s proprietary estimation framework, updated with the latest available data and insights as of January 2026.
New York Data Center Market Trends and Insights
Drivers Impact Analysis*
| DRIVER | (~) % IMPACT ON CAGR FORECAST | GEOGRAPHIC RELEVANCE | IMPACT TIMELINE |
|---|---|---|---|
| Hyperscale cloud footprint expansion | +1.2% | Manhattan, Brooklyn, Queens | Medium term (2–4 years) |
| Capital-markets latency advantage | +0.8% | Manhattan Financial District, Northern NJ | Short term (≤ 2 years) |
| NY CLCPA renewable-energy credits and green tariffs | +0.6% | Statewide, NYC metro | Long term (≥ 4 years) |
| Fiber densification via subsea cable landings | +0.5% | Long Island, Manhattan | Medium term (2–4 years) |
| Vacant Midtown office conversions | +0.4% | Manhattan below 59th St | Medium term (2–4 years) |
| Municipal micro-grids and on-site fuel cells | +0.3% | Outer boroughs | Long term (≥ 4 years) |
| Source: Mordor Intelligence | |||
Hyperscale Cloud Footprint Expansion
AWS, Microsoft, and Google have each committed multi-hundred-megawatt campuses in the metro, often pairing them with dedicated 400 G interconnect nodes for edge workloads. Digital Realty alone booked USD 521 million of new leases in Q3 2024, with an average yield of 12%, underscoring customer willingness to pay premiums for proximate capacity.[1]Digital Realty, 3Q 2024 Earnings Presentation, digitalrealty.com Power density per rack is moving toward 50 kW, and immersion-ready white space is now a standard requirement in hyperscale RFPs. Operators are locking in long-term renewable power purchase agreements and battery energy storage to guarantee capacity at fixed pricing. The scale and speed of these projects are widening the gap between well-capitalized global landlords and smaller regional providers.
Capital-Markets Latency Advantage
High-frequency trading desks measure distance in microseconds, driving demand for facilities within a 50-mile ring of the major exchanges. NASDAQ’s co-location suite reports order-acknowledge loops below 50 μs, while racks at Equinix NY4 in Secaucus command monthly rents near USD 3,500.[2]NASDAQ, Stock Exchange Co-Location, nasdaq.com Bare-metal deployments rather than virtualized instances dominate these footprints, eliminating hypervisor overhead. Proximity-driven pricing shields landlords from broader colocation commoditization, sustaining premium EBITDA margins. Exchange-operated facilities such as the NYSE campus in Mahwah further segment the market into latency-tiered clusters.
NY CLCPA Renewable-Energy Credits and Green Tariffs
New York’s mandate for 70% renewable electricity by 2030 is spurring adoption of long-term hydropower contracts and on-site fuel cells. Operators achieving power-usage-effectiveness below 1.3 qualify for tradable credits that directly lower operating costs. Microsoft’s two-phase immersion tanks have cut server-level power draw by up to 15% while freeing capacity for AI accelerators.[3]Microsoft, To Cool Datacenter Servers, Microsoft Turns to Boiling Liquid, microsoft.com Early movers secure favorable credit multipliers that will sunset as carbon caps tighten, creating a first-mover advantage and new barriers to entry.
Fiber Densification via Subsea Cable Landings
The AEC-1 and AEC-2 transatlantic systems land on Long Island, delivering 800 G wavelengths straight into Manhattan bypass routes and trimming round-trip latency to London by multiple milliseconds. A privately built Hudson River dark-fiber conduit was activated in 2024, the first in two decades, adding needed diversity into the city’s West Side carrier hotels. Dense fiber paths underpin the region’s role as an intercontinental switching node and support emerging edge use cases such as AR/VR streaming and real-time fraud analytics.
Restraints Impact Analysis*
| RESTRAINTS | (~) % IMPACT ON CAGR FORECAST | GEOGRAPHIC RELEVANCE | IMPACT TIMELINE |
|---|---|---|---|
| Manhattan real-estate and construction costs | −0.9% | Manhattan high-density zones | Short term (≤ 2 years) |
| Local Law 97 carbon-emission caps | −0.6% | NYC buildings > 25,000 sq ft | Medium term (2–4 years) |
| Utility power-availability constraints | −0.5% | NYC metro, especially outer boroughs | Medium term (2–4 years) |
| Grid interconnection-queue delays | −0.4% | Statewide NYISO territory | Long term (≥ 4 years) |
| Source: Mordor Intelligence | |||
Manhattan Real-Estate and Construction Costs
Core Manhattan retrofit projects often exceed USD 400 per square foot, double the outer-borough average, shrinking pro-forma returns. Competing residential conversions—such as the 1,320-unit SoMA redevelopment—tighten the supply of suitable buildings. Tax abatements under the Industrial and Commercial Abatement Program rarely apply south of 96th Street, tilting new developments toward Brooklyn and Queens. Landlords able to deliver powered shell space in the outer boroughs are winning hyperscale pre-leases that bypass Midtown sticker shock.
Local Law 97 Carbon-Emission Caps
Starting in 2025, data centers above 25,000 sq ft face stiff fines if carbon intensity thresholds are breached. Operators must either electrify mechanical loads or procure zero-carbon power certificates to remain compliant. Retrofitting legacy diesel backup systems with fuel cells or advanced UPS flywheels raises capex and extends project timelines. Firms that locked in long-duration renewable contracts prior to 2024 enjoy a structural cost edge over late entrants, intensifying the competitive gulf.
*Our forecasts treat driver/restraint impacts as directional, not additive. The impact forecasts reflect baseline growth, mix effects, and variable interactions.
Segment Analysis
By Data Center Size: Large Facilities Drive Market Evolution
Small data centers command 44% market share in 2024, reflecting the predominance of enterprise colocation deployments and multi-tenant facilities that serve New York's diverse business ecosystem. Large/hyperscale facilities represent the fastest-growing segment at 6.1% CAGR through 2030, driven by cloud service providers and AI workload requirements that demand massive power densities and specialized cooling infrastructure. The size distribution reflects the market's evolution from traditional enterprise hosting toward hyperscale architectures that support modern digital applications.
Medium-sized facilities (15-50 MW) serve as the backbone for many financial services deployments, offering the capacity needed for high-frequency trading systems while maintaining the flexibility for custom configurations. Micro data centers (<5 MW) fill specialized niches including edge computing applications and backup facilities, though their market share continues to decline as organizations consolidate operations into larger, more efficient facilities. Related Companies' USD 45 billion development pipeline focuses primarily on large-scale facilities, with individual projects exceeding 100 MW to serve hyperscale requirements Data Center Dynamics. The trend toward larger facilities is driven by economies of scale in power procurement, cooling efficiency, and operational management, with hyperscale deployments achieving Power Usage Effectiveness ratios below 1.2 compared to 1.5-1.8 for smaller facilities.


By Tier Standard: Tier IV Growth Accelerates
Tier III halls dominated with 60% of the New York data center market size in 2024, balancing cost and uptime. Financial traders and cloud platforms, however, are upgrading to Tier IV shells that promise 99.995% availability and concurrently maintainable subsystems. These deployments are projected to log a 6.60% CAGR through 2030. The Intercontinental Exchange liquidity center in Mahwah exemplifies this push, featuring fully isolated power paths and N+2 chilled water loops. Higher-tier adoption is further reinforced by cyber-resilience mandates under federal banking guidance, pushing enterprise RFPs to specify Tier IV design signatures.
In the outer boroughs, new-build Tier IV campuses capitalize on larger footprints, allowing ring-bus medium-voltage distribution and redundant on-site generation. Manhattan retrofits, constrained by elevator cores and existing risers, often cap upgrades at Tier III. As uptime premiums rise, Tier IV capacity is expected to capture incremental share, while lower tiers remain confined to dev-test workloads and archival nodes.
By Absorption: Hyperscale Momentum Builds
Colocation retained 48% of 2024 revenue, but single-tenant build-to-suit halls are pacing growth with a 5.20% CAGR. Cloud majors contract entire 20–40 MW pods, stipulating custom PUE targets and immersion-ready bays, a model that sidesteps multi-tenant fit-out lag times. Retail colocation continues to serve latency-sensitive trading racks and compliance-bound workloads that favor granular power billing. Managed cloud-on-ramp services follow hyperscalers into new suburbs, providing direct connects and packet-optical fabrics into the nearest transatlantic landing station. The shift in mix will raise average hall size, deepen capital intensity, and keep leasing tenors above 10 years, locking in predictable cash yields.
Wholesale landlords able to straddle both models—leasing powered shells to hyperscalers while carving out carrier-dense suites—enjoy diversified revenue streams. Smaller operators lacking scale may gravitate toward edge nodes or interconnection-only meet-me rooms to remain relevant in the evolving New York data center market.

Geography Analysis
Manhattan contains the densest cluster of carrier hotels, anchored by 60 Hudson Street and 111 8th Avenue. Limited utility capacity and real-estate costs exceeding USD 400 per square foot, however, restrain further greenfield growth. Many landlords now favor white-box conversions of prewar office towers, but Local Law 97 compliance often requires costly façade and mechanical retrofits. As a result, Manhattan’s share of the New York data center market size has plateaued even as overall capacity expands.
Brooklyn and Queens are capturing spillover demand by pairing lower land costs with diverse fiber entrances, supported by new dark-fiber builds across the East River. Tax incentives under the Industrial and Commercial Abatement Program can shave operating expenses by double-digit percentages, tipping total-cost-of-ownership models in favor of the boroughs. DataVerge’s carrier-neutral hub in Industry City now hosts one of the largest internet exchanges in the state, evidence that interconnection density is migrating outward.
Beyond the five boroughs, Long Island leverages its submarine cable stations to serve as the metro’s gateway to Europe, while Northern New Jersey’s ample substation capacity and lower property taxes attract hyperscale campuses. DataBank’s Orangeburg complex, 30 miles north of Midtown, illustrates the trend toward exurban “clean-sheet” developments with 45 MW expansion headroom. The grid operator warns of a potential 446 MW shortfall in 2025, a deficit that could accelerate geographic diversification to sites with pre-committed renewable generation.
Competitive Landscape
Digital Realty, Equinix, and CoreSite together control the majority of carrier-dense square footage in the metro. Digital Realty’s 2024 bookings of USD 521 million and Equinix’s USD 15 billion hyperscale joint venture underscore balance-sheet advantages that let these firms pre-commit transformers and switchgear before lead times stretch past two years. Power reservations have become the new moat, and incumbents with decades-long utility relationships command premium valuations.
Private-equity-backed challengers are scaling rapidly. Related Companies has earmarked USD 45 billion for metro projects, and Vantage Data Centers secured USD 13 billion globally to chase AI capacity. DataBank raised USD 2 billion to lift aggregate power from 330 MW to 850 MW, including a 45 MW campus in Orangeburg. Technology differentiation focuses on immersion cooling, Nvidia DGX-Ready certifications, and on-site fuel cells that satisfy both uptime and carbon scoring metrics.
Market entry barriers remain high: zoning hurdles, Local Law 97 overlays, and 36-month utility interconnection queues deter all but the most capitalized investors. Nonetheless, the outer-borough land rush and equity inflows point to sustained building activity, ensuring that price discovery will hinge on renewable power access rather than on raw square footage alone.
New York Data Center Industry Leaders
Digital Realty Trust, Inc.
DataBank
CoreSite
CyrusOne
Equinix Inc.
- *Disclaimer: Major Players sorted in no particular order

Recent Industry Developments
- January 2025: Related Companies launched a USD 45 billion data center division to develop multiple metro campuses.
- January 2025: DataBank closed a USD 600 million secondary share sale within a USD 2 billion equity round, boosting expansion funds.
- January 2025: Cloverleaf Infrastructure unveiled plans for a large-scale campus in Port Washington, Long Island.
- December 2024: Cologix raised USD 1.5 billion to expand its edge platform, including New York builds.


New York Data Center Market Report Scope
A data center is a physical room, building, or facility that holds IT infrastructure used to construct, run, and provide applications and services and store and manage the data connected with those applications and services.
The New York data center market is segmented by DC size (small, medium, large, massive, and mega), tier type (tier 1&2, tier 3, and tier 4), absorption (utilized (colocation type (retail, wholesale, and hyperscale)), end-user (cloud & IT, telecom, media & entertainment, government, BFSI, manufacturing, e-commerce, and end-user industries), and non-utilized).
The market sizes and forecasts are provided in terms of value (MW) for all the above segments.
| Small |
| Medium |
| Large |
| Mega |
| Massive |
| Tier I and II |
| Tier III |
| Tier IV |
| Non-Utilized | ||
| Utilized | Colocation Type | Retail |
| Wholesale | ||
| Hyperscale | ||
| End-User | BFSI | |
| IT and Telecom | ||
| Media and Entertainment | ||
| Government and Education | ||
| Healthcare and Life Sciences | ||
| Other End Users | ||
| By Data Center Size | Small | ||
| Medium | |||
| Large | |||
| Mega | |||
| Massive | |||
| By Tier Type | Tier I and II | ||
| Tier III | |||
| Tier IV | |||
| By Absorption | Non-Utilized | ||
| Utilized | Colocation Type | Retail | |
| Wholesale | |||
| Hyperscale | |||
| End-User | BFSI | ||
| IT and Telecom | |||
| Media and Entertainment | |||
| Government and Education | |||
| Healthcare and Life Sciences | |||
| Other End Users | |||


Key Questions Answered in the Report
What is the current capacity of the New York data center market?
The metro supports 854.5 MW of installed IT load in 2025 and is forecast to climb to 1,154.2 MW by 2031.
Which boroughs are attracting the most new data center builds?
Brooklyn, Queens, and Long Island are drawing hyperscale and colocation projects because of lower land costs and better power availability compared with Midtown.
How does Local Law 97 affect new data center projects?
Facilities larger than 25,000 sq ft must cut carbon intensity or face fines beginning in 2025, leading operators to lock in renewable power and electrify mechanical systems.
What cooling technology is gaining momentum in New York facilities?
Liquid immersion and direct-to-chip loops are the fastest-growing options due to rising rack densities and stricter energy-efficiency targets.
Why are financial firms paying premium rents for colocation space?
Sub-millisecond latency to exchanges translates directly into trading revenue, so banks lease cabinets in facilities within 50 miles of Manhattans markets.
How significant are renewable energy credits for data center economics?
Operators achieving PUE below 1.3 can monetize state renewable credits, shaving operating costs and improving long-term competitiveness.
Page last updated on:


