Rugged Display Market Size and Share
Market Overview
| Study Period | 2020 - 2031 |
|---|---|
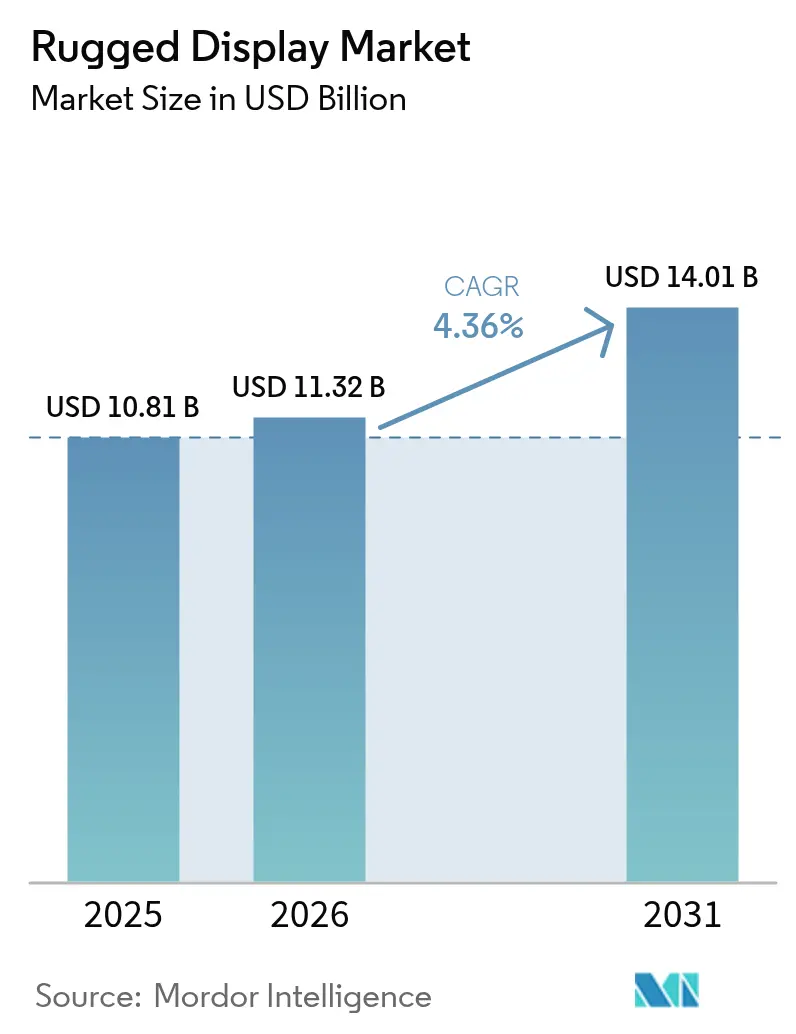
| Market Size (2026) | USD 11.32 Billion |
| Market Size (2031) | USD 14.01 Billion |
| Growth Rate (2026 - 2031) | 4.36% CAGR |
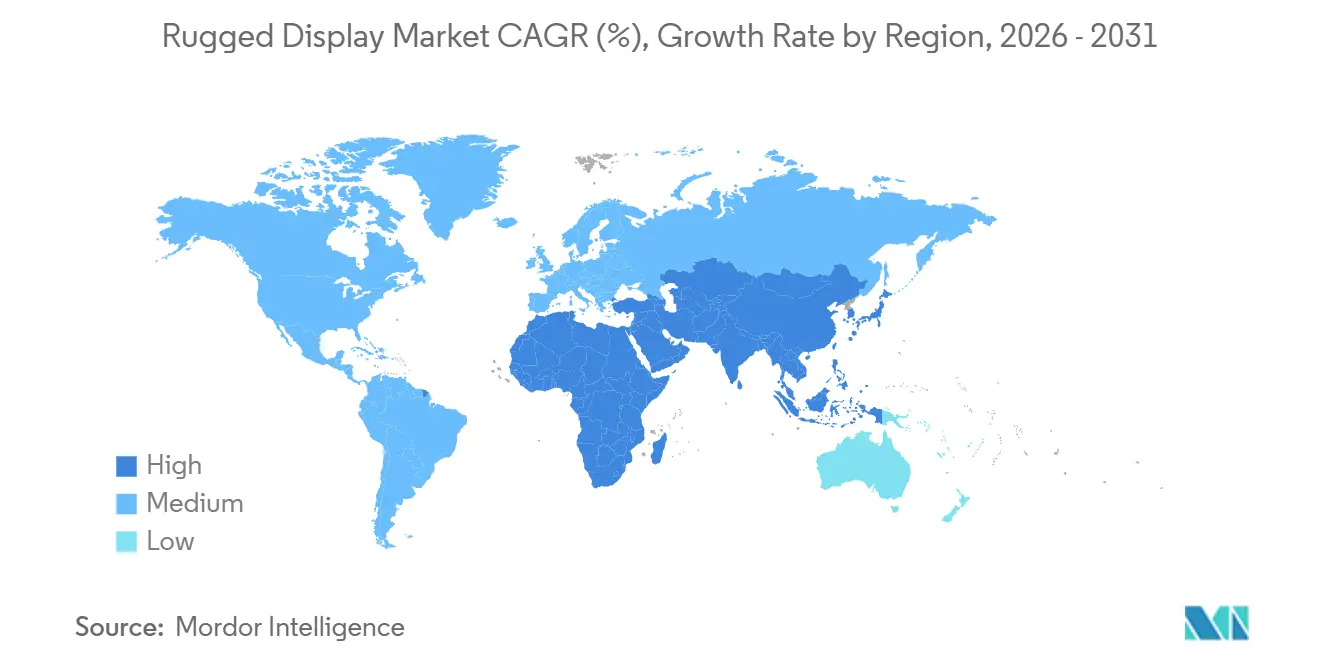
| Fastest Growing Market | Asia Pacific |
| Largest Market | North America |
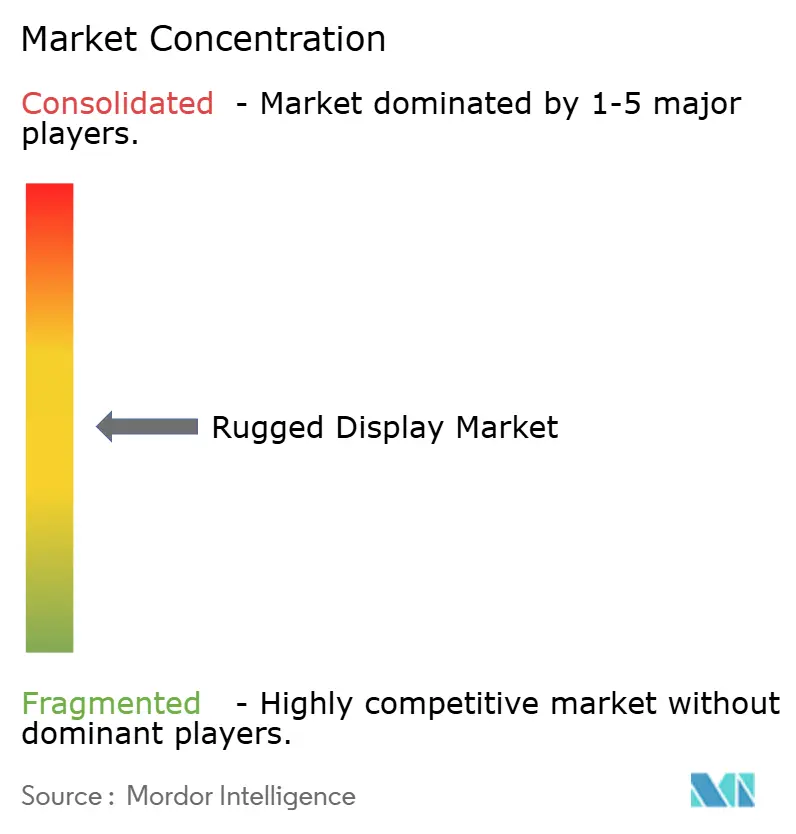
| Market Concentration | Medium |
Major Players *Disclaimer: Major Players sorted in no particular order Image © Mordor Intelligence. Reuse requires attribution under CC BY 4.0. | |
Rugged Display Market Analysis by Mordor Intelligence
The rugged display market size is projected to expand from USD 10.81 billion in 2025 and USD 11.32 billion in 2026 to USD 14.01 billion by 2031, registering a CAGR of 4.36% between 2026 to 2031. The measured growth rate mirrors buyers’ migration from disposable consumer screens toward lifecycle-optimized equipment that endures vibration, thermal shock, and liquid ingress. Defense modernization budgets, smart-factory rollouts, and hazardous-area safety rules are reinforcing demand, while edge-AI processors and 5G modems are shifting performance benchmarks that once were optional. Procurement teams are recalibrating total cost of ownership, concluding that extended service life and lower failure rates outweigh a 2x to 3x capital premium, especially where downtime threatens mission readiness or production throughput. Competitive intensity remains moderate because qualification cycles, intrinsically safe certifications, and global service footprints are costly barriers that discourage rapid new entry, yet the rugged display market still attracts niche innovators that target white-space opportunities in augmented reality and autonomous logistics.
Key Report Takeaways
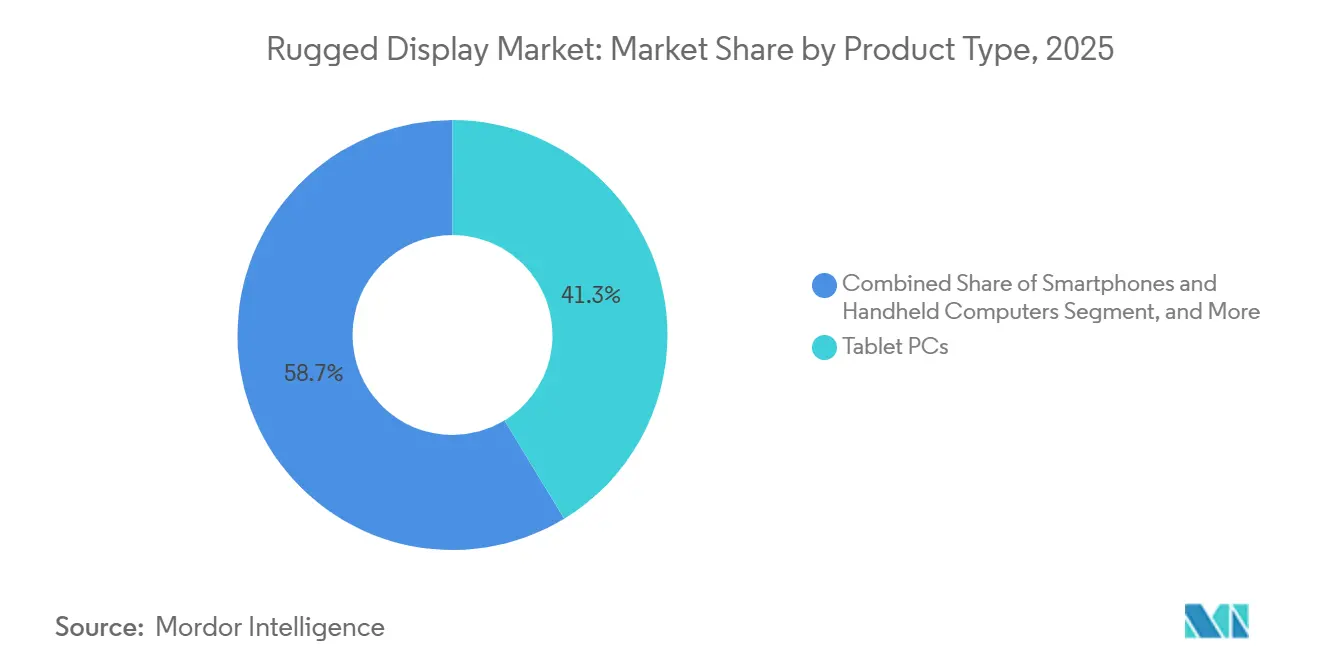
- By product type, tablet PCs led with 41.30 % of the rugged display market share in 2025, whereas vehicle-mounted computers are advancing at a 5.51 % CAGR through 2031.
- By ruggedness level, fully rugged systems captured 47.82% of shipments in 2025, while ultra-rugged units are the fastest-growing tier, with a 4.97% CAGR to 2031.
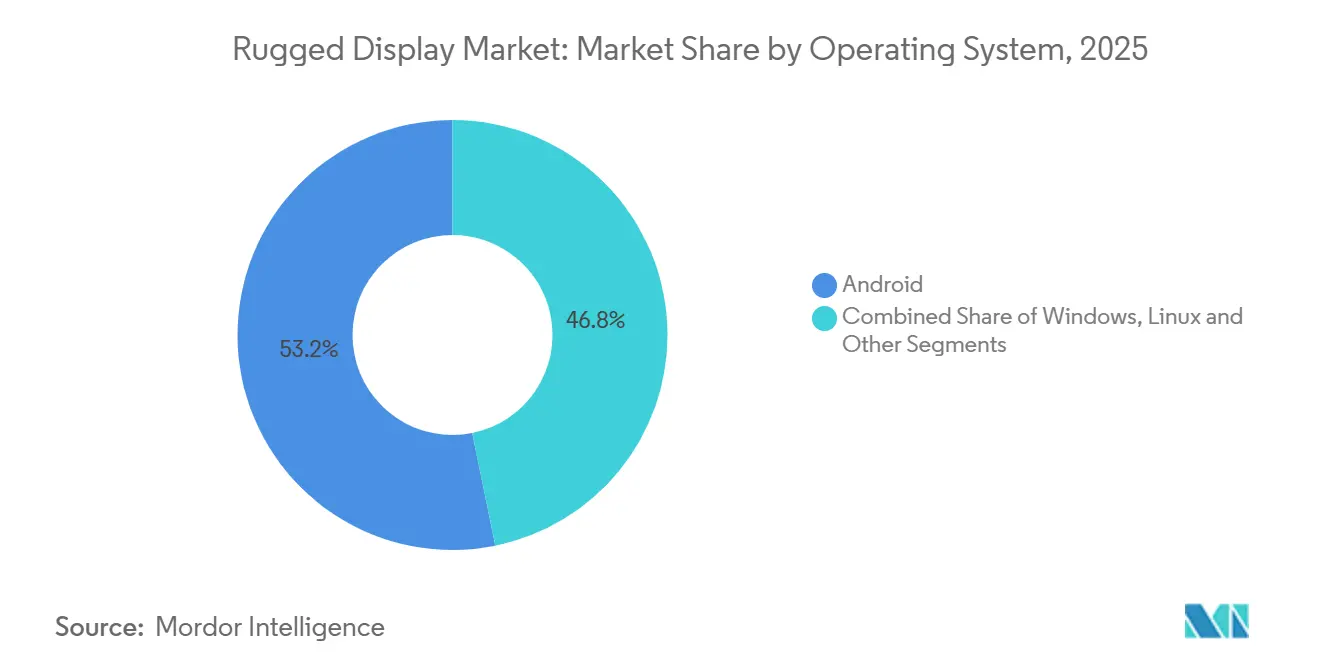
- By operating system, Android accounted for 53.18% of units in 2025 and is rising at a 4.83% CAGR over the forecast period.
- By end-user, Government, Defense and Aerospace accounted for 31.07% of the rugged display market in 2025, whereas the oil and gas sector recorded the fastest growth at a 7.69% CAGR between 2026 and 2031.
- By geography, North America accounted for 44.92% of revenue in 2025, even as Asia-Pacific is set to grow at 5.32% through 2031.
Note: Market size and forecast figures in this report are generated using Mordor Intelligence’s proprietary estimation framework, updated with the latest available data and insights as of 2026.
Global Rugged Display Market Trends and Insights
Drivers Impact Analysis*
| Driver | (~) % Impact on CAGR Forecast | Geographic Relevance | Impact Timeline |
|---|---|---|---|
| Integration of augmented reality interfaces | +0.9 % | North America and Europe | Medium term (2-4 years) |
| Adoption of rugged displays for autonomous vehicles | +0.8 % | United States, United Kingdom and Israel | Medium term (2-4 years) |
| Stringent safety rules for intrinsically safe panels | +0.7 % | European Union and Middle East | Long term (≥ 4 years) |
| Expansion of 5G private networks in smart factories | +0.7 % | China, Japan and South Korea | Medium term (2-4 years) |
| Rising demand for sunlight-readable screens | +0.6 % | Middle East, North Africa and offshore Asia-Pacific | Short term (≤ 2 years) |
| Lifecycle cost advantage in mining fleets | +0.5 % | Australia, Chile, Brazil and South Africa | Long term (≥ 4 years) |
| Source: Mordor Intelligence | |||
Integration Of Augmented Reality Interfaces In Field Service Applications
Field technicians now receive step-by-step digital overlays on rugged tablets and head-mounted displays, reducing training hours and diagnostic errors. In September 2025, Leonardo DRS introduced AI-enabled combat vehicle screens that highlight threat zones for crews.[1]Leonardo DRS, “AI-Enabled Rugged Displays for Combat Vehicles,” leonardodrs.com RealWear’s 2025 Navigator 520 pairs a hands-free microdisplay with voice commands, allowing gloved refinery operators to access digital twins. Shell’s offshore platforms employed Class 1 Division 2 certified headsets in 2024 and reduced turnaround windows by 15 %. Continuous 5G coverage eliminates cloud latency, so rugged display market vendors are packaging edge inference chips to support real-time annotation.
Adoption Of Rugged Displays For Autonomous Military Vehicles And Unmanned Systems
Unmanned ground and aerial platforms require shock-proof human-machine interfaces that fuse LiDAR, radar, and electro-optical feeds. Overland AI’s OverDrive software, qualified on MIL-STD-810H panels in 2025, processes sensor data under 40 G shock loads. Textron’s RIPSAW M5 uses a hardened touch computer so a single soldier can control multiple robots. The United States Department of Defense allocated more than USD 1 billion to autonomy programs during fiscal 2025, most of which specify rugged screens immune to electromagnetic interference. As autonomy grows, displays shift from passive monitors to active decision-support consoles.
Stringent Safety Regulations In Hazardous Industrial Environments Boosting Intrinsically Safe Panels
ATEX Directive 2014/34/EU and IECEx rules bar unprotected consumer devices from explosive zones, so operators are converting to tablets that limit surface temperature and energy discharge. Winmate’s M101B, certified for Zone 1, allows maintenance crews to review gas-detector data beside wellheads.[2]Winmate Inc., “M101B and M133B ATEX Rugged Tablets,” winmate.com Cincoze integrated intrinsically safe screens into offshore drilling control stations in 2024, meeting IEC 60079-0. The European Union tightened temperature limits for Zone 0 in January 2024, sparking a twelve-month qualification race. Middle Eastern buyers and Australian miners now reference European standards, magnifying global demand for ultra-rugged certification.
Expansion Of 5G Private Networks Enabling Rugged Tablet Upgrades In Smart Factories
China surpassed 10,000 private 5G networks by late 2024, each connecting robots, vision systems and AGVs that cannot tolerate cloud latency. Winmate’s S101MT, launched June 2025, embeds Intel AI Boost so inspection cameras analyze defects on-device. Japanese auto suppliers mount IP65-rated panel PCs alongside conveyor lines to guide collaborative robots in metal-particle environments. As factories retire Wi-Fi and wired links, the rugged display market sees a refresh cycle favoring units with 5G modems and edge AI co-processors.
Restraints Impact Analysis*
| Restraint | (~) % Impact on CAGR Forecast | Geographic Relevance | Impact Timeline |
|---|---|---|---|
| Supply chain volatility of industrial LCD panels | −0.6 % | North America and Europe | Short term (≤ 2 years) |
| Thermal management limits on OLED adoption | −0.4 % | Middle East and tropical deployments | Medium term (2-4 years) |
| High upfront cost of ultra-rugged panel PCs | −0.3 % | North America and Europe | Long term (≥ 4 years) |
| Form-factor constraints as wearables rise | −0.3 % | Global logistics and healthcare | Medium term (2-4 years) |
| Source: Mordor Intelligence | |||
Supply Chain Volatility Of Industrial LCD Panels Due To China-Centric Manufacturing
China controls more than 70% of global LCD output, and export-control actions in 2024 prolonged lead times for specialty panels.[3]BOE Technology Group, “LCD Panel Capacity and Market Position,” boe.com Rugged display integrators now hold six to nine months of inventory, doubling pre-2024 working capital needs. Alternative suppliers in Japan and Taiwan impose premiums of around 20% and lack the ability to scale production quickly, system integrators are increasingly investigating mini‑LED technology as a potential substitute. However, this path is far from straightforward: mini‑LED solutions still carry higher overall costs compared to established supply chains, and the industry lacks robust qualification data to validate performance and reliability at scale.
Thermal Management Challenges Limiting OLED In High-Temperature Defense Missions
In May 2025, panel makers in mainland China cut fab utilization to 76% amid tariff uncertainty, which clouded demand and disrupted production planning, highlighting the fragility of supply chains under shifting trade policies. At the same time, OLED technology faces a critical reliability challenge: its half‑life drops sharply above 60 °C, making these panels unsuitable for deployment in desert combat vehicles, where cabin surfaces can reach 70 °C. The U.S. Army’s Integrated Visual Augmentation System reverted to LCD after Kuwait trials revealed unacceptable brightness decay. Active cooling would add weight and violate ruggedness norms, preserving LCD dominance in extreme environments.[4]Collins Aerospace, “Avionics Display Systems,” collinsaerospace.com
*Our forecasts treat driver/restraint impacts as directional, not additive. The impact forecasts reflect baseline growth, mix effects, and variable interactions.
Segment Analysis
By Product Type: Vehicle-Mounted Computers Gain Traction In Autonomous Fleets
Vehicle-mounted computers are the fastest growing product, posting a 5.51 % CAGR as fleet operators integrate route optimization, driver-assist cameras, and telematics in a single fixed screen. Tablet PCs still commanded 41.30% of revenue in 2025 within the rugged display market, but their share is constrained by drop vulnerability and limited screen real estate in multi-data-stream environments.
Large screens installed directly on dashboards eliminate theft risk and draw continuous power from vehicle batteries. Overland AI’s OverDrive navigation stack, qualified on such computers in 2025, underscores the pivot toward fixed mounts. In contrast, avionics displays occupy a stable niche that values DO-160 testing over yearly refresh cycles, while smartphones and handhelds serve scanning tasks where one-handed use is essential. The rugged display market continues to diversify in form factors, yet fleet and mining buyers increasingly standardize on bolted-in panels that withstand 40 G shocks and harsh vibration.


By Level Of Ruggedness: Ultra-Rugged Gains Share In Extreme Environments
Fully rugged systems held 47.82 % shipments in 2025, balancing durability with mid-tier pricing, but ultra-rugged configurations are advancing at 4.97 % and steadily enlarging the rugged display market share. Mining haul trucks, offshore drilling rigs and armored combat vehicles justify the price jump because device failure in those settings triggers production or mission downtime.
MIL-STD-810H and IP68 have become baseline credentials, while ATEX and IECEx certificates are turning into purchase gatekeepers for oil and gas buyers. Vendors willing to fund year-long testing cycles command healthy margins because few rivals can match the portfolio depth or service infrastructure. As a result, the rugged display market size captured by ultra-rugged units is projected to rise steadily through the forecast horizon.
By Operating System: Android Dominates On Cost And Ecosystem Breadth
Android delivered a 53.18% unit share in 2025 and continues to outpace Windows because its zero-license model cuts fleet deployment costs by 30% to 40%. Built-in support for TensorFlow Lite lets developers push AI inference to the edge, aligning with 5G network rollouts and reinforcing Android’s appeal.
Windows remains indispensable wherever legacy SCADA systems or Defense Information Systems Agency hardening guides mandate its use, yet its high processing overhead and paid licenses deter logistics and warehousing buyers. Linux variants fill niche avionics roles that need deterministic real-time kernels. Provided these trends hold, the rugged display market for Android devices will widen its lead, though Windows will defend critical-mission pockets where certification heritage is irreplaceable.
By End-User: Oil And Gas Accelerates On Middle East Digitalization
Oil and gas recorded the fastest growth, rising by 7.69% through 2031, as national oil companies require intrinsically safe, high-brightness panels for desert pipelines and offshore rigs. Utilities like the Omaha Public Power District have embraced ruggedized digital tools to modernize field operations, outfitting their lineworkers with Panasonic TOUGHBOOK tablets that can directly integrate into SCADA system feeds. This deployment allows crews to access real‑time grid data, monitor system performance, and coordinate responses more efficiently while working in challenging outdoor conditions.
Government, defense, and aerospace still account for 31.07% of 2025 revenue, thanks to multiyear avionics contracts. Industrial manufacturing leverages private 5G to upgrade factory human-machine interfaces, while logistics fleets deploy vehicle-mounted computers to meet electronic logging mandates. Collectively, these verticals secure a balanced customer mix that shields the rugged display market from cyclical swings in any single sector.
Geography Analysis
North America generated 44.92 % of 2025 revenue, supported by Department of Defense avionics buys and Federal Railroad Administration safety mandates. Permian Basin drillers specify intrinsically safe tablets, and Omaha Public Power District’s 2025 rollout confirmed that lifecycle savings justify premium pricing. A mature installed base limits headline growth, yet service contracts and refresh cycles preserve ample cash flow for suppliers.
Asia-Pacific is the fastest riser, with a 5.32% CAGR, energised by more than 10,000 Chinese private 5G networks and Japanese automotive robot projects. India’s defense modernization funnels fresh funds into MIL-STD-qualified displays. Vendors that localize post-sale support and stock 5G-enabled models are set to capture an outsized portion of the rugged display market.
Europe benefits from strict ATEX enforcement that replaces uncertified consumer tablets with intrinsically safe units. German automotive and Nordic renewable-energy projects add incremental demand, though slower 5G adoption and a mature defense fleet temper growth relative to Asia-Pacific. Updated Zone 0 temperature rules effective January 2024 nevertheless sustain a predictable refresh cadence that anchors vendor revenue streams.

Competitive Landscape
Market concentration is moderate, balancing long-cycle defense incumbents with agile commercial specialists. Collins Aerospace, Curtiss-Wright, and General Dynamics defend cockpit and mission-computer niches where qualification hurdles deter challengers. Getac, Panasonic, Winmate, and Zebra Technologies compete vigorously on tablet refresh rates, after-market service, and vertical-specific features. Discount entrants such as WEROCK and Cincoze undercut incumbents by 20% to 30% in price-sensitive oil and gas bids, trading brand prestige for acceptable durability.
Technology roadmaps increasingly revolve around edge inference, 5G radio stacks, and intrinsically safe enclosures. Winmate introduced Intel AI Boost tablets in 2025, and Panasonic highlighted healthcare-grade infection-control models in shareholder material. The United States Patent and Trademark Office awarded multiple patents covering thermal management and sunlight-readable backlights during 2024-2025, confirming sustained R&D investment.
Defense and aerospace remain insulated by qualification inertia that stretches 10 years or longer, whereas commercial verticals exhibit higher churn and price competition. Vendors that master both spheres, offering certified avionics displays and commodity Android tablets, are positioned to widen wallet share as end-users consolidate suppliers for lifecycle simplicity.
Rugged Display Industry Leaders
Zebra Technologies Corp.
Panasonic Corporation
Dell Technologies Inc.
Getac Technology Corporation
Honeywell International Inc.
- *Disclaimer: Major Players sorted in no particular order

Recent Industry Developments
- September 2025: Leonardo DRS unveiled AI-enabled ground-combat vehicle displays that overlay threat vectors and maintenance cues.
- September 2025: WEROCK released the Rocktab U212 Pro rugged tablet, adding MIL-STD-810H durability and IP65 sealing.
- June 2025: Winmate launched the S101MT rugged tablet with Intel AI Boost for edge inference in smart-factory deployments.
- May 2025: Winmate introduced its Robotic Controller Series, binding panel PCs with robot-arm coordination interfaces.


Global Rugged Display Market Report Scope
The Rugged Display Market Report is Segmented by Product Type (Smartphones and Handheld Computers, Tablet PCs, Laptops and Notebooks, Avionics Displays, Vehicle-Mounted Computers, Panel PCs and Mission-Critical Displays), Level of Ruggedness (Semi-Rugged, Fully-Rugged, Ultra-Rugged), Operating System (Android, Windows, Linux and Other), End-User (Oil and Gas, Government Defense and Aerospace, Industrial Manufacturing, Automotive Transportation and Logistics, Healthcare and Public Safety, Utilities and Energy, Other End-Users), and Geography (North America, Europe, South America, Asia-Pacific, Middle East, Africa). The Market Forecasts are Provided in Terms of Value (USD).
| Smartphones and Handheld Computers |
| Tablet PCs |
| Laptops and Notebooks |
| Avionics Displays |
| Vehicle-Mounted Computers |
| Panel PCs and Mission-Critical Displays |
| Semi-Rugged |
| Fully-Rugged |
| Ultra-Rugged |
| Android |
| Windows |
| Linux and Other |
| Oil and Gas |
| Government, Defense and Aerospace |
| Industrial Manufacturing |
| Automotive, Transportation and Logistics |
| Healthcare and Public Safety |
| Utilities and Energy |
| Other End-Users |
| North America | United States |
| Canada | |
| Mexico | |
| Europe | Germany |
| United Kingdom | |
| France | |
| Nordics | |
| Rest of Europe | |
| South America | Brazil |
| Rest of South America | |
| Asia-Pacific | China |
| Japan | |
| India | |
| South-East Asia | |
| Rest of Asia-Pacific | |
| Middle East | Gulf Cooperation Council Countries |
| Turkey | |
| Rest of Middle East | |
| Africa | South Africa |
| Rest of Africa |
| By Product Type | Smartphones and Handheld Computers | |
| Tablet PCs | ||
| Laptops and Notebooks | ||
| Avionics Displays | ||
| Vehicle-Mounted Computers | ||
| Panel PCs and Mission-Critical Displays | ||
| By Level of Ruggedness | Semi-Rugged | |
| Fully-Rugged | ||
| Ultra-Rugged | ||
| By Operating System | Android | |
| Windows | ||
| Linux and Other | ||
| By End-User | Oil and Gas | |
| Government, Defense and Aerospace | ||
| Industrial Manufacturing | ||
| Automotive, Transportation and Logistics | ||
| Healthcare and Public Safety | ||
| Utilities and Energy | ||
| Other End-Users | ||
| By Geography | North America | United States |
| Canada | ||
| Mexico | ||
| Europe | Germany | |
| United Kingdom | ||
| France | ||
| Nordics | ||
| Rest of Europe | ||
| South America | Brazil | |
| Rest of South America | ||
| Asia-Pacific | China | |
| Japan | ||
| India | ||
| South-East Asia | ||
| Rest of Asia-Pacific | ||
| Middle East | Gulf Cooperation Council Countries | |
| Turkey | ||
| Rest of Middle East | ||
| Africa | South Africa | |
| Rest of Africa | ||


Key Questions Answered in the Report
What is the projected value of the rugged display market by 2031?
It is forecast to reach USD 14.01 billion by 2031, reflecting a 4.36 % CAGR over 2026-2031.
Which product category is growing fastest within rugged displays?
Vehicle-mounted computers are rising at a 5.51 % CAGR as fleets integrate telematics and autonomous functions.
Why are ultra-rugged units gaining share?
Mining, oil and gas and defense buyers accept higher upfront prices because ultra-rugged devices deliver sub-1 % annual failure rates in extreme conditions.
How does Android compare with Windows in rugged deployments?
Android avoids license fees and supports on-device AI, giving it a 53.18 % unit share and a cost advantage of about 30-40 % over a five-year life.
Which region will contribute the most incremental growth?
Asia-Pacific, expanding at 5.32 % CAGR, driven by private 5G networks and smart-factory upgrades across China, Japan and South Korea.
What is the main supply-chain risk facing rugged display vendors?
Heavy dependence on Chinese LCD fabs, which supply over 70 % of industrial panels and can elongate lead times during geopolitical frictions.
Page last updated on:


