LED Display Market Size and Share
Market Overview
| Study Period | 2020 - 2031 |
|---|---|
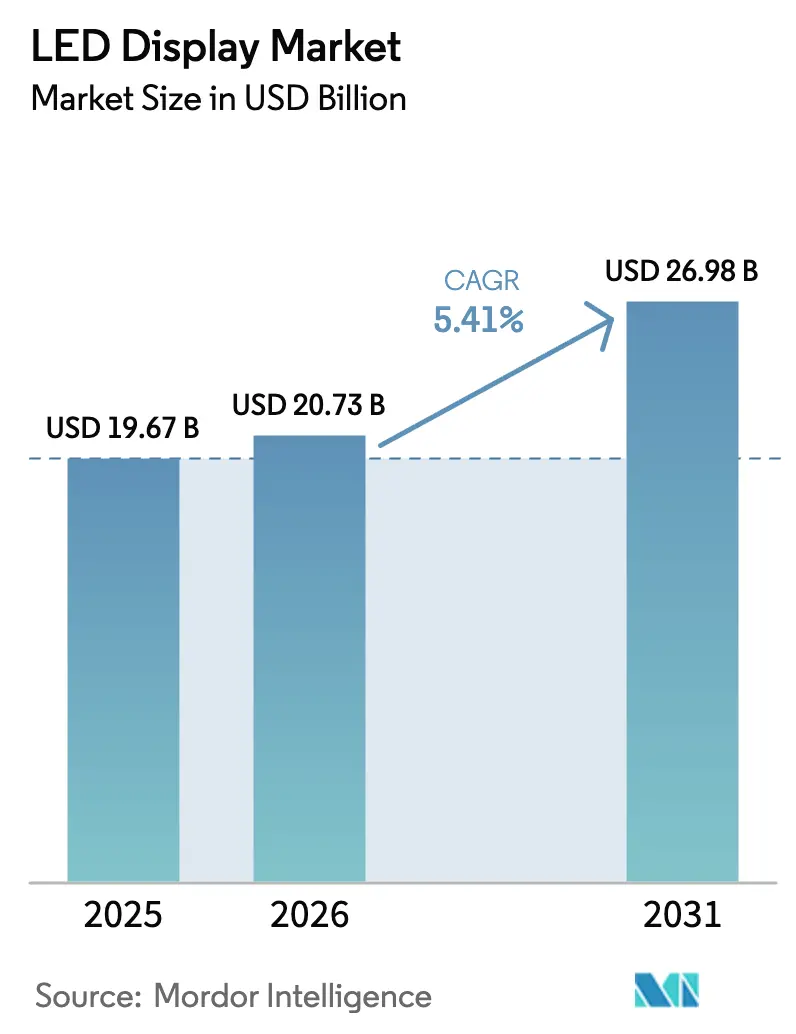
| Market Size (2026) | USD 20.73 Billion |
| Market Size (2031) | USD 26.98 Billion |
| Growth Rate (2026 - 2031) | 5.41% CAGR |
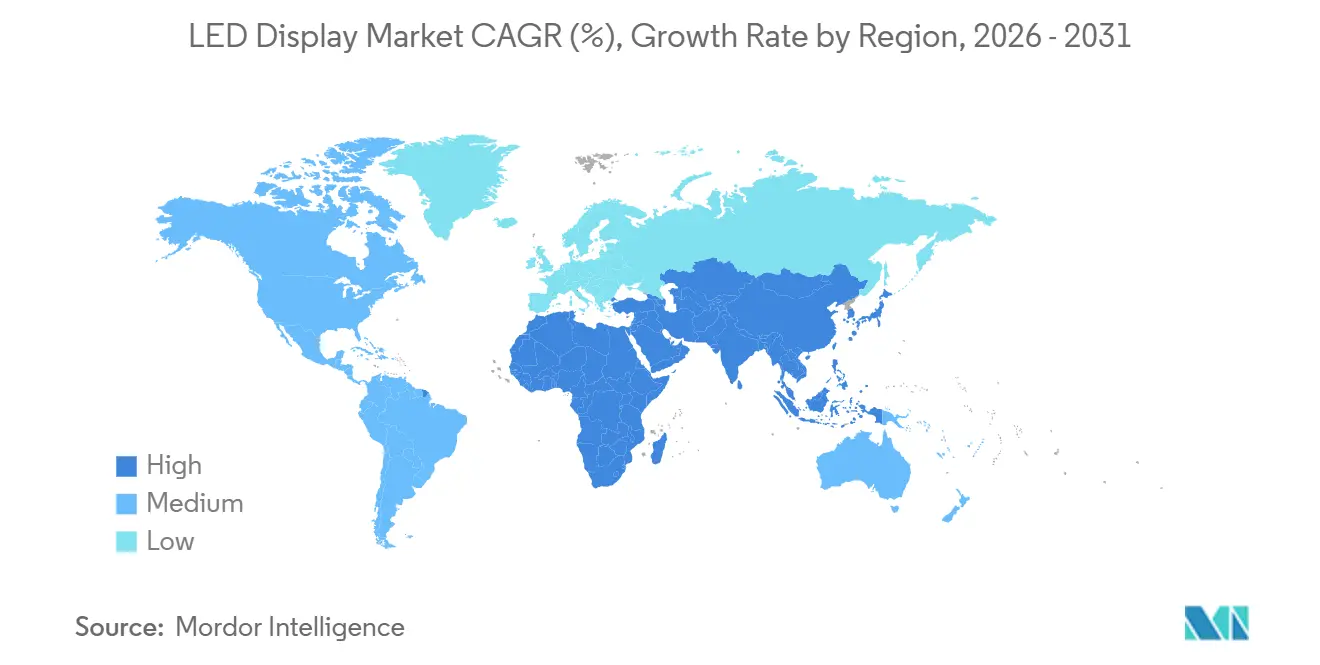
| Fastest Growing Market | Middle East and Africa |
| Largest Market | Asia Pacific |
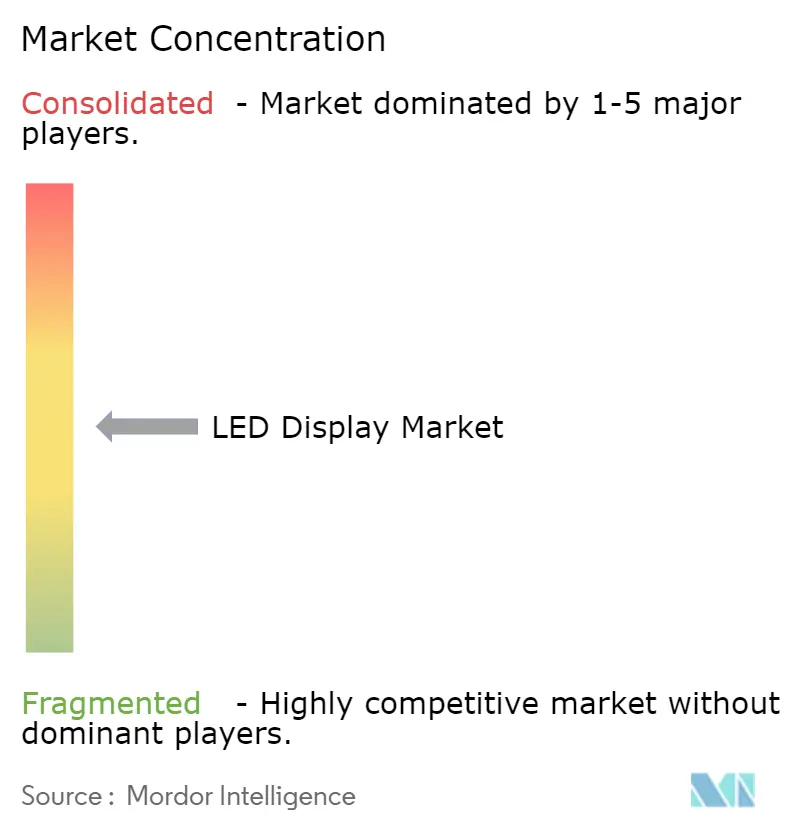
| Market Concentration | Medium |
Major Players
*Disclaimer: Major Players sorted in no particular order Image © Mordor Intelligence. Reuse requires attribution under CC BY 4.0. |
|
LED Display Market Analysis by Mordor Intelligence
The LED display market size was valued at USD 19.67 billion in 2025 and estimated to grow from USD 20.73 billion in 2026 to reach USD 26.98 billion by 2031, at a CAGR of 5.41% during the forecast period (2026-2031). Higher‐resolution panels, rapid urban digitization, and premium corporate upgrades continue to energize demand despite economic headwinds. Manufacturers are prioritizing fine-pixel-pitch innovations that open premium revenue streams in control rooms, broadcast studios, and executive briefing centers. Infrastructure projects in Asia Pacific and the Middle East sustain large-format outdoor orders, while software-driven content platforms expand recurring service revenues. Pricing pressure on mainstream products is offset by rising adoption in traffic signage, smart buildings, and event rentals, where short lead times and modular designs strengthen competitive positioning.
Key Report Takeaways
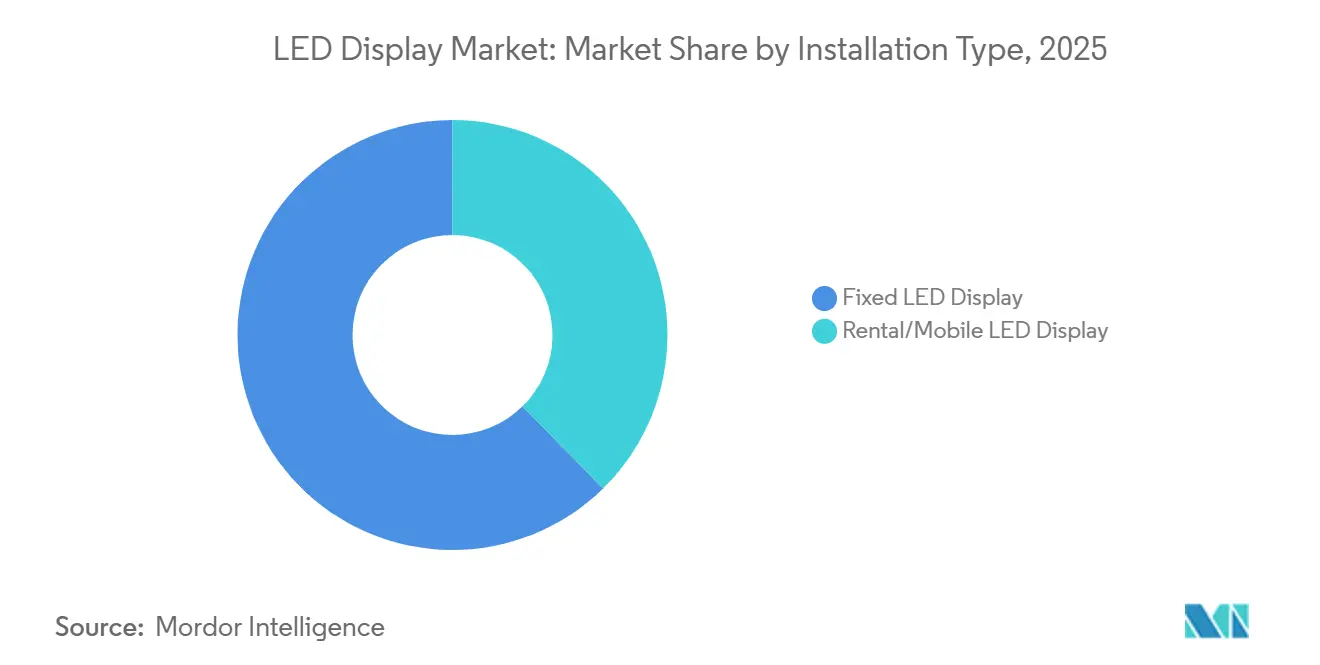
- By installation type, fixed LED displays led with 62.35% LED display market share in 2025, while the rental segment is projected to expand at a 6.78% CAGR to 2031.
- By display type, outdoor units commanded 55.30% revenue share in 2025; indoor displays are advancing at a 6.5% CAGR through 2031.
- By technology, conventional SMD solutions held 77.20% revenue in 2025; Micro-LED is forecast to grow at a 8.75% CAGR through 2031.
- By pixel pitch, the 3-6 mm category captured 46.55% of 2025 revenue, whereas ≤ 1.5 mm modules are set for an 8.21% CAGR to 2031.
- By screen size, 10–50 m² displays accounted for 51.30% of revenue in 2025, while < 10 m² panels will post a 6.97% CAGR to 2031.
- By color display, full-color systems dominated with 68.40% share in 2025; tricolor units are expected to register an 7.95% CAGR through 2031.
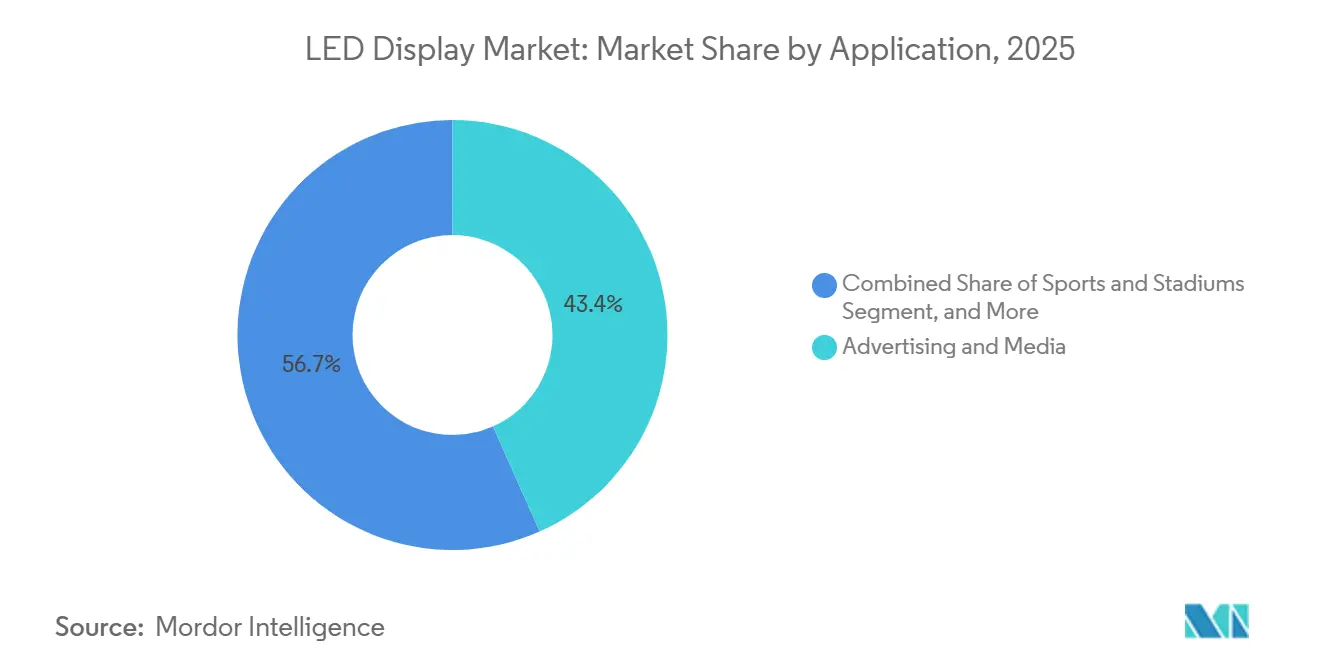
- By application, advertising and media held 43.35% of revenue in 2025; transportation and traffic control is the fastest mover at a 6.86% CAGR to 2031.
- By end-use sector, commercial deployments represented 57.40% share in 2025, whereas government and defense will record the quickest 7.96% CAGR into 2031.
- By geography, Asia Pacific retained 47.60% revenue in 2025, and the Middle East and Africa region will accelerate at a 6.78% CAGR between 2026 and 2031.
Note: Market size and forecast figures in this report are generated using Mordor Intelligence’s proprietary estimation framework, updated with the latest available data and insights as of 2026.
Global LED Display Market Trends and Insights
Drivers Impact Analysis*
| Driver | (~) % Impact on CAGR Forecast | Geographic Relevance | Impact Timeline |
|---|---|---|---|
| Shift to Fine-Pixel-Pitch Indoor Walls in GCC Control Rooms | +1.2% | Middle East (GCC countries), with spillover to North Africa | Medium term (2-4 years) |
| Rapid Adoption of Digital-Out-of-Home (DOOH) advertising in Tier-2 Chinese Cities | +0.9% | China, with influence expanding to Southeast Asia | Short term (≤ 2 years) |
| Stadium-Scale LED Megascreens Driving U.S. Sports Franchises' Fan-Engagement | +0.8% | North America, with growing adoption in Europe | Medium term (2-4 years) |
| Surge in Traffic-Management Variable-Message Signs (VMS) Installations Across ASEAN Smart-City Corridors | +0.7% | Southeast Asia, with expansion to South Asia | Medium term (2-4 years) |
| 8K-Ready Broadcast Studios Upgrading to Direct-View LED in Europe | +0.6% | Europe, with adoption spreading to North America and Asia Pacific | Medium term (2-4 years) |
| Energy-Efficient Mini-LED Retrofits in Japanese Retail Chains | +0.5% | Japan, with expansion to Asia Pacific retail markets | Short term (≤ 2 years) |
| Source: Mordor Intelligence | |||
Shift to Fine-Pixel-Pitch Indoor Walls in GCC Control Rooms
Fine-pixel-pitch displays below 1.5 mm now dominate new GCC control room specifications, replacing tiled LCD walls in energy, transport, and security hubs. Saudi Arabia and the UAE allocated sizable portions of their USD 15 billion annual digital-infrastructure budgets to bezel-free visualization suites that show multiple data streams in real time. Over 60% of control room tenders released in 2024 required direct-view LED, citing 22% lower five-year total cost of ownership compared with legacy solutions.[1]Unilumin Group, “Top LED Display Manufacturers,” unilumin.com The premium is justified by operational clarity, noise reduction, and the elimination of seams that obscure critical data. Integration services remain a bottleneck, so vendors are embedding auto-alignment and remote calibration to shorten commissioning cycles.
Rapid Adoption of Digital-Out-of-Home Advertising in Tier-2 Chinese Cities
DOOH networks in China posted USD 7.4 billion in 2024 spend, and tier-2 cities already contribute 38% of that outlay.[2]Samsung Electronics, “Commercial Displays,” samsung.com Advertisers value AI-driven audience analytics that raise campaign effectiveness 27% compared with static boards. Lower site rents and streamlined local approvals unlock faster rollouts than in saturated tier-1 markets. Display suppliers report double-digit signage growth, helped by falling pixel-pitch prices and modular frames that simplify rooftop and street-level mounting. Scaling momentum is also spilling over to Southeast Asian metros where Chinese media investors replicate proven operating models.
Stadium-Scale LED Megascreens Driving U.S. Sports Fan Engagement
NBA and NFL venues now feature 10,000-square-foot canvases exceeding 20 million pixels.[3]Daktronics Inc., “Sports Market Solutions,” daktronics.com Ribbon boards, façade wraps, and immersive entrances deliver 360-degree visuals that lift sponsor activation revenue 18-24% post-upgrade. Integrated wayfinding and emergency messaging cut staffing needs while enhancing crowd safety. Teams view digital infrastructure as a core asset, committing 12-15% of arena budgets to displays that support concert bookings and esports tournaments. European clubs follow suit, widening addressable demand for high-brightness, low-power modules compliant with broadcast flicker standards.
Surge in Traffic-Management Variable-Message Signs Across ASEAN Smart-City Corridors
The ASEAN Smart Cities Network prioritizes intelligent transport, triggering rapid LED VMS adoption that trims peak travel time 8-12% in pilot corridors.[4]ASEAN Secretariat, “ASEAN Smart Cities Network,” asean.org Singapore’s AI-directed road-sign platform sets the benchmark, leading Malaysia, Thailand, and Indonesia to roll out 3-6 mm pixel units on urban arterials. Integrated traffic sensors and LTE backhaul support real-time alerts, while rental finance models offset upfront capital. Service revenues for content, maintenance, and diagnostics account for 45% of project value, prompting manufacturers to bundle software and managed services with hardware sales.
Restraints Impact Analysis*
| Restraint | (~) % Impact on CAGR Forecast | Geographic Relevance | Impact Timeline |
|---|---|---|---|
| High CapEx for Micro-LED Mass-Transfer Equipment | -0.6% | Global, with highest impact in East Asia manufacturing hubs | Medium term (2-4 years) |
| Supply Bottlenecks of Red & Green Micro Chips < 10 µm | -0.5% | Global, with concentrated impact on premium display segments | Short term (≤ 2 years) |
| Regulatory Limits on Digital-Signage Brightness in EU City Centers | -0.4% | Europe, with potential expansion to other developed markets | Long term (≥ 4 years) |
| Skilled-Installer Shortage in Sub-Saharan Africa | -0.3% | Sub-Saharan Africa, with spillover effects in emerging markets | Long term (≥ 4 years |
| Source: Mordor Intelligence | |||
High CapEx for Micro-LED Mass-Transfer Equipment
Commercial transfer tools cost USD 50–75 million per line, restricting Micro-LED scale-up to 12 global operators in 2024.[5]LG Electronics, “Information Display,” lg.comCurrent yields of 99.3% for 6,400-chip transfers remain shy of cost-effective mass production, delaying mainstream adoption. Innovations such as laser-induced forward transfer and fluidic assembly show promise by lowering per-unit capital intensity, yet factory conversions will take several planning cycles. Consequently, manufacturers allocate Micro-LED output to ultra-premium products where superior brightness and contrast warrant higher pricing.
Supply Bottlenecks of Red and Green Micro Chips Sub 10 µm
Quantum efficiency drops sharply when red emitters shrink below 10 µm, creating shortages that impede high-density display production. Industry leaders explore ultraviolet emitters with phosphor conversion and vertically stacked diodes to sidestep material limits.[6]Nitride Semiconductors, “Micro-LED Technology Updates,” nitride.co.jp Quantum-dot color filters are another mitigation route, though stability testing remains underway. These workarounds are easing pressure on augmented-reality and luxury television projects, yet a complete resolution is unlikely before mid-term production cycles.
*Our forecasts treat driver/restraint impacts as directional, not additive. The impact forecasts reflect baseline growth, mix effects, and variable interactions.
Segment Analysis
By Installation Type: Rental Momentum Reshapes Buyer Priorities
The fixed segment generated 62.35% of 2025 revenue, driven by permanent retail, corporate, and control-room deployments that specify sub-2.9 mm resolutions. The LED display market continues to see high utilization of these units because multi-source dashboards and brand walls demand seamless visuals. Conversely, rental and mobile solutions will add 6.78% CAGR through 2031 as live events, trade shows, and hybrid corporate meetings rebound. Tool-free frames now reduce set-up labor 40% and incorporate auto-calibration that narrows quality gaps with permanent structures. Vendors also embed flight-case logistics and quick-lock connectors, supporting shorter project lead times and higher asset turns for rental operators.
Professional event planners increasingly prefer subscription models that convert capex to opex, aligning with the flexible nature of modern corporate gatherings. Technology suppliers track screen health remotely, minimizing on-site technician requirements amid skilled-labor shortages. These trends widen addressable demand, especially for pixel pitches below 2.9 mm that can present ultra-high-definition content even on temporary stages. As a result, the LED display market welcomes rental solutions as a frontline showcase for cutting-edge pixels that later transition into fixed installations.


By Display Type: Indoor Premium Uptake Intensifies
Outdoor systems retained 55.30% of revenue in 2025 based on brightness levels of 5,000–8,000 nits and ruggedized cabinets suited to advertising and transit hubs. Yet indoor units will secure a faster 6.5% CAGR through 2031. Fine pitches of ≤ 1.5 mm deliver bezel-free clarity that eclipses LCD videowalls in boardrooms, broadcast studios, and flagship retail venues. Surface treatments now suppress glare, while panel depths drop below 40 mm for flush wall integration.
Corporate real estate sponsors value such slim profiles that preserve floor space and align with contemporary workplace design. Smart-building sensors embedded in the cabinets further broaden the use case to occupancy analytics and environmental monitoring. These multifunctional benefits heighten the indoor business case, positioning the LED display market as a full-stack workplace solution rather than a pure visual medium.
By Technology: Micro-LED Captures High-Brightness Niches
Conventional SMD architectures retained 77.20% of 2025 shipments, benefiting from decades-long supply chains and proven reliability. Mini-LED adds mid-market flexibility, yet Micro-LED’s 8.75% forecast CAGR reflects rising appetite for performance extremes such as 10-million-nit green pixels that enable clear automotive head-up display. Laser lithography and wafer-level bonding promise future cost deflation, but near-term output remains skewed to luxury home cinema, aerospace cockpits, and augmented-reality wearables.
The ecosystem now resembles a tiered pyramid. SMD fulfills broad commercial rollouts, Mini-LED addresses premium mid-tier signage, and Micro-LED defines pinnacle applications where power efficiency and contrast overshadow price sensitivity. As yields improve, the LED display market size for Micro-LED products is likely to widen beyond prestige niches, expanding addressable revenues across automotive, defense, and specialty retail environments.
By Pixel Pitch: ≤ 1.5 mm Displays Cross the Adoption Chasm
The 3-6 mm class held 46.55% of revenue in 2025, balancing cost and resolution for billboards and transport signs. However, panels at and below 1.5 mm will climb 8.21% CAGR, entering lobbies and production studios where short viewing distances demand pixel density. Growth accelerated when Chip-on-Board encapsulation improved impact resistance without sacrificing color uniformity, opening use cases in interactive touch walls.
Market forecasts indicate that the LED display market size tied to P1.2–P1.6 modules will expand at 32% annually, while sub-P1.1 modules could grow 62% on similar timelines. Vendors compete on automated epoxy coatings, driver integration, and protective masks that allow accidental contact during interactive sessions. With premium rates sustaining margins, fine-pitch capacity is a prime target for capital allocation within leading factories.
By Color Display: Tricolor Format Wins Smart-City Specs
Full-color systems accounted for 68.40% of 2025 revenue, powered by media façades, retail walls, and entertainment venues requiring photo-real fidelity. Tricolor designs—typically red, amber, green—trail in share yet expand 7.95% CAGR because traffic management codes favor simplified color semantics. Recent generations achieve higher brightness and contrast, improving message legibility by 15-20% versus monochrome predecessors.
In ASEAN smart-city deployments, tender documents now prescribe minimum tricolor capability for variable message signs. This regulatory push steadily enlarges the LED display market for tricolor arrays, particularly along expressways and bus rapid transit corridors. Cost savings over full-color configurations help cities stretch limited budgets while still meeting safety and congestion targets.
By Screen Size: Sub-10 m² Panels Proliferate
The 10–50 m² bracket held 51.30% of revenue in 2025, serving medium billboards and transit halls. Panels below 10 m² will log a 6.97% CAGR, reflecting retail chains, university auditoriums, and conference rooms adopting all-in-one LED kits that rival LCD walls. Integrated processors, speakers, and wireless casting remove external boxes, cutting installation time and maintenance visits.
Retailers embrace these compact canvases for merchandise storytelling near point of sale, while corporate users deploy ultrawide aspect ratios suited to simultaneous video conferencing and data visualization. With foldable frames simplifying transport, integrators can maneuver panels through standard doorways without structural modifications, broadening suitability across legacy buildings.
By Application: Transportation Signage Accelerates Digital Transformation
Advertising and media delivered 43.35% of 2025 revenue, underpinned by the continued digitization of static inventory. Transportation and traffic control will outpace with 6.86% CAGR to 2031. Authorities integrate variable-message signs with CCTV feeds, weather services, and emergency networks, creating multi-purpose assets that justify higher procurement budgets. Rugged IP-rated enclosures and redundant power modules minimize downtime critical for public safety.
Value migration extends to software layers encompassing predictive traffic modeling, content scheduling, and automated font scaling based on ambient light. Consequently, the LED display market evolves from a one-time hardware sale to a recurring platform model, where analytics and maintenance contracts deliver predictable post-sale revenue.
By End-Use Industry: Government and Defense Digitize Workflows
Commercial venues retained 57.40% of revenue in 2025 across retail, hospitality, and corporate usage. Government and defense, though smaller, will log 7.96% CAGR as agencies implement data-driven dashboards and city-level communication networks. Fine-pitch videowalls in command centers visualize multi-sensor feeds without bezel gaps, crucial for situational awareness. Outdoor civic screens feature tamper detection and encrypted content links to meet security mandates.
Public information networks now link to environmental sensors, with displays auto-triggering air-quality alerts and disaster warnings. Procurement departments increasingly request life-cycle energy data, pushing vendors to highlight lower wattage modules and recyclable materials. As such, the LED display market gains momentum in public infrastructure, triggering predictable pipeline visibility for suppliers accustomed to long tender cycles.
Geography Analysis
Asia Pacific generated 47.60% of global revenue in 2025 thanks to China’s dominance in production and domestic deployment. The region hosts roughly 80% of worldwide manufacturing capacity, enabling economies of scale that compress unit pricing while funding rapid R&D release cycles. China’s LED display market size is projected to reach 660 billion RMB in 2024, expanding at 15.79% annual compound growth, significantly ahead of global averages. Tier-2 Chinese cities fuel sustained DOOH rollouts, while India and Indonesia import economical modules for civic projects, further amplifying regional momentum.
North America and Europe remain centers of premium innovation. U.S. sports arenas, film production sets, and corporate lobbies anchor demand for Micro-LED, Mini-LED, and fine-pitch modules that meet broadcast-grade color accuracy. EU energy directives push manufacturers to optimize power consumption and recyclability, spurring breakthroughs in driver circuitry and recyclable aluminum chassis designs. Although shipment volumes lag Asia, average selling prices stay higher, securing substantial profit pools for vendors with advanced manufacturing know-how.
The Middle East and Africa region, though smaller, represents the fastest growth trajectory at 6.78% CAGR between 2026 and 2031. GCC states, particularly Saudi Arabia and the UAE, allocate sizeable capital to security control rooms, smart-city displays, and hospitality projects that double as national prestige landmarks. Philips Professional Display Solutions’ 2024 introduction of a full LED portfolio illustrates the region’s maturation as a viable commercial hub. African metros follow gradually, leveraging mobile network operators’ digital-out-of-home ambitions to leapfrog legacy static signage. Across these emerging markets, premium positioning and turnkey service offerings often outweigh price as the decisive selection criteria.

Competitive Landscape
The LED display market features a two-tier structure. Chinese conglomerates such as Leyard, Unilumin, and Absen command high-volume production, leveraging vertically integrated supply chains to minimize cost. Korean and Japanese groups, led by Samsung and Sony, channel resources into Micro-LED breakthroughs and specialized modules for broadcast, cinematography, and automotive segments. The top five suppliers collectively account for an estimated mid-40 percent of global revenue, evidence of progressive consolidation.
Strategic differentiation is shifting away from product breadth toward vertical specialization. Some vendors concentrate on rental-optimized frames, others pursue transparent façade panels or virtual production backdrops. Software integration grows in importance; remote diagnostics, audience analytics, and predictive maintenance cement longer-term client relationships while raising switching costs. Energy efficiency also defines the R&D agenda: Samsung’s latest Micro-LED line cuts power usage up to 40% relative to prior-generation SMD screens, a key competitive lever in European tenders with strict eco-design compliance.
Mergers, factory expansions, and joint ventures are reshaping capacity distribution. Unilumin boosted automated production by 30% in late 2024, while AOTO increased Mini-LED output to capture premium demand. Smaller regional brands pivot toward niche services, including creative content studios and on-site installation teams, recognizing that sheer scale alone is insufficient against multinational incumbents. Continuous innovation and channel partnerships therefore remain essential for sustaining share across the LED display market.
LED Display Industry Leaders
-
Planar Systems Inc.
-
LG Electronics Inc.
-
Sony Corporation
-
Panasonic Corporation
-
ViewSonic Corporation
- *Disclaimer: Major Players sorted in no particular order

Recent Industry Developments
- May 2025: ViewSonic launched its 27-inch ColorPro VP2788-5K monitor with Thunderbolt 4 connectivity, expanding professional display coverage.
- April 2025: Samsung Electronics introduced next-generation Micro-LED technology featuring higher brightness and lower power draw.
- March 2025: Leyard unveiled sub-0.7 mm pixel-pitch panels aimed at broadcast and control room usage.
- February 2025: LG demonstrated mechanical 3D LED without glasses at ISE 2025.
- February 2025: ViewSonic presented the world’s first rack-mount all-in-one LED control box and a third-generation foldable platform.


Research Methodology Framework and Report Scope
Market Definitions and Key Coverage
Our study treats the LED display market as the total revenue generated from factory-built direct-view display modules that use self-emissive light-emitting diodes to present visual content across indoor and outdoor venues, rental screens, video walls, and integrated smart-city street furniture. It includes conventional SMD, mini-LED, micro-LED, and chip-on-board variants sold as complete cabinets or panels, and the associated control electronics and power supplies.
Scope exclusion: Backlight units for LCD panels, discrete LED chips, and non-video illumination products are outside this definition.
Segmentation Overview
-
By Installation Type
- Fixed LED Display
- Rental/Mobile LED Display
-
By Display Type
- Outdoor LED Display
- Indoor LED Display
-
By Technology
- Conventional SMD LED
- Micro-LED
- Mini-LED
- OLED
- Chip-on-Board (COB) LED
-
By Pixel Pitch
- Sub and Up to 1.5 mm (Fine Pixel Pitch)
- 1.6 - 2.9 mm
- 3 - 6 mm
- Above 6 mm
-
By Color Display
- Monochrome
- Tricolor
- Full Color
-
By Screen Size
- Less than 10 Square Meter
- 10 - 50 Square Meter
- Above 50 Square Meter
-
By Application
- Advertising and Media
- Sports and Stadiums
- Transportation and Traffic Control
- Retail and Hospitality
- Corporate and Control Rooms
- Education and Healthcare
- Public Spaces and Smart-City Furniture
-
By End-use Industry
- Commercial
- Government and Defense
- Industrial
- Entertainment
-
By Geography
-
North America
- United States
- Canada
- Mexico
-
Europe
- Germany
- United Kingdom
- France
- Italy
- Spain
- Rest of Europe
-
Asia-Pacific
- China
- Japan
- South Korea
- India
- South East Asia
- Rest of Asia-Pacific
-
South America
- Brazil
- Rest of South America
-
Middle East and Africa
-
Middle East
- United Arab Emirates
- Saudi Arabia
- Rest of Middle East
-
Africa
- South Africa
- Rest of Africa
-
Middle East
-
North America
Detailed Research Methodology and Data Validation
Primary Research
To refine assumptions, we interview display integrators, LED packaging specialists, component suppliers, and advertising network operators across Asia-Pacific, North America, Europe, and the Middle East. Dialogs explore average selling prices, rental fleet utilization, fine-pitch adoption curves, and regional certification hurdles, which help us close data gaps and align model drivers with on-ground realities.
Desk Research
Mordor analysts first map the demand universe using freely accessible tier-1 sources such as UN Comtrade shipment codes, International Telecommunication Union digital-signage penetration briefs, World Bank urbanization statistics, the Outdoor Advertising Association of America, EU customs records, and patent libraries accessed via Questel. Company filings, investor decks, major press releases, and news archives from Dow Jones Factiva complement these datasets to benchmark vendor revenue splits and pixel-pitch price declines. The sources shown are illustrative; many additional documents support our evidence bank.
Market-Sizing & Forecasting
We begin with a top-down reconstruction of global screen area shipped, derived from production and trade data, which is then multiplied by blended ASPs segmented by pixel pitch. Results are cross-checked through selective bottom-up vendor roll-ups and channel checks to fine-tune totals. Key variables include corporate capex on digital signage, sport-venue refurbishment cycles, outdoor advertising spend, LED chip cost trajectories, and the share of sub-2 mm pitches. Forecasts rely on multivariate regression that links these indicators to shipment growth scenarios validated with our primary experts. Where supplier splits are opaque, proxy ratios from D&B Hoovers financials guide gap adjustments.
Data Validation & Update Cycle
Every draft model passes variance and anomaly checks against independent metrics before senior review. Updates are issued annually, with mid-cycle revisions triggered by material events such as steep ASP moves or major policy shifts, ensuring clients always receive the freshest view.
Why Mordor's LED Display Market Baseline Earns Trust
Published figures often diverge because analysts pick varied scope boundaries, pricing ladders, and refresh cadences.
By taking a full-value-chain view and refreshing numbers each year, Mordor delivers a balanced starting point for planning.
Benchmark comparison
| Market Size | Anonymized source | Primary gap driver |
|---|---|---|
| USD 19.67 B (2025) | Mordor Intelligence | - |
| USD 8.26 B (2024) | Regional Consultancy A | Tracks only modular indoor/outdoor screens, excludes control electronics and rental fleets |
| USD 9.35 B (2024) | Trade Journal B | Focuses solely on outdoor billboards, omits indoor corporate and stadium upgrades |
The comparison shows that narrower application lenses or missing component revenue pull other estimates far below ours. By marrying broad scope with transparent variable selection, Mordor Intelligence provides a dependable, reproducible baseline that decision-makers can confidently build upon.


Key Questions Answered in the Report
What is the current value of the LED display market?
The LED display market size is USD 20.73 billion in 2026 and is projected to reach USD 26.98 billion by 2031 at a 5.41% CAGR.
Which region leads global revenue?
Asia Pacific holds 47.60% of worldwide sales, supported by China’s dominant manufacturing base and rapid domestic deployments.
What segment is growing the fastest?
Micro-LED technology posts the highest forecast growth at 8.75% CAGR, driven by demand for superior brightness and efficiency in premium applications.
Why are fine-pixel-pitch panels gaining traction?
Pixel pitches of ≤ 1.5 mm deliver bezel-free clarity suited to corporate, broadcast, and control room environments, leading to an 8.21% CAGR outlook.
How are transportation agencies using LED displays?
Variable-message signs integrated with smart-city traffic systems improve congestion management and safety, making transportation signage the fastest expanding application at 6.86% CAGR.
What challenges limit Micro-LED mass adoption?
High capital expenditure for transfer equipment and limited supply of sub-10 µm red and green chips slow scale-up, although new assembly methods and quantum-dot color conversion are easing constraints.
Page last updated on:


