Holographic Display Market Size and Share
Market Overview
| Study Period | 2020 - 2031 |
|---|---|
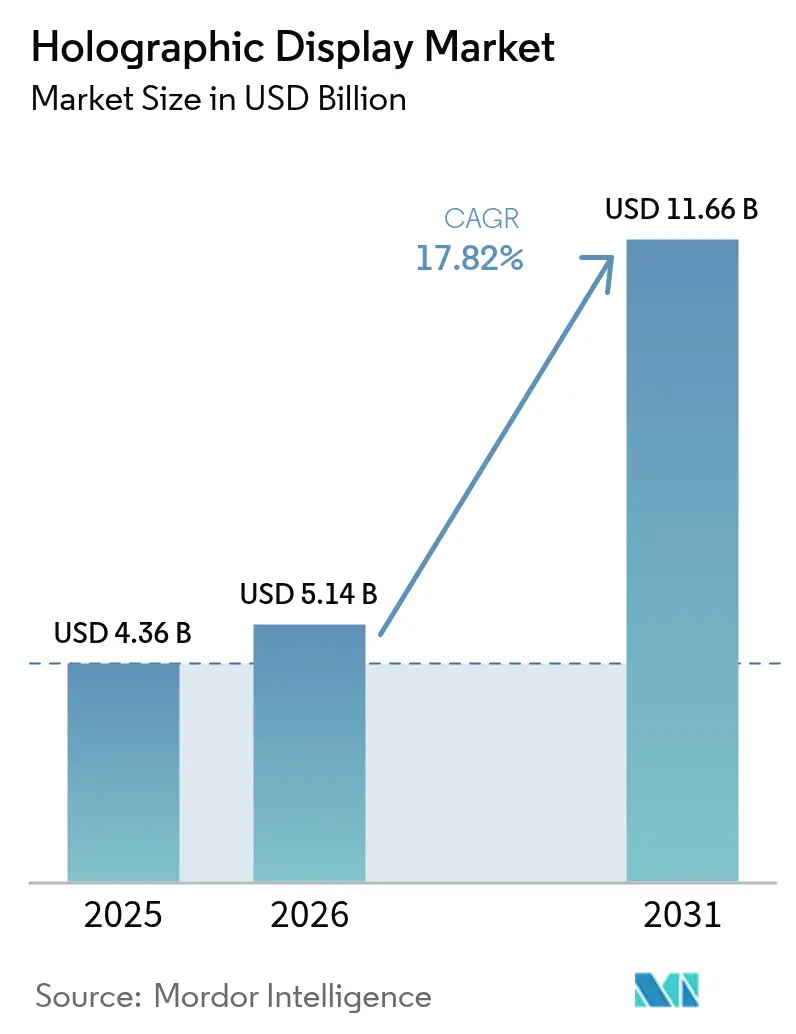
| Market Size (2026) | USD 5.14 Billion |
| Market Size (2031) | USD 11.66 Billion |
| Growth Rate (2026 - 2031) | 17.82% CAGR |
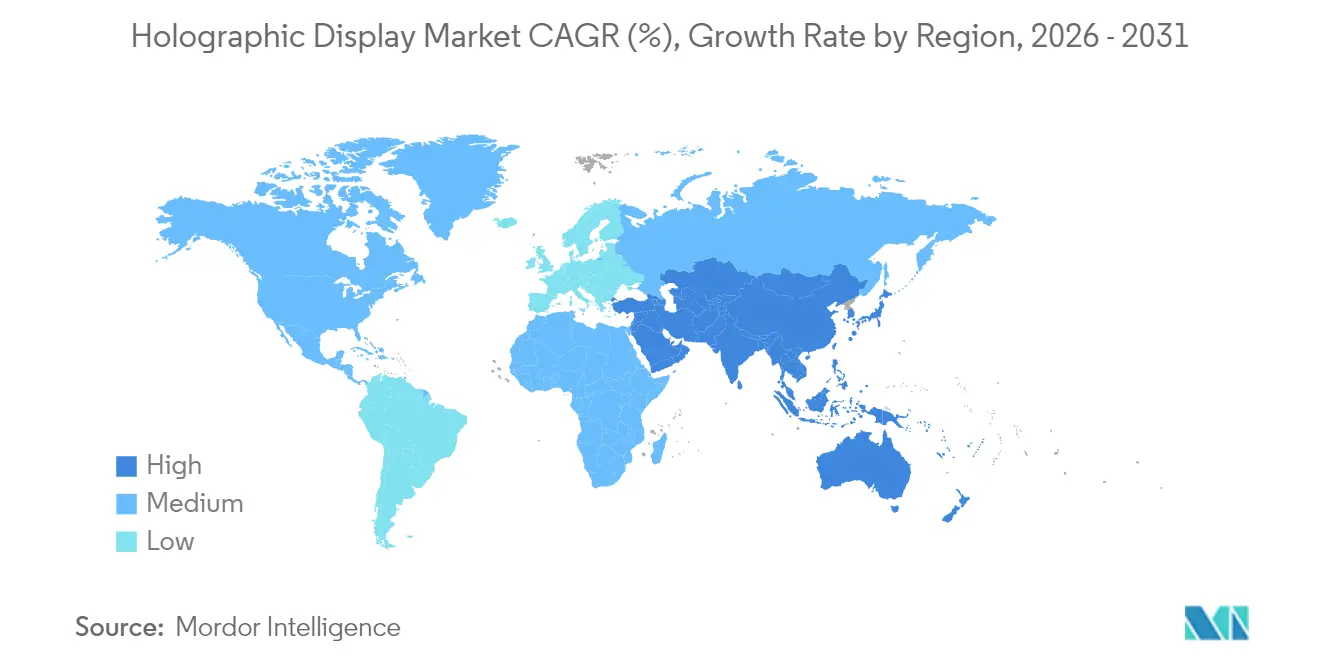
| Fastest Growing Market | Middle East |
| Largest Market | Asia |
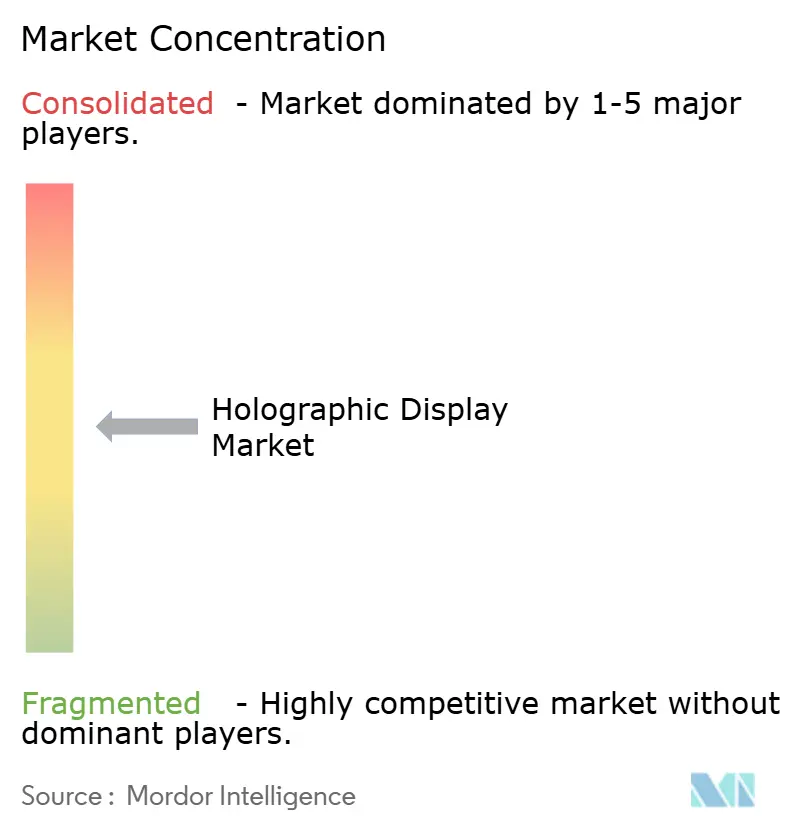
| Market Concentration | Medium |
Major Players *Disclaimer: Major Players sorted in no particular order Image © Mordor Intelligence. Reuse requires attribution under CC BY 4.0. | |
Holographic Display Market Analysis by Mordor Intelligence
holographic display market size in 2026 is estimated at USD 5.14 billion, growing from 2025 value of USD 4.36 billion with 2031 projections showing USD 11.66 billion, growing at 17.82% CAGR over 2026-2031. Robust demand stems from automotive premium brands rolling out augmented-reality head-up displays, tier-1 U.S. hospitals installing volumetric surgical suites, and luxury retailers adopting 360-degree signage. These use-cases signal a decisive move from research pilots to production roll-outs as micro-LED waveguide yields improve and AI-driven content engines cut creation costs. German and Chinese automakers account for the bulk of windshield deployments, while U.S. health providers accelerate 3D imaging purchases that shorten operating-room planning cycles. Asia continues to lead production scale and content innovation, whereas the Middle East’s retail sector delivers the fastest regional expansion. The convergence of optics, computing, and content creation underpins an ecosystem where enterprises can monetize immersive experiences and create durable competitive advantage.
Key Report Takeaways
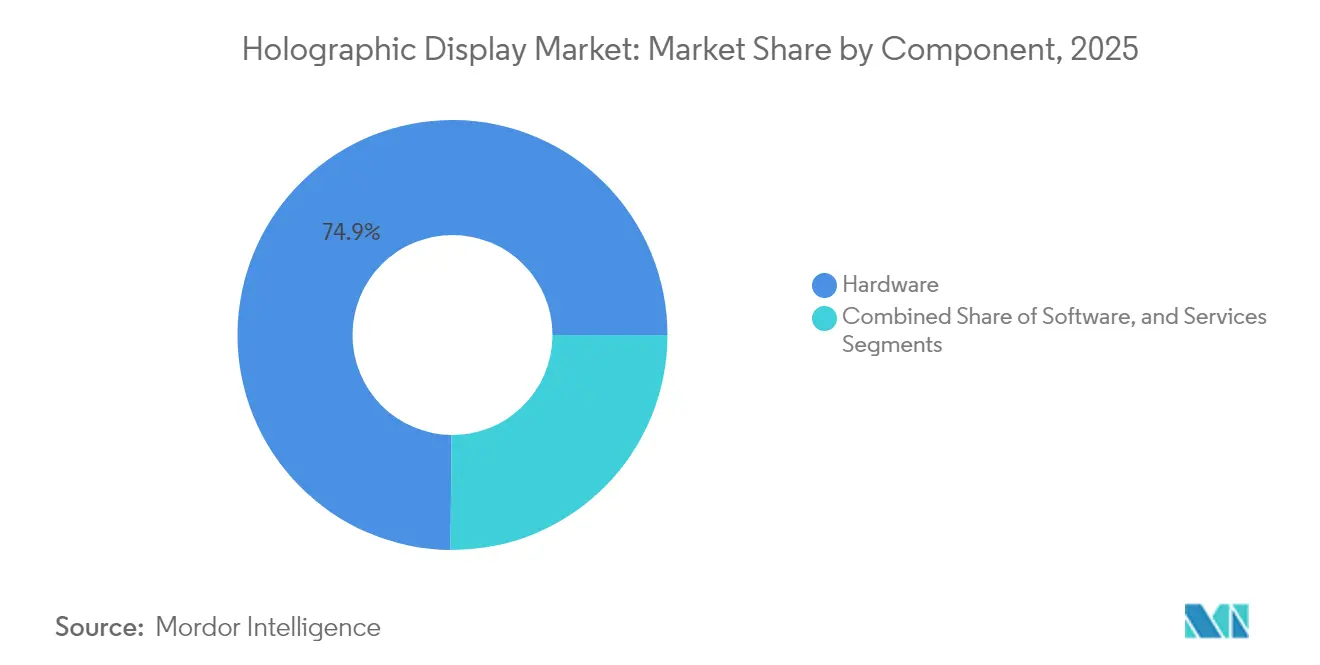
- By component, hardware held 74.85% of holographic display market share in 2025; services are forecast to grow at a 22.32% CAGR to 2031.
- By technology, electro-holographic solutions led with 40.25% revenue share in 2025, while touchable/mid-air haptic systems are projected to expand at a 24.05% CAGR.
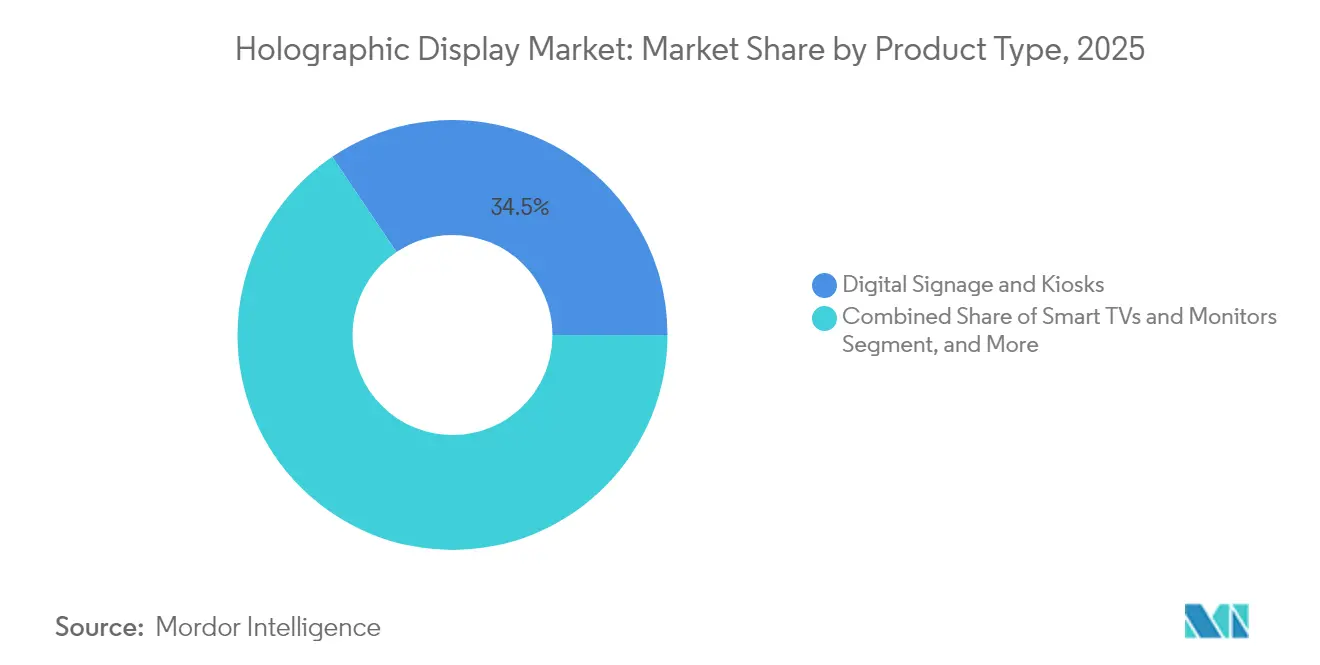
- By product type, digital signage and kiosks captured 34.45% of the holographic display market size in 2025; medical scanners and microscopes are advancing at a 24.62% CAGR through 2031.
- By end-user, retail and exhibition applications accounted for 28.75% revenue share in 2025; healthcare and medical education are set to grow at a 22.85% CAGR.
- By geography, Asia Pacific controlled 36.55% revenue in 2025; the Middle East is forecast to register the fastest regional CAGR at 21.18% through 2031.
Note: Market size and forecast figures in this report are generated using Mordor Intelligence’s proprietary estimation framework, updated with the latest available data and insights as of 2026.
Global Holographic Display Market Trends and Insights
Drivers Impact Analysis*
| Driver | (~) % Impact on CAGR Forecast | Geographic Relevance | Impact Timeline |
|---|---|---|---|
| Automotive OEM adoption of augmented-reality holographic HUDs | +3.20% | Germany, China, North America spillover | Medium term (2-4 years) |
| Deployment of volumetric 3D surgical-planning suites in U.S. tier-1 hospitals | +2.80% | North America, Europe, APAC | Short term (≤ 2 years) |
| Luxury retail chains in Middle-East malls pivoting to 360° holographic signage | +2.10% | Middle East, Asia Pacific | Medium term (2-4 years) |
| Live-event and streaming platforms monetizing hologram concerts | +1.90% | Japan, South Korea, global expansion | Long term (≥ 4 years) |
| Defense battlefield-visualization programs adopting holographic sand tables | +1.70% | United States, Israel, NATO | Long term (≥ 4 years) |
| AI-generated content engines lowering 3D hologram production costs | +2.40% | Global | Short term (≤ 2 years) |
| Source: Mordor Intelligence | |||
Automotive OEM adoption of augmented-reality holographic HUDs
German luxury marques and Chinese electric-vehicle brands are integrating full-windshield holographic head-up displays to differentiate premium trims and enhance driver situational awareness. Hyundai Mobis’ concept shown at CES 2025 projects navigation cues, alerts, and entertainment content across three viewing zones, and joint development with Zeiss targets mass production by 2027. Market forecasts suggest 7 million automotive units will ship by 2030, converting dashboard real estate into immersive AR canvases. [1]SPIE Europe, “Zeiss, Hyundai Mobis hook up on holographic windshield displays,” optics.org
Deployment of volumetric 3D surgical-planning suites in U.S. tier-1 hospitals
Hospitals are turning to true-depth holograms for oncology, cardiology, and orthopedics. RealView Imaging’s HOLOSCOPE-i enables surgeons to manipulate 3D anatomy in real time, trimming planning hours and reducing operating-room errors. Clinical studies show 61% preference for holographic plans over 2D methods, especially for non-coplanar radiotherapy beams.
Luxury retail chains in Middle-East malls pivoting to 360° holographic signage
Flagship boutiques deploy freestanding volumetric displays that rotate handbags, jewelry, and haute couture without physical handling. The region’s high disposable income, emphasis on in-store theatrics, and competitive leasing rates accelerate adoption, inspiring Asian malls to follow suit.
Live-event and streaming platforms monetizing hologram concerts
Japanese and Korean studios capture performers volumetrically and broadcast them into clubs or VR spaces. A field-programmable-gate-array hologram processor built by Korean researchers renders 4K holograms at 30 ms latency, letting ticket buyers experience lifelike shows without travel.
Restraints Impact Analysis*
| Restraint | (~) % Impact on CAGR Forecast | Geographic Relevance | Impact Timeline |
|---|---|---|---|
| Scarcity of mass-production micro-LED waveguides elevating BOM costs | -2.90% | Global, Asia manufacturing hubs | Short term (≤ 2 years) |
| Eye-safety and photobiological regulations limiting laser/plasma projection power | -1.80% | Europe, spillover to regulated markets | Medium term (2-4 years) |
| Geographic reliance on Japanese and Korean waveguide suppliers constrains scaling | -1.30% | Asia, North America OEMs | Short term (≤ 2 years) |
| Extended EU certification cycles delay product launches | -1.00% | Europe | Medium term (2-4 years) |
| Source: Mordor Intelligence | |||
Scarcity of mass-production micro-LED waveguides elevating BOM costs
Few fabs can achieve the nanoscale tolerances required for efficient waveguides, keeping prices 40-60% above LCD or OLED alternatives. Sample quotes for Sony’s 0.44-type Full HD OLED microdisplay exceed USD 260 (JPY 40,000), restricting consumer-device economics. [2]Sony Semiconductor Solutions, “0.44-Type Full HD OLED Microdisplay with Industry’s Smallest Pixels,” sony-semicon.com
Eye-safety and photobiological regulations limiting projection power
EU standards cap permissible laser energy, forcing automotive suppliers to add optical diffusers or reduce field-of-view, which raises cost and compromises brightness. Compliance testing extends development cycles, placing European vendors behind counterparts in less-restricted markets.
*Our forecasts treat driver/restraint impacts as directional, not additive. The impact forecasts reflect baseline growth, mix effects, and variable interactions.
Segment Analysis
By Component: Hardware Dominance Drives Service-Led Value
Hardware accounted for 74.85% of 2025 revenue, underscoring the capital intensity of spatial-light modulators, laser engines, and precision optics that underpin the holographic display market. Projectors, optical waveguides, and microdisplay engines remain cost drivers, yet falling component prices will push the hardware share of the holographic display market size down modestly by the decade’s close. Services already command the fastest 22.32% CAGR as enterprises look for turnkey deployment, calibration, and lifecycle support agreements. Integration specialists bundle on-premises installation, cloud rendering, and training, converting one-off device sales into multi-year contracts. Healthcare networks specify service-level agreements that guarantee uptime for surgical planning suites, while automakers outsource optical system alignment to tier-1 suppliers. The holographic display market is therefore shifting from hardware margin dependency to attached-service annuities.
In parallel, software stacks add real-time rendering, AI-assisted content creation, and analytics, layering subscription revenue atop physical equipment. The trend mimics earlier transitions in the projection and signage industries, where content-management platforms became indispensable. As volumetric streaming proliferates, bandwidth optimization and security patches will further enlarge the services opportunity. Hardware vendors now incubate internal professional-services groups or ally with systems integrators, ensuring tight coupling between optics, firmware, and managed content—an approach that strengthens ecosystem lock-in across the holographic display industry.


By Technology: Electro-Holographic Leads, Haptics Accelerate
Electro-holographic architectures captured 40.25% revenue in 2025 thanks to mature liquid-crystal-on-silicon and reflective spatial-light-modulator supply chains. Stable yields and established design toolsets make the format the safe choice for automotive HUDs and medical scanners, sustaining its lead in the holographic display market. Meanwhile, haptic mid-air systems clock a 24.05% CAGR as developers combine phased-array ultrasounds with volumetric visuals to let users “touch” floating interfaces. Retail podiums that permit gesture-based product rotation and hospital displays allowing sterile interaction exemplify commercial traction.
Laser/plasma projection solutions target extreme-brightness scenarios such as open-air stage shows and dashboard sunlit conditions, while semi-transparent waveguides serve AR smart-glasses. Metasurface optics unveiled by POSTECH help correct chromatic aberration, simplifying color management and slimming device profiles. Acoustic and photon-trap research lines could redefine efficiency, yet commercialization sits beyond the current forecast horizon. Overall, incumbent electro-holographic vendors must innovate on power, resolution, and interaction to fend off fast-rising haptic challengers in the holographic display market.
By Product Type: Medical Scanners Outpace Signage
Digital signage and kiosks contributed 34.45% of 2025 revenue as malls, airports, and exhibitions sought immersive visuals to boost footfall. Yet hospital scanners and microscopes register the highest 24.62% CAGR, reflecting clinical validation and reimbursement momentum. The holographic display market size for medical scanners is forecast to climb alongside surgical hub modernization budgets through 2031. Automotive HUDs form the second-fastest pool as windshield-wide overlays shift navigation data into the driver’s natural sightline. Full-color, full-FOV prototypes demonstrated at CES 2025 confirm optical readiness for fleet roll-outs.
Smart TVs, monitors, and smart-phones remain nascent because battery drain and content scarcity cool consumer adoption. Cameras and smart-glasses are farther along: Qualcomm’s Snapdragon AR1 enables tethered glasses that render low-latency holograms by off-loading compute to smartphones. As manufacturing scale improves, home entertainment may later eclipse signage. For now, high-value medical and automotive implementations steer product-mix expansion within the holographic display market.
By End-User: Healthcare Gains on Retail Leadership
Retail and exhibition venues held 28.75% revenue in 2025, banking on holographic storefronts to distinguish in-person shopping from e-commerce. Engagement analytics show dwell-time lifts of up to 40%, reinforcing ROI for flagship chains in Asia and the Middle East. Healthcare, however, is growing faster at 22.85% because surgeons value true-depth visualization that cuts operating-room time, and administrators appreciate remote consultation boxes that improve specialist access.
Media and entertainment continue to expand via hologram concerts that livestream deceased or virtual artists into multiple venues simultaneously. Automotive deployment quickens as ADAS stacks migrate to AR dashboards, while defense users invest in volumetric sand tables for mission rehearsal. Industrial, education, and consumer electronics segments trail but are positioned to benefit once component costs normalize. Collectively, these patterns show healthcare closing the gap with retail to become a co-anchor end-market for the holographic display market.
Geography Analysis
Asia Pacific generated 36.55% of 2025 revenue, leveraging China’s electric-vehicle boom, Japan’s entertainment tech, and South Korea’s semiconductor ecosystem. Public-private programs funnel incentives into micro-LED backplanes and metasurface optics, fortifying regional supply dominance. The holographic display market size attributed to Asia Pacific also benefits from dense retail deployments in Tokyo, Seoul, and Shanghai. Europe follows with automotive design wins but faces brightness restrictions that temper growth, although collaborations such as Zeiss-Hyundai sustain innovation pipelines.
North America exhibits steady momentum anchored by U.S. tier-1 hospitals that upgrade surgical visualization suites and defense agencies procuring volumetric mission-planning tables. Canada’s live-event promoters experiment with hologram festivals, extending market reach. The Middle East posts the highest 21.18% CAGR through 2031 as luxury malls in Dubai, Riyadh, and Doha invest heavily in 360-degree holographic showcases that elevate brand storytelling. Government smart-city initiatives in Abu Dhabi and Neom foster further experimentation.
Latin America and Africa remain early-stage, constrained by import duties and bandwidth limitations, yet pilot projects in São Paulo retail and South African mining visualization hint at downstream expansion. Global supply chains nonetheless route critical waveguide fabrication through Japan and South Korea, exposing all regions to potential bottlenecks, a factor that stakeholders across the holographic display market monitor closely for risk mitigation.

Competitive Landscape
Roughly two dozen active vendors participate, yielding moderate fragmentation. Electronics giants such as Samsung, Sony, LG, and Sharp leverage display know-how and manufacturing muscle, whereas pure-plays like Looking Glass Factory, RealFiction, and RealView Imaging pursue niche breakthroughs. Competitive advantage accrues to firms that marry optics fabrication with software rendering pipelines, as Samsung’s metasurface collaboration with POSTECH demonstrates. Qualcomm’s tie-up with Google and Samsung for Snapdragon-based smart-glasses showcases cross-value-chain alliances aimed at shortening time-to-market.
Patent filings cluster around waveguide designs, foveated rendering, and mid-air haptics. Sony’s recent disclosures promise higher diffraction efficiency and environmental durability—critical for eyewear form factors. Start-ups exploit white spaces: RealView’s medical focus secures hospital budgets, while the Public University of Navarra’s elastic diffuser prototype opens new interaction paradigms. Industry watchers anticipate M&A as incumbent display makers acquire specialized optics houses to secure IP and scale.
Government R&D grants and university spin-offs add another competitive layer, funneling breakthroughs into the commercial arena. The resulting ecosystem complexity makes platform openness, standards compliance, and channel partnerships decisive. Stakeholders that lock in automotive or medical design slots early gain recurring revenue and data network effects, shaping future winner-take-most trajectories within the holographic display industry.
Holographic Display Industry Leaders
MDH Hologram Ltd
Looking Glass Factory Inc.
Provision Holding Inc.
Realview Imaging Ltd
RealFiction Holding AB
- *Disclaimer: Major Players sorted in no particular order

Recent Industry Developments
- May 2025: Samsung Electronics and POSTECH publish achromatic metalens research in Nature Materials to correct color dispersion in waveguides, improving image fidelity for XR wearables.
- March 2025: Korean researchers unveil a field-programmable-gate-array hologram processor rendering 4K frames at 30 ms latency, paving the way for live hologram concerts.
- January 2025: Hyundai Mobis debuts the first full-windshield holographic HUD at CES, with three simultaneous display zones and 2027 production targets.
- October 2024: Zeiss and Hyundai Mobis formalize a partnership to co-develop panoramic automotive holographic displays, eyeing 7 million units by 2030.


Global Holographic Display Market Report Scope
A holographic display reflects digital material through glass coated with a specific coating, known as glass optics, using a high-definition or 4K screen. When positioned at a specific angle, the glass optic will produce an optical illusion that causes the consumer's brain to see the digital information as three-dimensional.
The holographic display market is segmented by end-user (consumer electronics, retail, media and entertainment, military and defense, healthcare, automotive, and other end-user verticals) and geography (North America, Europe, Asia Pacific, and Rest of the world). The market sizes and forecasts are provided in terms of value (USD) for all the above segments.
| Hardware | Spatial Light Modulators (SLM) |
| Projectors and Laser Engines | |
| Optical/Lens Modules | |
| Sensors and Cameras | |
| Others | |
| Software | |
| Services | Integration and Consulting |
| Support and Maintenance |
| Electro-Holographic |
| Touchable/Mid-Air Haptic |
| Laser/Plasma |
| Semi-Transparent |
| Other Emerging (Acoustic, Photon-Trap) |
| Digital Signage and Kiosks |
| Smart TVs and Monitors |
| Cameras and Smart Glasses |
| Medical Scanners and Microscopes |
| HUDs and Windshield Displays |
| Smartphones and Tablets |
| Others |
| Consumer Electronics |
| Retail and Exhibition |
| Media, Entertainment and Live Events |
| Healthcare and Medical Education |
| Automotive and Transportation |
| Military, Defense and Aerospace |
| Industrial and Manufacturing |
| Education and Training |
| North America | United States | |
| Canada | ||
| Mexico | ||
| Europe | Germany | |
| United Kingdom | ||
| France | ||
| Nordics | ||
| Rest of Europe | ||
| South America | Brazil | |
| Rest of South America | ||
| Asia-Pacific | China | |
| Japan | ||
| India | ||
| South-East Asia | ||
| Rest of Asia-Pacific | ||
| Middle East and Africa | Middle East | Gulf Cooperation Council Countries |
| Turkey | ||
| Rest of Middle East | ||
| Africa | South Africa | |
| Rest of Africa | ||
| By Component | Hardware | Spatial Light Modulators (SLM) | |
| Projectors and Laser Engines | |||
| Optical/Lens Modules | |||
| Sensors and Cameras | |||
| Others | |||
| Software | |||
| Services | Integration and Consulting | ||
| Support and Maintenance | |||
| By Technology | Electro-Holographic | ||
| Touchable/Mid-Air Haptic | |||
| Laser/Plasma | |||
| Semi-Transparent | |||
| Other Emerging (Acoustic, Photon-Trap) | |||
| By Product Type | Digital Signage and Kiosks | ||
| Smart TVs and Monitors | |||
| Cameras and Smart Glasses | |||
| Medical Scanners and Microscopes | |||
| HUDs and Windshield Displays | |||
| Smartphones and Tablets | |||
| Others | |||
| By End-User | Consumer Electronics | ||
| Retail and Exhibition | |||
| Media, Entertainment and Live Events | |||
| Healthcare and Medical Education | |||
| Automotive and Transportation | |||
| Military, Defense and Aerospace | |||
| Industrial and Manufacturing | |||
| Education and Training | |||
| By Geography | North America | United States | |
| Canada | |||
| Mexico | |||
| Europe | Germany | ||
| United Kingdom | |||
| France | |||
| Nordics | |||
| Rest of Europe | |||
| South America | Brazil | ||
| Rest of South America | |||
| Asia-Pacific | China | ||
| Japan | |||
| India | |||
| South-East Asia | |||
| Rest of Asia-Pacific | |||
| Middle East and Africa | Middle East | Gulf Cooperation Council Countries | |
| Turkey | |||
| Rest of Middle East | |||
| Africa | South Africa | ||
| Rest of Africa | |||


Key Questions Answered in the Report
What is the current size of the holographic display market?
The market stands at USD 5.14 billion in 2026 and is projected to reach USD 11.66 billion by 2031, reflecting an 17.82% CAGR.
Which region grows the fastest?
The Middle East posts the highest 21.18% CAGR through 2031, driven by luxury retail investments in 360-degree holographic signage.
Which component segment expands the quickest?
Services grow at a 22.32% CAGR because enterprises seek turnkey integration, maintenance, and content-management support.
Why are hospitals adopting holographic displays?
Volumetric imaging improves surgical planning accuracy and enables life-size remote consultations, leading to measurable clinical outcomes and broader specialist access.
What hampers wider consumer adoption?
High bill-of-materials costs for micro-LED waveguides and stringent laser-safety regulations in some regions keep retail prices elevated for mass-market devices.
How fragmented is the competitive landscape?
With more than 20 active players and no single firm exceeding 20% revenue, the market exhibits moderate fragmentation but shows signs of partnership-driven consolidation.
Page last updated on:


