Phytonutrients Market Size and Share
Market Overview
| Study Period | 2021 - 2031 |
|---|---|
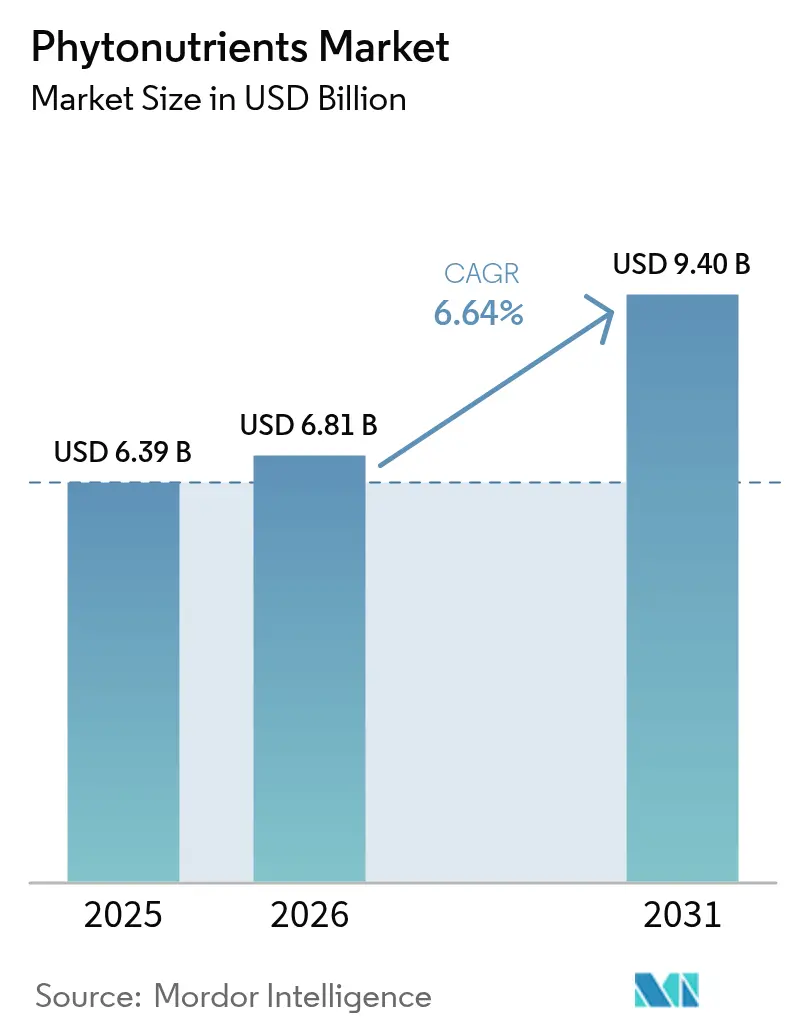
| Market Size (2026) | USD 6.81 Billion |
| Market Size (2031) | USD 9.4 Billion |
| Growth Rate (2026 - 2031) | 6.64% CAGR |
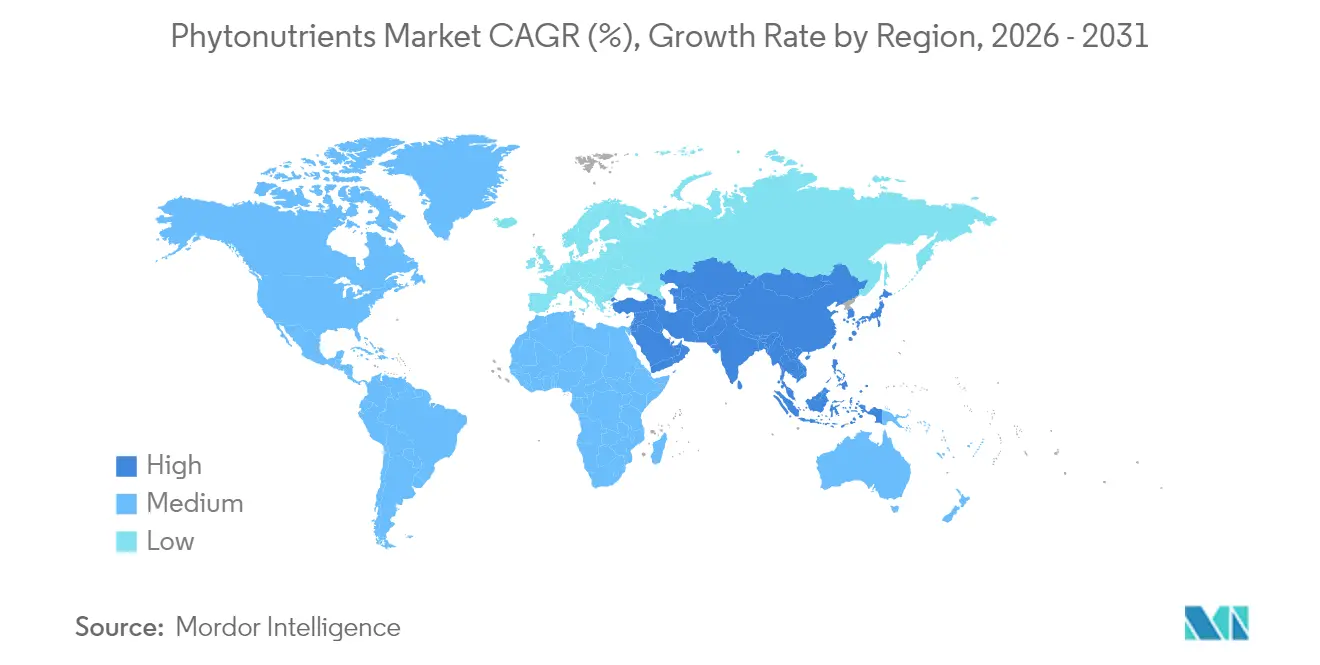
| Fastest Growing Market | Asia Pacific |
| Largest Market | North America |
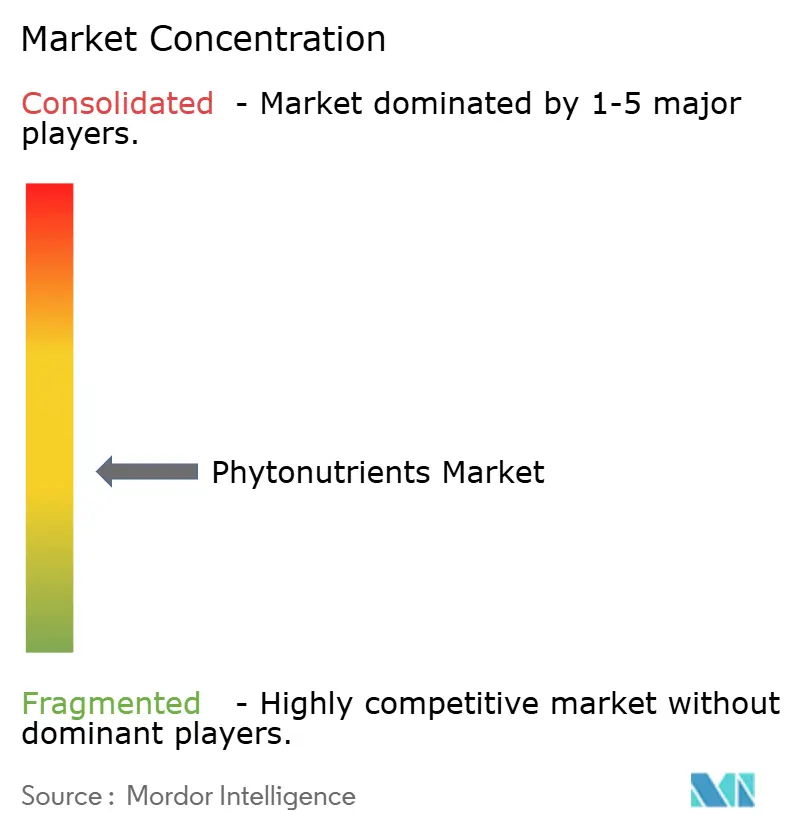
| Market Concentration | Medium |
Major Players *Disclaimer: Major Players sorted in no particular order Image © Mordor Intelligence. Reuse requires attribution under CC BY 4.0. | |
Phytonutrients Market Analysis by Mordor Intelligence
The phytonutrients market size is expected to grow from USD 6.39 billion in 2025 to USD 6.81 billion in 2026 and is forecast to reach USD 9.4 billion by 2031 at 6.64% CAGR over 2026-2031. Growth stems from three converging forces: consumers now equate “natural” with “healthy,” regulators continue to remove synthetic additives from approved lists, and extraction technologies such as supercritical CO₂ and solvent-free fermentation are lowering production costs. February 2025 FDA[1]Source: U.S. Food & Drug Administration, “Food Labeling: Nutrient Content Claims; Definition of Term ‘Healthy’,” fda.gov rules that redefine “healthy” prepared foods around nutrient density rather than single nutrients open new label-claim pathways for products fortified with phytonutrients. Meanwhile, fresh approvals of butterfly pea flower and Galdieria extract blue colorants signal official support for plant-derived ingredients. Intensifying chronic-disease burdens accelerate scientific and commercial interest in polyphenols, carotenoids, and phytosterols for preventive health, while animal-feed manufacturers adopt complex phytonutrient blends to improve gut barrier function and growth performance in livestock
Key Report Takeaways
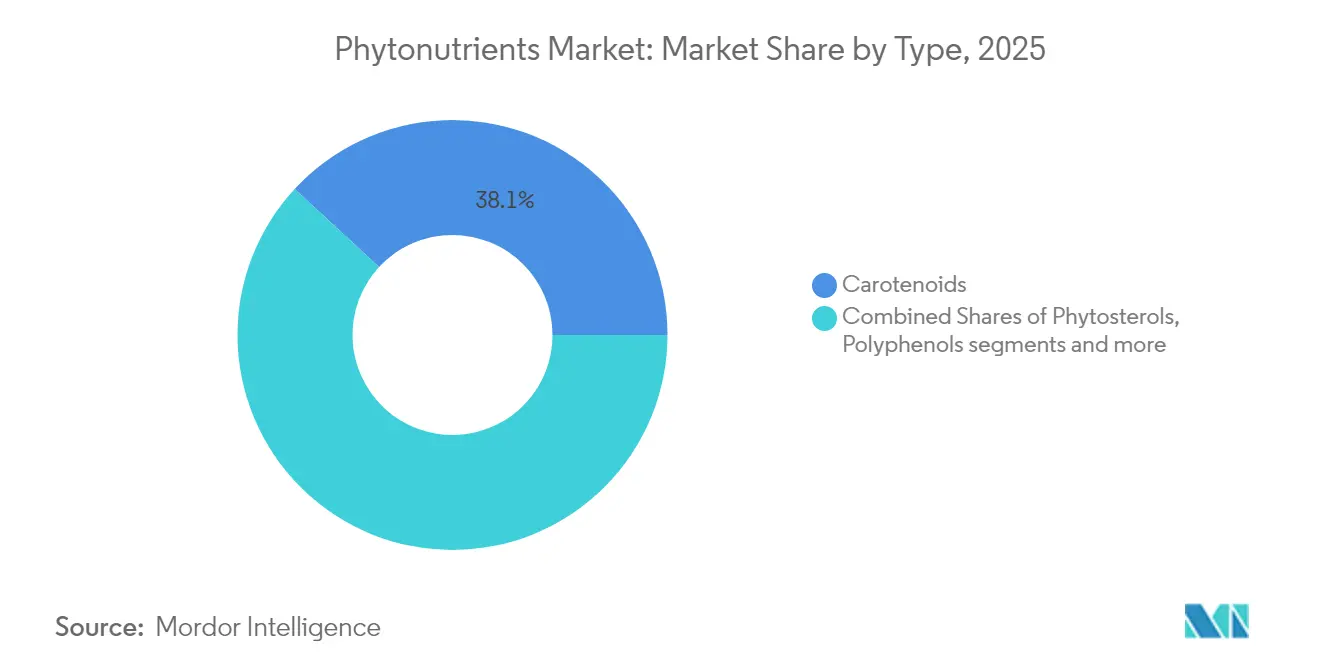
- By type, carotenoids held 38.12% of the phytonutrients market share in 2025; polyphenols are set to rise at a 9.39% CAGR through 2031.
- By source, fruits and vegetables commanded a 53.21% share of the phytonutrients market size in 2025, whereas herbs and trees will advance at an 8.33% CAGR over 2026-2031.
- By form, powders accounted for 65.12% of the phytonutrients market share in 2025; liquid forms are forecast to grow at a 9.32% CAGR through 2031.
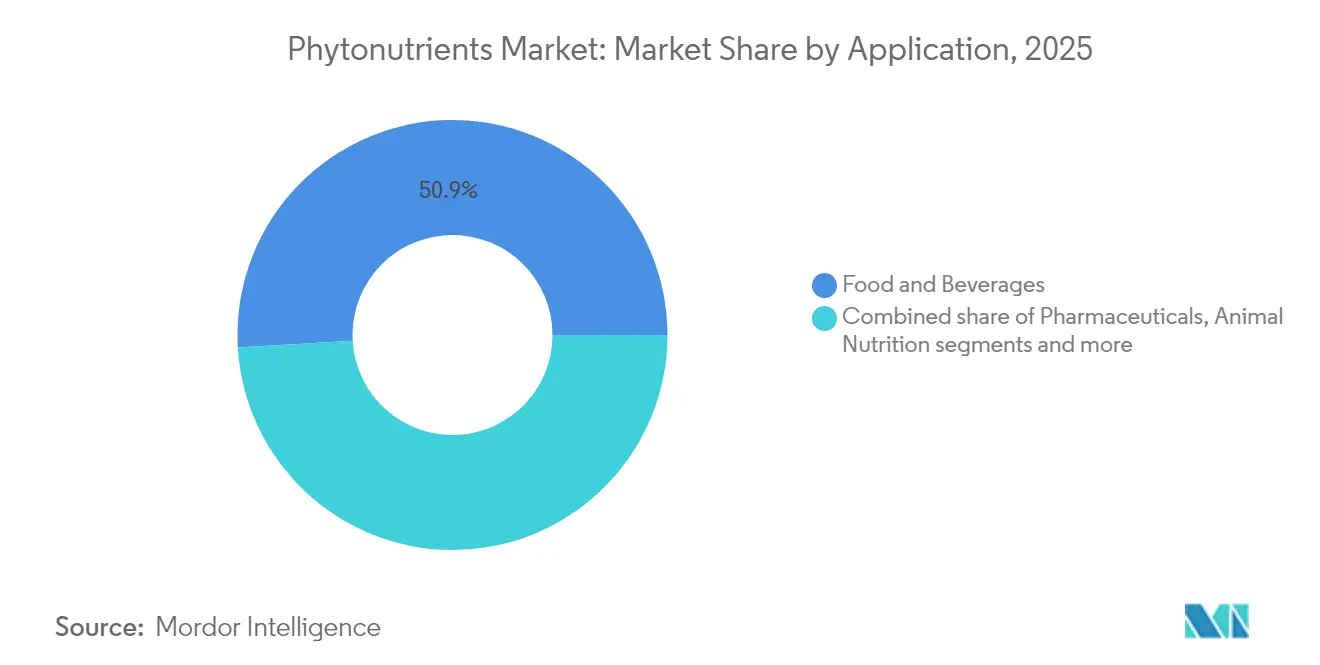
- By application, food and beverages led with 50.92% market share in 2025; pharmaceuticals will post the fastest 10.32% CAGR between 2026-2031.
- By geography, North America led with a 41.22% of the phytonutrients market share in 2025, while Asia-Pacific is projected to expand at an 8.52% CAGR through 2031.
Note: Market size and forecast figures in this report are generated using Mordor Intelligence’s proprietary estimation framework, updated with the latest available data and insights as of 2026.
Global Phytonutrients Market Trends and Insights
Drivers Impact Analysis*
| Drivers | (~) % Impact on CAGR Forecast | Geographic Relevance | Impact Timeline |
|---|---|---|---|
| Surging demand for clean-label food and beverage fortification | +1.2% | Global, with strongest impact in North America and Europe | Medium term (2-4 years) |
| Heightened consumer awareness about preventive healthcare and wellness | +1.5% | Global, led by developed markets, expanding to Asia-Pacific | Long term (≥ 4 years) |
| Rising prevalence of chronic diseases and health conditions | +0.9% | Global, with acute impact in aging populations of North America, Europe, Japan | Long term (≥ 4 years) |
| Accelerating demand for immunity-boosting products | +0.8% | Global, post-pandemic sustained demand | Short term (≤ 2 years) |
| Increasing demand for natural and plant-based ingredients in food products | +1.1% | Global, strongest in North America and Europe, growing in Asia-Pacific | Medium term (2-4 years) |
| Integration of phytonutrients in animal feed | +0.7% | Global, with early adoption in developed livestock markets | Medium term (2-4 years) |
| Source: Mordor Intelligence | |||
Surging Demand for Clean-Label Food and Beverage Fortification
The FDA's delisting of Red Dye No. 3 for food applications in 2024 prompted manufacturers to reformulate their products with natural alternatives. Food and beverage companies are increasingly incorporating natural color ingredients such as spirulina, beetroot red, and carotenoids to meet their branding, regulatory, and sensory requirements. Manufacturers have successfully offset the increased raw material costs through retail price premiums of 12-15% in 2025. The implementation of advanced extraction methods, particularly natural deep eutectic solvents, has achieved yield improvements exceeding 10% compared to traditional ethanol processes while supporting sustainability goals. The industry's transition toward clean-label ingredients has evolved significantly from a specialized market segment to become a primary consumer consideration, which continues to support sustained growth in the phytonutrients market. This shift reflects broader consumer preferences for natural ingredients and transparency in food products.
Heightened Consumer Awareness About Preventive Healthcare and Wellness
Growing awareness of preventive healthcare has increased consumer demand for phytonutrient-enriched products across all demographics. This shift reflects a broader transformation in health consciousness, where consumers actively seek natural compounds for their wellness routines. Research demonstrating phytonutrients' effects on inflammation and immune function has provided scientific validation that appeals to consumers seeking evidence-based health solutions. Multiple clinical studies have shown these compounds can help regulate various biological processes and support overall health maintenance. Advanced delivery systems like phytosomes improve the absorption of phytonutrients, meeting consumer requirements for effective products and supporting higher price points. These technological improvements have enabled manufacturers to develop more efficient formulations that maximize the therapeutic potential of plant-based compounds while ensuring better bioavailability.
Rising Prevalence of Chronic Diseases and Health Conditions
Government funding supports clinical trials of curcumin, sulforaphane, and other phytochemicals for cancer and cardiometabolic conditions, validating their therapeutic potential, according to the National Cancer Institute[2]Source: National Cancer Institute, “Natural Products for Cancer Prevention Research,” cancer.gov. These trials are essential in establishing the efficacy and safety profiles of natural compounds in treating various diseases. Advanced nano-encapsulation technology enables controlled release of these compounds, with some combinations achieving LDL-cholesterol reduction comparable to pharmaceutical drugs. This technological advancement has significantly improved the bioavailability and effectiveness of natural compounds. The FDA's streamlined procedures for new dietary ingredients have reduced regulatory delays in product development, allowing companies to bring innovative products to market more efficiently. Following patent expirations of conventional statins and blood pressure medications, pharmaceutical companies are developing phytonutrient combinations to maintain revenue streams, indicating increased integration between nutritional and pharmaceutical approaches. This convergence represents a significant shift in the pharmaceutical industry's strategy toward incorporating natural compounds into their product portfolios.
Accelerating Demand for Immunity-Boosting Products
Post-pandemic immunity consciousness has created sustained demand for phytonutrient-based immune support products, extending beyond traditional seasonal patterns. The approval of new food ingredients, including microalgae oil and proanthocyanidins in China's health food regulations, demonstrates regulatory adaptation to consumer demand for diverse immunity-supporting compounds. The development of plant-derived exosome-like nanoparticles from fruits, vegetables, and herbs creates novel delivery mechanisms for immune-modulating phytonutrients, potentially revolutionizing functional food formulations. Clinical validation of phytonutrients' immunomodulatory effects in livestock applications provides translational insights for human health applications, particularly in stress-related immune suppression scenarios. The integration of traditional herbal knowledge with modern extraction technologies enables the commercialization of previously underutilized immunity-supporting plant compounds.
Restraint Impact Analysis*
| Restraints | (~) % Impact on CAGR Forecasts | Geographic Relevance | Impact Timeline |
|---|---|---|---|
| High production costs associated with phytonutrient extraction and processing | -1.8% | Global, most acute in regions with high energy costs | Short term (≤ 2 years) |
| Limited availability of raw materials due to seasonal dependencies and agricultural constraints | -1.2% | Global, with regional variations based on crop diversity | Medium term (2-4 years) |
| Complex regulatory requirements and approval processes across different regions | -0.9% | Global, with varying intensity across regulatory jurisdictions | Long term (≥ 4 years) |
| Competition from synthetic alternatives with lower production costs | -0.7% | Global, strongest impact in price-sensitive market segments | Medium term (2-4 years) |
| Source: Mordor Intelligence | |||
High Production Costs Associated with Phytonutrient Extraction and Processing
High production costs limit market growth by restricting access to price-sensitive consumers and reducing manufacturer profits. Traditional extraction methods require substantial energy and specialized equipment, particularly supercritical CO2 systems that demand significant capital investment from manufacturers. New extraction technologies, such as subcritical water processing and natural deep eutectic solvents, may reduce costs while maintaining product quality and environmental standards. Many phytonutrient categories struggle to achieve economies of scale due to scattered demand across applications and regions. While biotechnology methods like microbial fermentation and plant cell culture could lower long-term production costs and overcome agricultural limitations, they require substantial initial investment. Using agricultural by-products as phytonutrient sources helps reduce costs and improve sustainability.
Limited Availability of Raw Materials Due to Seasonal Dependencies and Agricultural Constraints
Supply chain vulnerabilities in raw material availability result in price volatility and sourcing uncertainties for manufacturers. Agricultural production patterns affected by climate change create yield variations that influence phytonutrient concentrations in source materials. The fresh produce supply chain faces additional challenges due to its perishable nature and reliance on cold chain infrastructure, affecting the consistency of raw materials needed for phytonutrient extraction. While companies implement diversification strategies through alternative plant sources and expanded geographic sourcing, these approaches require substantial investments in supplier development and quality control systems. Controlled environment agriculture and vertical farming technologies offer solutions to reduce seasonal dependencies and maintain consistent phytonutrient profiles, though cost-effectiveness remains a concern. The industry is exploring biotechnology solutions, including algae cultivation and synthetic biology methods, to address agricultural limitations and improve control over compound purity and concentration.
*Our forecasts treat driver/restraint impacts as directional, not additive. The impact forecasts reflect baseline growth, mix effects, and variable interactions.
Segment Analysis
By Type: Carotenoids Sustain Leadership While Polyphenols Accelerate
Carotenoids secured 38.12% of the phytonutrients market share in 2025, anchored in long-standing uses as colorants and antioxidants in foods and supplements. Their oxide-scavenging capacity and Provitamin A functions keep demand stable. Conversely, polyphenols deliver the highest 9.39% CAGR on mounting evidence of cardioprotective and neuroprotective benefits. Fermentation-based synthesis now sidesteps seasonal crop limits, improving batch-to-batch consistency and reducing solvent residues—all persuasive advantages for clean-label brand owners.
Strong clinical validation and cost-efficient production ensure carotenoids remain the revenue anchor of the phytonutrients market. However, innovations in galloyl-rich tannins, resveratrol analogs, and flavonol glycosides propel polyphenols toward double-digit gains, which could erode carotenoids’ dominance by the late decade. As precision-nutrition platforms link gene variants to oxidative-stress markers, polyphenol blends tailored to personal health profiles gain traction. These trends foreshadow a gradually rebalancing product mix within the wider phytonutrients market.


By Source: Fruits & Vegetables Dominate as Herbs and Trees Gain Momentum
Fruits and vegetables accounted for 53.21% of the phytonutrients market in 2025, supported by extensive agricultural production and consumer trust. Food processing byproducts such as tomato pomace, onion skins, and grape marc are increasingly used as raw materials, converting waste into valuable products while reducing environmental impact. The United States Department of Agriculture (USDA) reported vegetable production of 758 million cwt in 2023, ensuring a sufficient raw material supply.
Herbs and trees chart the fastest 8.33% CAGR, propelled by interest in adaptogenic compounds from ashwagandha, ginseng, and green tea catechins. Standardized extraction protocols ensure consistent potency, alleviating historical quality-control concerns. Cereals, pulses, and oilseeds offer cost-efficient scale yet must compete with food-use demand. Marine algae and synthetic-biology platforms represent longer-term alternatives that promise purity and environmental control but require further cost optimization before they reshape the phytonutrients market.
By Form: Powder Retains Majority Share as Liquids Win Convenience-Seekers
Powders dominated the phytonutrients market with a 65.12% share in 2025. This format offers significant advantages in stability, transportation efficiency, and compatibility with bakery, dairy, and meat analog applications. Processing methods like spray-drying, freeze-drying, and agglomeration help preserve active compounds while maintaining low water activity levels, ensuring product quality and shelf life. The incorporation of matrix-derived carriers, particularly pea-protein isolates, has substantially enhanced powder dispersibility characteristics and enabled the development of sugar-free formulations across various food and beverage applications.
Liquids, projected to grow 9.32% CAGR, appeal to ready-to-drink beverages, gummies, and drop-dose formats. Centrifugal-partition chromatography using renewable solvents boosts purity to pharmaceutical-grade standards without chlorinated residues. Capsules, tablets, and nanoemulsion shots serve premium niches where bioavailability claims command higher margins. Intelligent packaging that tracks oxidation in real time is under development and could extend shelf life, reinforcing consumer trust in both powder and liquid variants of the phytonutrients market.
By Application: Food and Beverages Lead While Pharmaceuticals Accelerate
The food and beverages segment dominated with a 50.92% market share in 2025, driven by manufacturers reformulating breakfast cereals, juices, and dairy products with natural pigments and antioxidants. Major food companies are increasingly incorporating these natural ingredients to meet consumer demand for clean-label products. The segment's growth is supported by favorable labeling regulations and the ability to make health claims, which enable manufacturers to highlight the nutritional benefits of natural ingredients. This regulatory environment, combined with rising consumer awareness of health benefits, continues to drive the adoption of natural pigments and antioxidants in food and beverage applications.
Pharmaceuticals, advancing at 10.32% CAGR, benefit from nano-carriers that resolve bioavailability hurdles of curcumin, resveratrol, and quercetin. FDA guidance on new dietary ingredient notifications in 2024 clarifies regulatory routes, accelerating commercialization. Dietary supplements remain an entrenched mid-market channel but now face competition from functional foods that blend convenience and health benefits. In animal nutrition, complex phytonutrient blends improve gut health and feed conversion, offering farmers antibiotic-free performance solutions—an adjacency expected to underpin incremental growth for the wider phytonutrients market.
Geography Analysis
North America held 41.22% of the phytonutrients market in 2025, leveraging robust regulatory clarity, investment in research and development, and consumer readiness to pay premium prices. Recent FDA approvals of butterfly pea flower and Galdieria-derived blue pigment boost the supply of natural colorants, further reinforcing market confidence. The region’s produce output, including 758 million cwt of vegetables in 2023, guarantees steady raw-material flows. E-commerce and personalized-nutrition subscription models accelerate direct-to-consumer adoption of superfood blends and targeted gummies.
Asia-Pacific is the fastest-growing region at an 8.52% CAGR, fueled by expanding middle-class populations, progressive regulations, and traditional-medicine heritage. China’s approval of new health-food ingredients such as microalgae oil and proanthocyanidins enriches the permissible ingredient list and widens product innovation latitude cfda.com. Indian Ayurveda and Japanese Foods with Function Claims further mainstream phytonutrient usage, while local contract-manufacturing ecosystems reduce production costs, enhancing export competitiveness.
Europe posts steady growth underpinned by stringent quality and sustainability standards. Adoption of green extraction technologies and life-cycle-assessment reporting supports premium brand positioning, though fragmented regulatory alignment across EU members adds time and cost. South America and the Middle East and Africa remain nascent but promising; agricultural abundance in Brazil and emerging nutraceutical demand in the Gulf Cooperation Council create fertile terrain for the future expansion of the phytonutrients market.

Competitive Landscape
The phytonutrients market is moderately fragmented with established multinational corporations competing alongside specialized biotechnology firms and regional players, creating a dynamic competitive environment where technological innovation and strategic partnerships drive market positioning. Market leaders like Cargill, BASF, and DSM-Firmenich leverage extensive global supply chains and research and development capabilities to maintain competitive advantages, while smaller specialized firms focus on novel extraction technologies and niche applications to capture market share.
The integration of biotechnological production methods, including fermentation-based systems and synthetic biology platforms, represents a key differentiator as companies seek to reduce production costs while ensuring consistent quality and supply security. Strategic partnerships increasingly shape competitive dynamics, exemplified by collaborations like HealthTech Bioactives' alliance with Abolis Biotechnologies to develop solvent-free polyphenol production methods, demonstrating how technology partnerships can create competitive advantages through cost reduction and sustainability enhancement.
White-space opportunities exist in emerging applications such as animal nutrition, where complex phytonutrient supplementation shows promise for enhancing livestock performance, and in pharmaceutical applications where nanoformulation technologies address historical bioavailability limitations. Emerging disruptors include companies developing sustainable extraction technologies and those leveraging agricultural waste streams for phytonutrient production, creating both cost advantages and sustainability credentials that resonate with environmentally conscious consumers and regulatory bodies.
Phytonutrients Industry Leaders
Cargill, Incorporated
BASF SE
Kerry Group plc
The Archer-Daniels-Midland Company
DSM-Firmenich
- *Disclaimer: Major Players sorted in no particular order

Recent Industry Developments
- June 2025: Sparxell, a UK-based natural color startup, secured funding to scale production of biodegradable, plant-based colors using patented cellulose technology, responding to FDA initiatives to eliminate synthetic dyes by 2026. The company's upcycled solution addresses growing demand for natural colors as major food companies reformulate products to meet clean-label requirements
- March 2025: Louis Dreyfus Company (LDC), a global merchant and processor of agricultural goods, launched its new plant-based Vitamin E products and expanded food ingredients line at the 2025 Food Ingredients China exhibition, strengthening its position in the plant-based ingredients market.
- October 2024: DSM-Firmenich introduced Dry Vit A Palmitate for Early Life Nutrition, a clean-label vitamin A solution for infant formula manufacturing. The product addresses stability challenges commonly found in traditional vitamin A ingredients while maintaining nutritional value.
- May 2024: Cepham, a supplier specializing in Ayurvedic ingredients, launched a new eye health formulation called Luteye. This formulation combines macular carotenoids lutein and zeaxanthin with extra virgin olive oil enriched with oleocanthal. The purpose of Luteye is to target the effects of aging on eye health.


Global Phytonutrients Market Report Scope
Phytonutrients are chemical compounds produced by plants, generally to help them resist fungi, bacteria, and plant virus infections, and also consumption by insects and other animals. The global phytonutrient market is segmented by type, application, and geography. Based on type, the market is segmented into vitamins, minerals, probiotics, omega-3 & 6 fatty acids, carotenoids, proteins & amino acids, and other types. Based on application, the market is segmented into bakery & cereals, dairy & dairy alternative products, meat & seafood, confectionery, beverages, and other applications. Based on geography, the study analyzes the phytonutrients market in emerging and established markets across the globe, including North America, Europe, Asia-Pacific, South America, and Middle East & Africa. For each segment, the market sizing and forecasts have been done based on the value (in USD million).
| Carotenoids |
| Polyphenols |
| Phytosterols |
| Omega-3 and 6 Fatty Acids |
| Vitamins |
| Others |
| Fruits and Vegetables |
| Cereals, Pulses, and Oilseeds |
| Herbs and Trees |
| Other Sources |
| Powder |
| Liquid |
| Others |
| Food and Beverages |
| Dietary Supplements |
| Animal Nutrition |
| Cosmetics and Personal Care |
| Pharmaceuticals |
| North America | United States |
| Canada | |
| Mexico | |
| Rest of North America | |
| Europe | Germany |
| United Kingdom | |
| Italy | |
| France | |
| Spain | |
| Netherlands | |
| Rest of Europe | |
| Asia-Pacific | China |
| India | |
| Japan | |
| Australia | |
| South Korea | |
| Rest of Asia-Pacific | |
| South America | Brazil |
| Argentina | |
| Rest of South America | |
| Middle East and Africa | South Africa |
| Saudi Arabia | |
| United Arab Emirates | |
| Rest of Middle East and Africa |
| By Type | Carotenoids | |
| Polyphenols | ||
| Phytosterols | ||
| Omega-3 and 6 Fatty Acids | ||
| Vitamins | ||
| Others | ||
| By Source | Fruits and Vegetables | |
| Cereals, Pulses, and Oilseeds | ||
| Herbs and Trees | ||
| Other Sources | ||
| By Form | Powder | |
| Liquid | ||
| Others | ||
| By Application | Food and Beverages | |
| Dietary Supplements | ||
| Animal Nutrition | ||
| Cosmetics and Personal Care | ||
| Pharmaceuticals | ||
| By Geography | North America | United States |
| Canada | ||
| Mexico | ||
| Rest of North America | ||
| Europe | Germany | |
| United Kingdom | ||
| Italy | ||
| France | ||
| Spain | ||
| Netherlands | ||
| Rest of Europe | ||
| Asia-Pacific | China | |
| India | ||
| Japan | ||
| Australia | ||
| South Korea | ||
| Rest of Asia-Pacific | ||
| South America | Brazil | |
| Argentina | ||
| Rest of South America | ||
| Middle East and Africa | South Africa | |
| Saudi Arabia | ||
| United Arab Emirates | ||
| Rest of Middle East and Africa | ||


Key Questions Answered in the Report
What is the current size of the phytonutrients market?
The phytonutrients market is estimated at USD 6.81 billion in 2026 and is projected to reach USD 9.4 billion by 2031 on a 6.64% CAGR trajectory over 2026-2031.
Which type holds the largest phytonutrients market share?
Carotenoids hold the largest share at 38.12% in 2025, driven by dual roles as natural colorants and antioxidants.
Which application is growing fastest?
Pharmaceutical uses are advancing at a 10.32% CAGR through 2031 as clinical evidence and nano-delivery systems improve therapeutic viability.
Why is Asia-Pacific the fastest-growing region?
Rapid urbanization, rising disposable incomes, and supportive regulations, such as China’s approval of new phytonutrient ingredients, support an 8.52% regional CAGR.
Page last updated on:


