Natural Gas Liquids Market Size and Share
Market Overview
| Study Period | 2020 - 2030 |
|---|---|
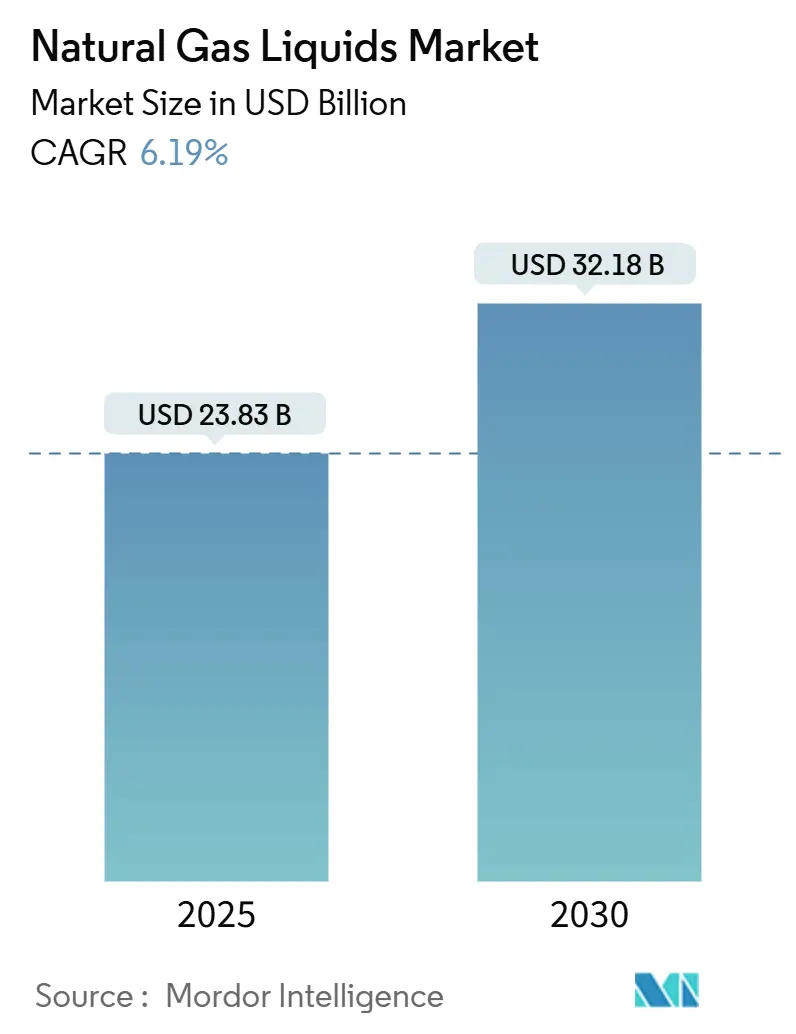
| Market Size (2025) | USD 23.83 Billion |
| Market Size (2030) | USD 32.18 Billion |
| Growth Rate (2025 - 2030) | 6.19% CAGR |
| Fastest Growing Market | Asia Pacific |
| Largest Market | North America |
| Market Concentration | Medium |
Major Players *Disclaimer: Major Players sorted in no particular order Image © Mordor Intelligence. Reuse requires attribution under CC BY 4.0. | |
Natural Gas Liquids Market Analysis by Mordor Intelligence
The Natural Gas Liquids Market size is estimated at USD 23.83 billion in 2025, and is expected to reach USD 32.18 billion by 2030, at a CAGR of 6.19% during the forecast period (2025-2030).
This underscores a resilient growth outlook driven by petrochemical feedstock demand and sustained U.S. shale-related supply. A steady shift toward NGL-based cracking, competitive midstream investments, and export-oriented infrastructure continues to broaden trade flows, while policy-backed electrification trends create pockets of evolving demand. Integrated midstream operators prioritize vertical integration to capture incremental margins, and Asian PDH projects are structurally lifting long-haul propane and ethane trade volumes. Capital intensity for fractionation and logistics remains a gating factor for newcomers, yet modular processing technology is gradually lowering unit costs. Near-term volatility in crude-to-gas price spreads still influences drilling economics, but long-run supply visibility supports confident investment in the natural gas liquids market.
Key Report Takeaways
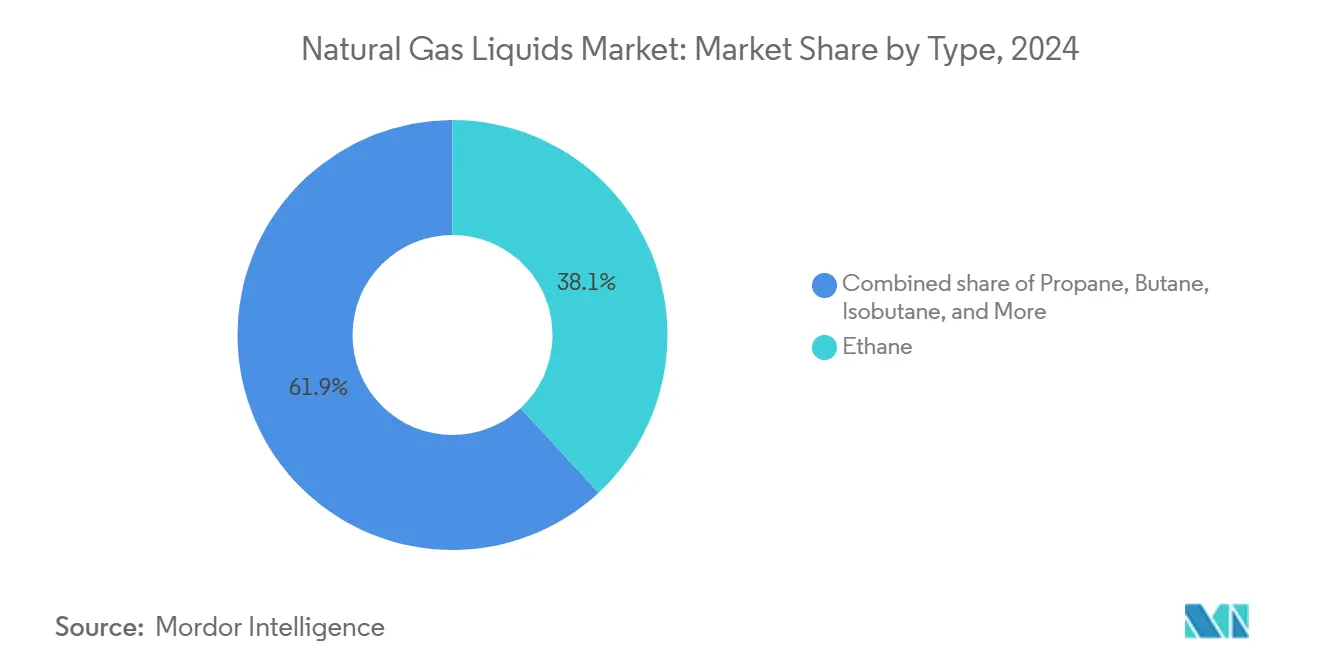
- By type, ethane led the natural gas liquids market with 38.1% revenue share in 2024 while expanding at the highest 6.9% CAGR through 2030.
- By application, petrochemical feedstocks captured 57.5% of the natural gas liquids market size in 2024 and will continue growing at a 6.5% CAGR to 2030.
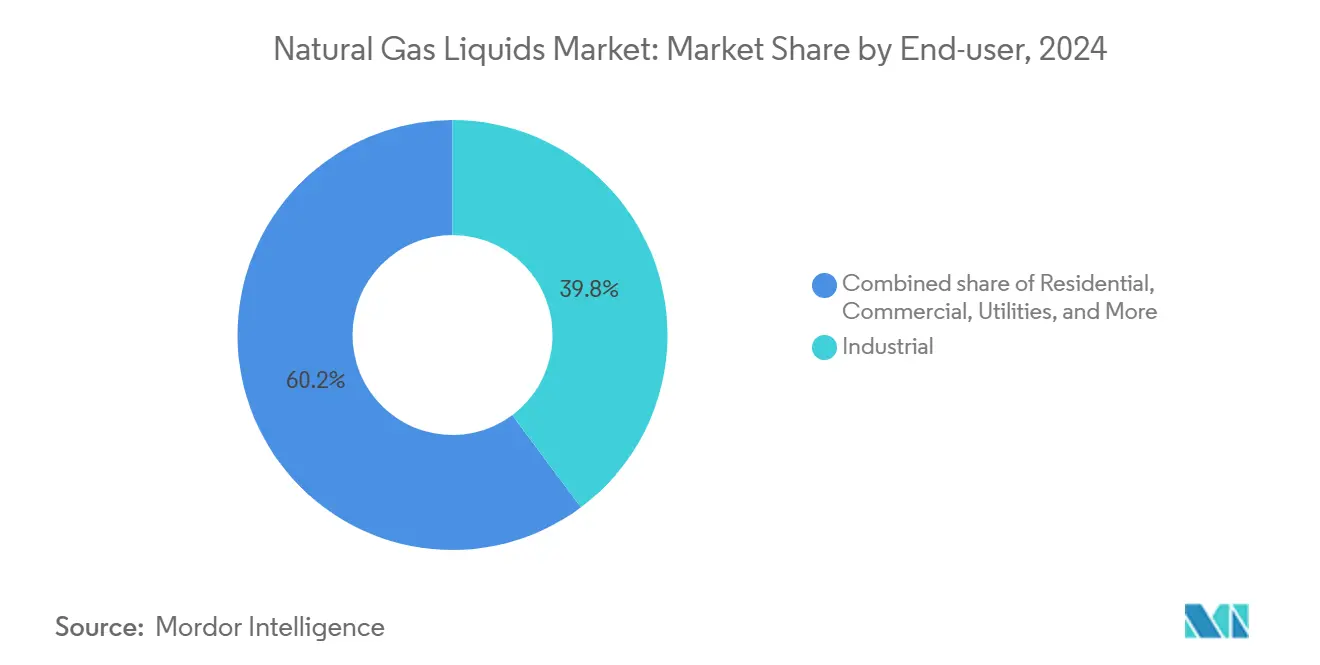
- By end-user, the industrial segment accounted for 39.8% of the natural gas liquids market share in 2024 and is set to grow at a 6.6% CAGR over the same horizon.
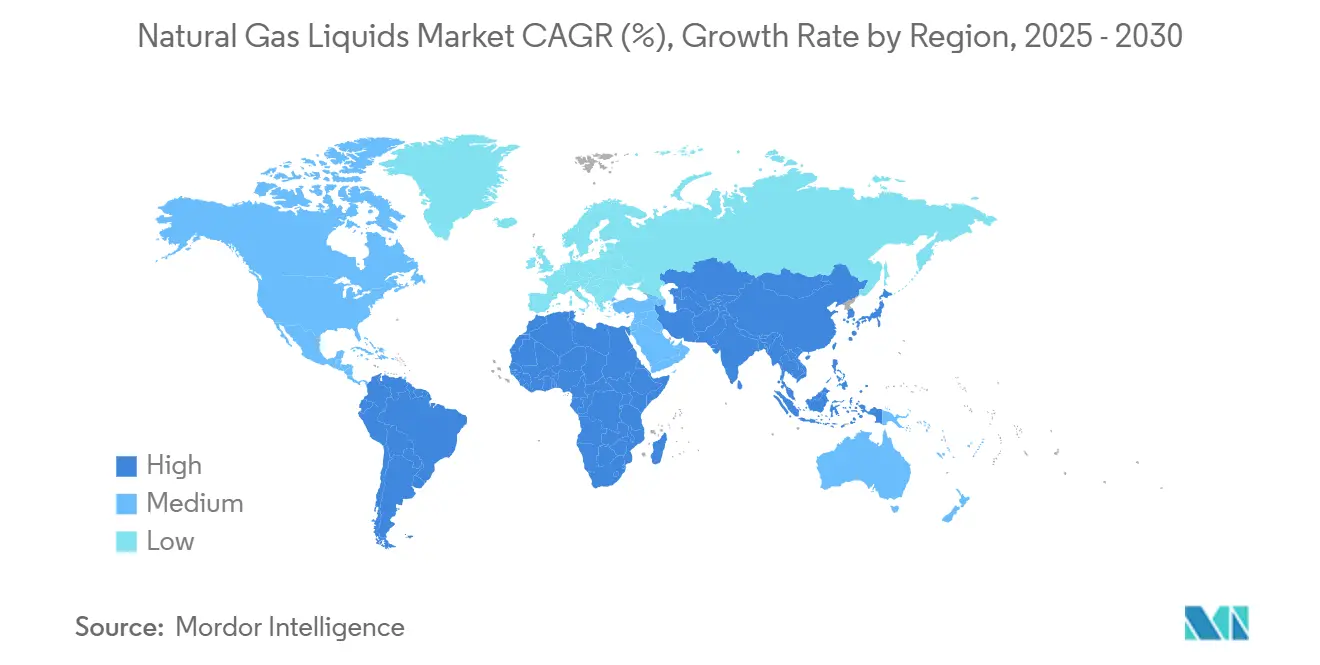
- By geography, North America held 38.7% revenue share in the natural gas liquids market for 2024, whereas Asia-Pacific is projected to log the fastest 7.3% CAGR through 2030.
Global Natural Gas Liquids Market Trends and Insights
Drivers Impact Analysis*
| Driver | (~) % Impact on CAGR Forecast | Geographic Relevance | Impact Timeline |
|---|---|---|---|
| Surging petrochemical demand for ethylene & propylene | +1.8% | Global, with concentration in Asia-Pacific and North America | Medium term (2-4 years) |
| Growing shale gas & tight-oil output—especially in the U.S. | +1.5% | North America, with spillover to global markets | Long term (≥ 4 years) |
| Cost advantage of NGLs versus naphtha/oil feedstocks | +1.2% | Global, particularly in Asia-Pacific petrochemical hubs | Short term (≤ 2 years) |
| Expansion of Asian PDH plants boosting propane demand | +1.0% | Asia-Pacific core, with supply implications for North America | Medium term (2-4 years) |
| Low-GWP refrigerant transition (NGL-based blends) | +0.7% | Global, with early adoption in North America and Europe | Medium term (2-4 years) |
| Stranded-gas monetisation via modular NGL recovery | +0.5% | Global, with focus on remote locations and emerging markets | Long term (≥ 4 years) |
| Source: Mordor Intelligence | |||
Surging Petrochemical Demand for Ethylene & Propylene
Ethylene and propylene capacity additions continue to redefine natural gas liquids consumption patterns. U.S. ethane output climbed to 2.83 million bpd in 2024, a 6.8% year-over-year rise that mirrors steam-cracker utilization gains. Steam-cracker operators enjoy attractive margins that incentivize new investments, especially in Asia, where light-feedstock crackers capitalize on cost advantages. China’s PDH portfolio is poised to add 44% of global propylene capacity from 2020-2025, reinforcing reliance on U.S. propane exports despite recent shipping bottlenecks.[1] Feedstock flexibility remains paramount as producers aim to balance ethane, propane, and butane slates to optimize economics. Rising demand for light petrochemical building blocks spanning packaging, consumer durables, and automotive parts further embeds NGLs in global materials supply chains.
Growing Shale Gas & Tight-Oil Output—Especially in the U.S.
Horizontal drilling and hydraulic fracturing continue to elevate associated-gas volumes. Production from the three largest U.S. tight-oil plays has expanded by 22 Bcf/d since 2015, boosting NGL yields. Gas-to-oil ratios in the Permian and Bakken have climbed steadily, translating into abundant ethane-rich streams that underpin domestic supply growth. Midstream majors are responding with multi-billion-dollar plants and pipelines; for example, Enterprise Products Partners and Targa Resources are adding over 2 Bcf/d of new processing across the Delaware Basin. The Permian alone is on track to supply more than 90% of incremental U.S. NGL barrels this decade, and export-dock expansions cater to a widening overseas customer base. Sustained drilling productivity ensures resilience even when rig counts moderate, anchoring long-term supply security for the natural gas liquids market.
Cost Advantage of NGLs Versus Naphtha/Oil Feedstocks
Higher crude prices widen the cost gap between naphtha and NGL-derived feedstocks, safeguarding competitiveness for ethane and propane crackers. During 2024, naphtha-based ethylene margins narrowed sharply as naphtha costs tracked Brent, while ethane-based margins held firm.[2] Chinese operators have leaned into PDH technology to hedge against oil-linked feedstock volatility, although temporary freight disruption at the Suez and Panama canals compressed arbitrage economics to USD 55 per tonne from earlier USD 200 per tonne spreads. Nonetheless, abundant shale-derived supply and efficient extraction technologies sustain the underlying advantage within the broader natural gas liquids market. Crackers integrated with downstream polyethylene units can swiftly monetize favorable spreads, locking in offtake for incremental NGL barrels.
Expansion of Asian PDH Plants Boosting Propane Demand
Global PDH capacity is rising at an 18% CAGR from 2021-2024, lifting propylene’s share of total output from 11% to 16%.[3]Aranca, “Global PDH Capacity Tracker,” aranca.com China alone is commissioning multiple mega-plants that pull more than 5 million tpa of propane, redirecting trade flows from the U.S. Gulf Coast. Over 70% of U.S. propane supply now sails overseas, the bulk heading to East Asia. Ethane exports follow a similar trajectory, with Chinese import volumes projected to reach 8.2 million t in 2025, roughly 34% above 2024 levels. PDH operators require reliable feedstock contracts, spurring new VLGC shipping demand and specialized storage investments along China’s eastern seaboard. These developments embed long-run upside for North American fractionators and exporters active in the natural gas liquids market.
Restraints Impact Analysis*
| Restraint | (~) % Impact on CAGR Forecast | Geographic Relevance | Impact Timeline |
|---|---|---|---|
| High capex needs for fractionation & logistics | -0.8% | Global, with particular impact on emerging markets | Long term (≥ 4 years) |
| Crude-gas price differential volatility | -0.6% | North America core, with global supply implications | Short term (≤ 2 years) |
| EU circular-economy rules limiting virgin plastics | -0.4% | Europe, with potential global regulatory spillover | Medium term (2-4 years) |
| Electrification of residential heating | -0.3% | Global, with accelerated adoption in Europe and developed markets | Long term (≥ 4 years) |
| Source: Mordor Intelligence | |||
High Capex Needs for Fractionation & Logistics
Building a modern NGL value chain routinely demands billion-dollar capital outlays. Midstream companies commit more than USD 10 billion yearly to processing, fractionation, and dock expansions.[4] ONEOK and MPLX’s USD 1.4 billion Texas City LPG export terminal illustrates the scale required to unlock seaborne arbitrage. Phillips 66’s USD 2.2 billion EPIC NGL purchase further confirms the integrated asset premium. These capital needs pose barriers for newcomers and slow infrastructure rollouts in emerging hubs lacking established networks. Long-term take-or-pay contracts remain essential to de-risk investments, yet fluctuating commodity spreads complicate financing assumptions. While modular plants trim costs, high up-front spending continues to temper new-build momentum, especially in capital-scarce regions of the natural gas liquids market.
Crude-Gas Price Differential Volatility
The oil-to-gas price ratio hit 30× in 2024, unsettling associated gas economics across key oil-weighted basins. Henry Hub languished near USD 2.09/MMBtu in Q2 2024, prompting selective production curtailments and delaying new plant start-ups. Producers juggle drilling schedules against volatile revenue streams, while midstream operators weigh fractionation commitments against uncertain inlet volumes. A late-2024 rebound toward USD 3.00/MMBtu restored some confidence, yet market participants remain cautious given historical swing risk. Volatility further complicates hedging strategies for exporters exposed to Brent-linked netbacks, reinforcing the need for diversified feedstock sourcing and flexible offtake agreements within the natural gas liquids market.
*Our forecasts treat driver/restraint impacts as directional, not additive. The impact forecasts reflect baseline growth, mix effects, and variable interactions.
Segment Analysis
By Type: Ethane’s Dominance Underpins Growth
Ethane represented 38.1% of total volume in 2024 and will expand at the fastest 6.9% CAGR through 2030, mirroring its crucial role in ethylene production. U.S. ethane output rose to a record 2.83 million bpd in 2024, with domestic consumption climbing to 2.33 million bpd amid robust cracker utilization. Propane is the second-largest component, supported by dual petrochemical and heating demand and exports exceeding 70% of domestic supply.
Butane and isobutane fulfil specialty functions. Isobutane accounted for roughly 7% of gas-plant barrels in 2024 and has delivered 25% production growth over two years, helped by rising alkylate blending and low-GWP refrigerants. Natural gasoline, while a smaller volume share, contributes more than 25% of the value-weighted barrel thanks to strong diluent and gasoline-blending demand. Collectively, these dynamics secure a diversified revenue base across the natural gas liquids market, insulating the sector from single-product shocks.


By Application: Petrochemical Feedstock Supremacy
Petrochemical feedstocks controlled 57.5% of demand in 2024 and are set to rise at a 6.5% CAGR through 2030 as crackers chase advantaged margins. The bulk-chemicals subsector, the largest industrial gas consumer, expects 51% growth in gas demand by 2050, with one-quarter tied to fertilizer and methanol synthesis.
Residential and commercial heating face electrification headwinds, evidenced by a 15% slump in European residential gas use during 2022 and an 11% rise in global heat-pump sales. Industrial fuel demand enjoys tailwinds from competitive gas pricing and process reliability, including LNG liquefaction volumes comprising 22% of industrial consumption by 2030. Transportation draws remain niche but expand in marine bunkering and heavy-duty fleets responding to emission targets. Emerging aerosol and refrigerant segments add incremental upside, especially for isobutane (R-600a) and propane (R-290) refrigerants supported by strict low-GWP policies.
By End-User: Industrial Sector Leads Consumption
The industrial sector absorbed 39.8% of volumes in 2024 and is forecast to grow at a 6.6% CAGR to 2030, underpinned by broad-based feedstock and thermal needs. Lease-plant fuel and LNG liquefaction are notable growth pockets, projected to supply 22% of industrial gas use by 2030. Chemical producers rely on NGLs for heat and combined feedstock in methanol and ammonia chains, with new methanol capacity clustering along the U.S. Gulf Coast.
Residential and commercial segments face diverging trajectories; space-heating propane demand is declining, yet low-GWP refrigeration applications are expanding. Utilities continue leveraging natural gas for grid balancing against variable renewables. Transportation applications remain small, but LNG’s footprint in coastal shipping lanes and long-haul trucking is gradually rising. Oil-and-gas upstream operations also consume significant NGL-derived fuel in compressors and treatment facilities, linking end-use directly to field activity in the natural gas liquids market.
Geography Analysis
North America retained 38.7% of global revenue in 2024, fueled by prolific shale yields and unrivaled midstream integration. U.S. NGL production is forecast to rise from 6.85 million bpd in 2024 to 6.92 million bpd in 2025, driven mainly by the Permian Basin. Canada’s midstream landscape underwent consolidation with Keyera’s USD 5.15 billion purchase of Plains’ NGL assets, lifting fractionation capacity to 193 kbpd.
Asia-Pacific is the fastest-growing region at 7.3% CAGR through 2030, as China rolls out expansive PDH and ethylene steam-cracker programs. U.S. ethane imports to China are projected between 6.3-8.2 million t in 2025, highlighting the intensifying bilateral energy trade within the natural gas liquids market. Expanded LPG storage—up by 330,000 t to 6.1 million t—supports sustained propane inflows. India’s industrial demand is climbing amid ongoing infrastructure additions, albeit tempered by a recent cooldown in LPG import appetite.
Europe grapples with demand erosion from policy-driven electrification and efficiency mandates; residential gas use fell over 15% in 2022. The Middle East remains a formidable producer, with Saudi output rising from 1.4 million bpd toward 2.0 million bpd by 2030 on unconventional gas and downstream integration. South America offers upside through Argentina’s Vaca Muerta, though pipeline limitations constrain near-term liftings. These region-specific narratives collectively mold the evolving landscape of the natural gas liquids market.

Competitive Landscape
The market is moderately concentrated, featuring integrated midstream operators that bundle gathering, processing, fractionation, and export services to secure customer stickiness. Enterprise Products Partners runs 2.8 Bcf/d of gas processing and 370 kbpd of NGL extraction across the Permian, underpinning a robust wellhead-to-dock model. ONEOK’s roughly 60,000-mile pipeline grid supports 920 kbpd of fractionation, recently augmented by its EnLink Midstream acquisition. Targa Resources commands the largest Permian gathering reach and targets 3.75 Bcf/d of processing plus 1.2 million bpd of fractionation by 2029.
M&A accelerated in 2024-2025 as operators chase scale. Phillips 66’s USD 2.2 billion EPIC NGL acquisition deepens its Corpus Christi presence and long-haul pipeline footprint. ONEOK and MPLX’s joint Texas City Logistics venture commits USD 1.4 billion to build a 400 kbpd LPG export dock, exemplifying consortium models for capital-heavy projects. Technology is another competitive lever; Ortloff Engineers’ modular “Gas Plant in a Bottle” promises 30-50% capex savings and 6-9% power efficiency gains, appealing to operators in stranded-gas contexts.
Strategic differentiation increasingly favors companies offering full-service value chains, from field-level condensate stabilization to international LPG loading. Long-term, operators with scalable export hubs and flexible feedstock blending will likely outperform as the natural gas liquids market globalizes.
Natural Gas Liquids Industry Leaders
Enterprise Products Partners L.P.
Phillips 66
Energy Transfer LP
ExxonMobil Corporation
ONEOK Inc.
- *Disclaimer: Major Players sorted in no particular order

Recent Industry Developments
- July 2025: Keyera announced a USD 5.15 billion acquisition of Plains’ Canadian NGL business, boosting fractionation and storage capacity.
- July 2025: Chevron completed its USD 55 billion Hess takeover, adding Guyana gas and Bakken shale assets.
- April 2025: Chevron U.S.A., a subsidiary of Chevron, has announced the sale of a 70% interest in its East Texas gas assets to TG Natural Resources (TGNR) for USD 525 million.


Global Natural Gas Liquids Market Report Scope
| Ethane |
| Propane |
| Butane |
| Isobutane |
| Pentane and Pentanes Plus |
| Petrochemical Feedstock |
| Residential and Commercial Fuel |
| Industrial Fuel |
| Transportation Fuel |
| Space Heating |
| Electricity Generation |
| Aerosol Propellants and Refrigerants |
| Industrial |
| Residential |
| Commercial |
| Utilities |
| Transportation |
| Oil and Gas Sector (Internal Use) |
| North America | United States |
| Canada | |
| Mexico | |
| Europe | Germany |
| United Kingdom | |
| France | |
| Italy | |
| NORDIC Countries | |
| Russia | |
| Rest of Europe | |
| Asia-Pacific | China |
| India | |
| Japan | |
| South Korea | |
| ASEAN Countries | |
| Rest of Asia-Pacific | |
| South America | Brazil |
| Argentina | |
| Rest of South America | |
| Middle East and Africa | Saudi Arabia |
| United Arab Emirates | |
| South Africa | |
| Nigeria | |
| Egypt | |
| Rest of Middle East and Africa |
| By Type | Ethane | |
| Propane | ||
| Butane | ||
| Isobutane | ||
| Pentane and Pentanes Plus | ||
| By Application | Petrochemical Feedstock | |
| Residential and Commercial Fuel | ||
| Industrial Fuel | ||
| Transportation Fuel | ||
| Space Heating | ||
| Electricity Generation | ||
| Aerosol Propellants and Refrigerants | ||
| By End-user | Industrial | |
| Residential | ||
| Commercial | ||
| Utilities | ||
| Transportation | ||
| Oil and Gas Sector (Internal Use) | ||
| By Geography | North America | United States |
| Canada | ||
| Mexico | ||
| Europe | Germany | |
| United Kingdom | ||
| France | ||
| Italy | ||
| NORDIC Countries | ||
| Russia | ||
| Rest of Europe | ||
| Asia-Pacific | China | |
| India | ||
| Japan | ||
| South Korea | ||
| ASEAN Countries | ||
| Rest of Asia-Pacific | ||
| South America | Brazil | |
| Argentina | ||
| Rest of South America | ||
| Middle East and Africa | Saudi Arabia | |
| United Arab Emirates | ||
| South Africa | ||
| Nigeria | ||
| Egypt | ||
| Rest of Middle East and Africa | ||


Key Questions Answered in the Report
What is the current value of the natural gas liquids market?
The natural gas liquids market size reached USD 23.83 billion in 2025 and is projected to climb to USD 32.18 billion by 2030 at a 6.19% CAGR.
Which NGL type commands the largest share in the natural gas liquids market?
Ethane leads with 38.1% share in 2024 and is also the fastest-growing component at 6.9% CAGR through 2030.
Why is Asia-Pacific the fastest-growing region in the natural gas liquids market?
Rapid PDH and steam-cracker buildouts in China and rising industrial demand in India are driving a 7.3% CAGR for Asia-Pacific through 2030.
How are crude-to-gas price spreads in the natural gas liquids market affecting producers?
A volatile oil-to-gas ratio—peaking at 30× in 2024—impacts drilling economics and can delay associated gas output, influencing NGL supply and project timing.
Which companies in the natural gas liquids market hold the largest NGL infrastructure positions?
Enterprise Products Partners, ONEOK, and Targa Resources control extensive gathering, processing, fractionation, and export assets, underpinning moderate market concentration.
What emerging applications support future NGL demand?
Low-GWP refrigerants, modular stranded-gas monetization, and growing marine LNG bunkering are poised to add incremental demand alongside core petrochemical growth.
Page last updated on:


