
Market Overview
| Study Period | 2021 - 2031 |
|---|---|
| Forecast Data Period | 2026 - 2031 |
| Historical Data Period | 2021 - 2024 |
| Growth Rate | 4.86 % |
| Market Concentration | Low |
Major Players *Disclaimer: Major Players sorted in no particular order Image © Mordor Intelligence. Reuse requires attribution under CC BY 4.0. | |
United States Natural Gas Market Analysis by Mordor Intelligence
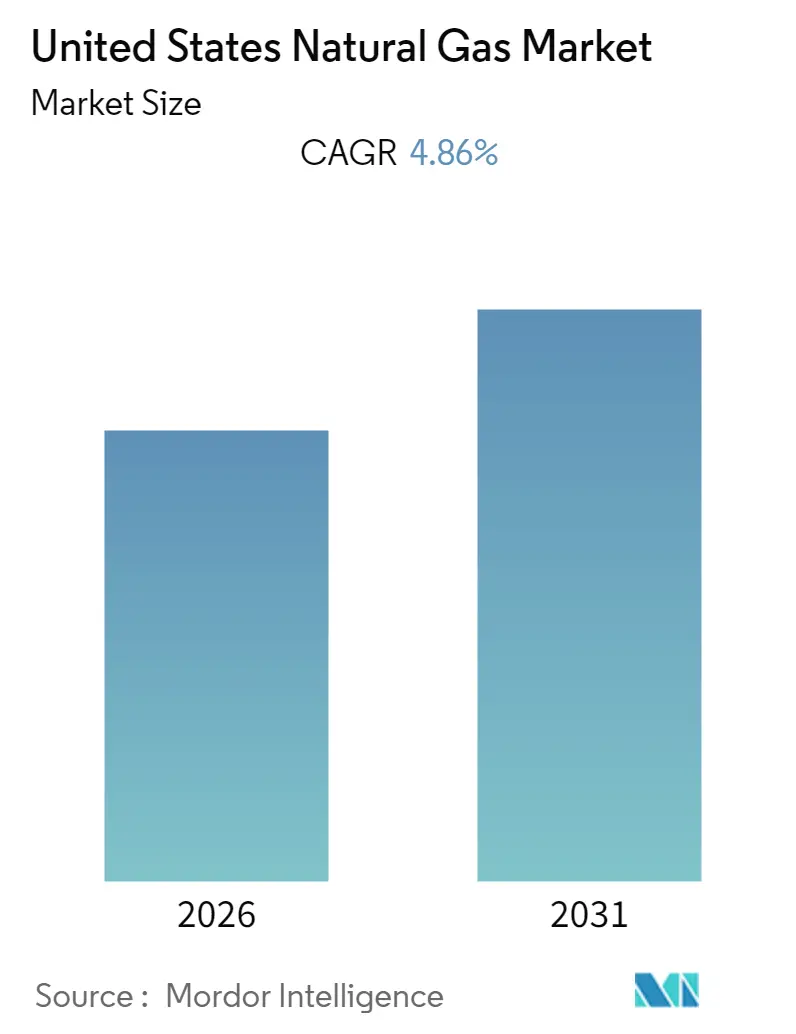
The United States Natural Gas Market size is expected to register a CAGR of 4.86% during the forecast period (2026-2031).
The market was negatively impacted by COVID-19 in 2020. Presently the market has reached pre-pandemic levels.
- The growing demand for cleaner energy sources and the use of natural gas to generate electricity, heat buildings, heat water, drive industrial furnaces, etc., as well as the need to reduce carbon emissions and subsidies provided by governments for using natural gas, are driving the market to grow.
- On the other hand, the risk of leaks during transportation and storage and the high cost of storing natural gas are among other factors that could limit the market's growth.
- Nevertheless, decarbonization policies have been proposed or introduced in several parts of the United States as part of the transition to a low-carbon society. By implementing renewable portfolio standards, setting net carbon-neutral clean energy standards, setting economy-wide targets for carbon reduction, and mandating the use of certain technologies, these policies rely on a range of actions. These factors can open up new opportunities for the market.
Note: Market size and forecast figures in this report are generated using Mordor Intelligence’s proprietary estimation framework, updated with the latest available data and insights as of 2026.
United States Natural Gas Market Trends and Insights
Power Generation Segment to Dominate the Market
- A gas-fired power plant, also called a gas-fired power station or natural gas power station, is a thermal power plant that generates electricity by burning natural gas.
- Natural gas power plants are low-cost, quick to build, and have very high thermodynamic efficiencies compared to other power plants. Burning of natural gas churn out fewer pollutants like NOx, SOx, and particulate matter than coal and oil.
- Combined cycle plants are more efficient because they utilize hot exhaust gases from the gas turbine, which are then used to boil water into steam, which can spin another turbine and generate more electricity, resulting in up to 60% thermal efficiency.
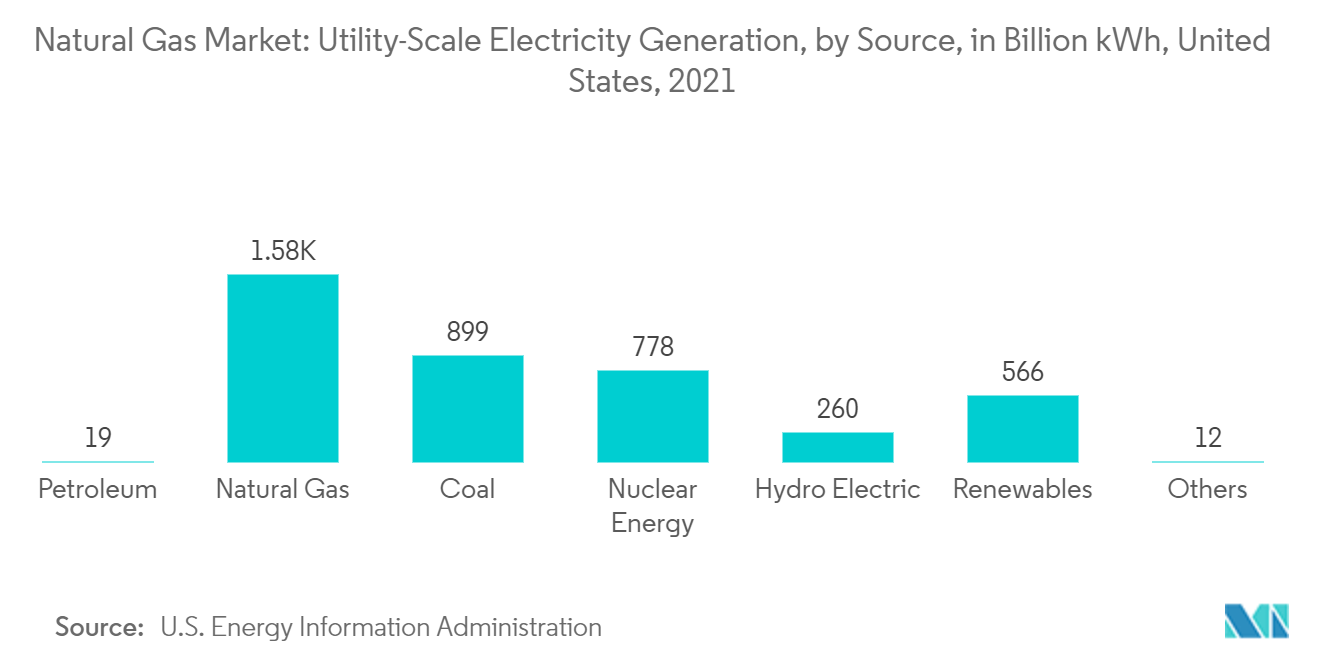
- According to the US Energy Information Administration, in 2021, nearly 4,116 billion kilowatt-hours (kWh) of electricity were generated at utility-scale electricity generation facilities in the United States. Most of this electricity was generated by fossil fuels (coal, natural gas, petroleum, and other gases). About 19% of the electricity was generated by nuclear energy, while the remaining 20% was generated by renewable energy.
- According to the US Energy Information Administration, natural gas consumption in the United States is expected to increase by 3.6 billion cubic feet (Bcf/d) in 2022 compared to 2021 levels to an average of 86.6 Bcf/d per year. In addition, the natural gas consumption of the United States in 2022 is expected to rise across all end-use sectors, led by electric power, residential and commercial.
- The largest consumer of natural gas in the United States in 2022 is expected to be the electric power sector, with its annual consumption increasing by 1.2 Bcf/d to average 32.1 Bcf/d, which is 0.3 Bcf/d higher than the previous record set in 2020 of 31.8 Bcf/d. A historical trend shows that this sector is sensitive to changes in natural gas prices concerning coal prices. Power providers typically offset their use of natural gas for electricity generation with coal during times of high natural gas prices.
- Because of limitations at coal-fired power plants and weather-driven demand, the electric power consumption of natural gas in the United States increased in 2022. Due to historically low on-site inventories, constraints in fuel delivery to coal plants, and continued retirements of coal capacity, coal-fired power plants have been unable to increase power generation.
- In February 2022, Baker Hughes and NET Power formed a strategic partnership. According to the partnership, Baker Hughs is investing in NET Power, aiming to advance the deployment of NET Power's utility-scale natural gas-fired power plants, which do not emit any greenhouse gases and capture all CO2. As a result of the partnership, industry experts are brought together to enable the global deployment of NET Power's technology solutions. Baker Hughes may apply its advanced technology capability in developing supercritical CO2 turboexpanders and other critical pumping and compression technologies to NET company's power plants. As part of the partnership, Baker Hughes may contribute its experience in system integration and process knowledge to accelerate market deployment. The NET Power company is engaged in developing utility-scale NET Power plants, with initial projects expected to be online in four years.
- In August 2021, the California Energy Commission (CEC) approved licenses for gas-fired power units to help the state cope with ongoing electricity shortages. In response to the governor's declaration that the state's power grid was in an emergency, the state's Department of Water Resources is procuring five temporary gas-fueled generators, each with a power capacity of 30 megawatts, to be installed at existing power plants.
- Therefore, based on the factors mentioned above, such as the huge consumption of natural gas in the power sector and demand for gas-fired power plants, the Power generation segment is expected to positively impact the natural gas market during the forecast period.
Growing Demand for Cleaner Energy Sources Such as Natural Gas to Drive the Market
- The US shale gas boom has propelled the country into a global leadership position among natural gas producers over the past decade. The United States produced more natural gas than ever in 2021, with 23.1% of the global natural gas production being accounted for by the United States, ahead of Russia (17.4%) and even the entire Middle East (17.7%).
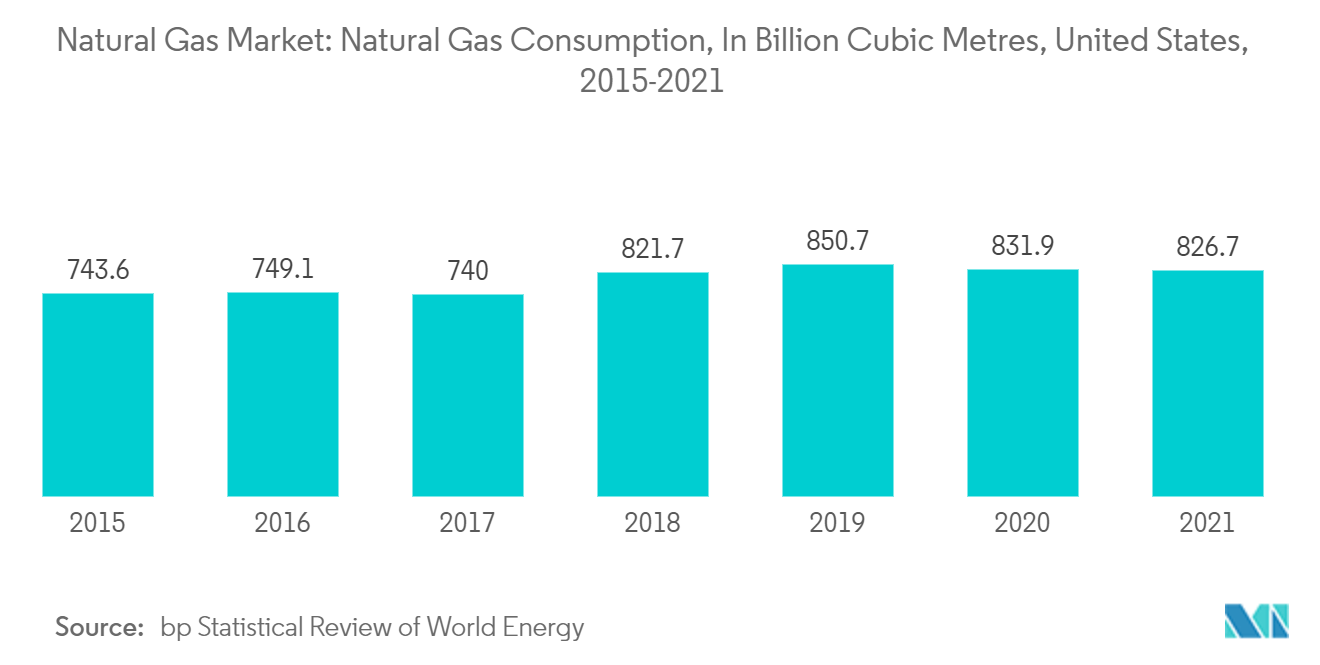
- According to the bp Statistical Review of World Energy, in 2021, the United States consumed 826.7 billion cubic meters of natural gas, an increase of 11.71% from 2017.
- The electric power sector relies on natural gas to generate electricity and thermal output. In 2021, electric power accounted for 37% of the total natural gas consumption in the country, and natural gas accounted for approximately 32% of the primary energy consumption of the US electric power sector. Natural gas accounted for 38% of total utility-scale electricity generation in the United States by all industries in 2021.
- The applications of natural gas in the industrial sector include processed heating, combined heat and power systems, chemical and fertilizer production, plant fuel, and feedstock for generating electricity and hydrogen. The industrial sector accounted for about 33% of the total natural gas consumption in the United States in 2021, and approximately 34% of the total energy consumption of the US industrial sector was derived from natural gas.
- Approximately half of all homes in the United States use natural gas for space heating and water heating. Natural gas is used in the residential sector to heat buildings and water, cook, and dry clothes. In 2021, the residential sector accounted for about 15% of total US natural gas consumption, and natural gas provided approximately 23% of the total energy consumption of the residential sector in the United States.
- Similarly, a large share of natural gas is consumed in both the commercial and transportation sectors, thus increasing the natural gas demand in the United States.
- As stated in the Short-Term Energy Outlook (STEO) issued by the United States Energy Information Administration in September 2022, the United States is expected to consume 3.6 billion cubic feet per day (Bcf/d) of natural gas during 2022, a total of 86.6 Bcf/d, the highest annual consumption of natural gas in history. It is predicted that natural gas consumption in the United States may increase in all end-use sectors this year. In the electric power sector, this demand is expected to grow by 4% to 32.1 Bcf/d in 2022, the highest growth rate among all sectors.
- Hence, the ongoing demand for natural gas among the various sectors in the United States is expected to drive the market studied during the forecast period.
Regulatory Landscape
US natural gas infrastructure development and market operations are shaped by the Federal Energy Regulatory Commission (FERC), especially for interstate pipeline certification, rates, and related National Environmental Policy Act (NEPA) review processes. In May 2026, FERC advanced reforms to its blanket certificate program through a Notice of Proposed Rulemaking (Docket No. RM25-12-001), aiming to broaden the set of pipeline projects eligible for streamlined authorization while updating key cost thresholds, including increasing the automatic authorization limit from USD 14.5 million to USD 30 million and the prior notice limit from USD 41.1 million to USD 86 million.
These reforms also affect how environmental reviews are structured and timed. In June 2026, FERC actions clarified changes in how cumulative effects are handled within NEPA documentation for certain proceedings, and the commission extended the deadline for projects that relied on temporary regulatory waivers tied to the updated cost limits to May 31, 2028. Together, these steps anchor permitting cadence, project scope selection, and capital scheduling across upstream-to-midstream linkages in the United States.
Value Chain Analysis
The US natural gas value chain runs from upstream exploration and production (including shale and tight gas) through gathering and processing, interstate and intrastate transmission, storage, LNG liquefaction and export, and finally downstream distribution and end-use (power generation, industrial use, residential and commercial heating, and transportation). Upstream activity is driven by large independents and integrated companies, with capital programs and basin focus shaping supply availability, while midstream operators provide compression, pipeline capacity, and storage that convert wellhead volumes into marketable gas across regions.
Recent company actions reflect investment across multiple links in the chain. EOG Resources disclosed a 2026 capital plan of USD 6.5 billion focused on key US positions such as the Delaware Basin, Utica, and Eagle Ford, while Chevron outlined a 2026 capex budget with a sizable portion tied to US-based spending and shale and tight assets. ConocoPhillips raised its 2026 capital spending outlook to USD 12-12.5 billion, adding attention to operational efficiencies in the Permian Basin. On the LNG and export-oriented segment, ExxonMobil reported first LNG at Golden Pass Train 1 in Q1 2026, reinforcing the role of Gulf Coast liquefaction as a downstream pull on upstream and pipeline supply.
Competitive Landscape
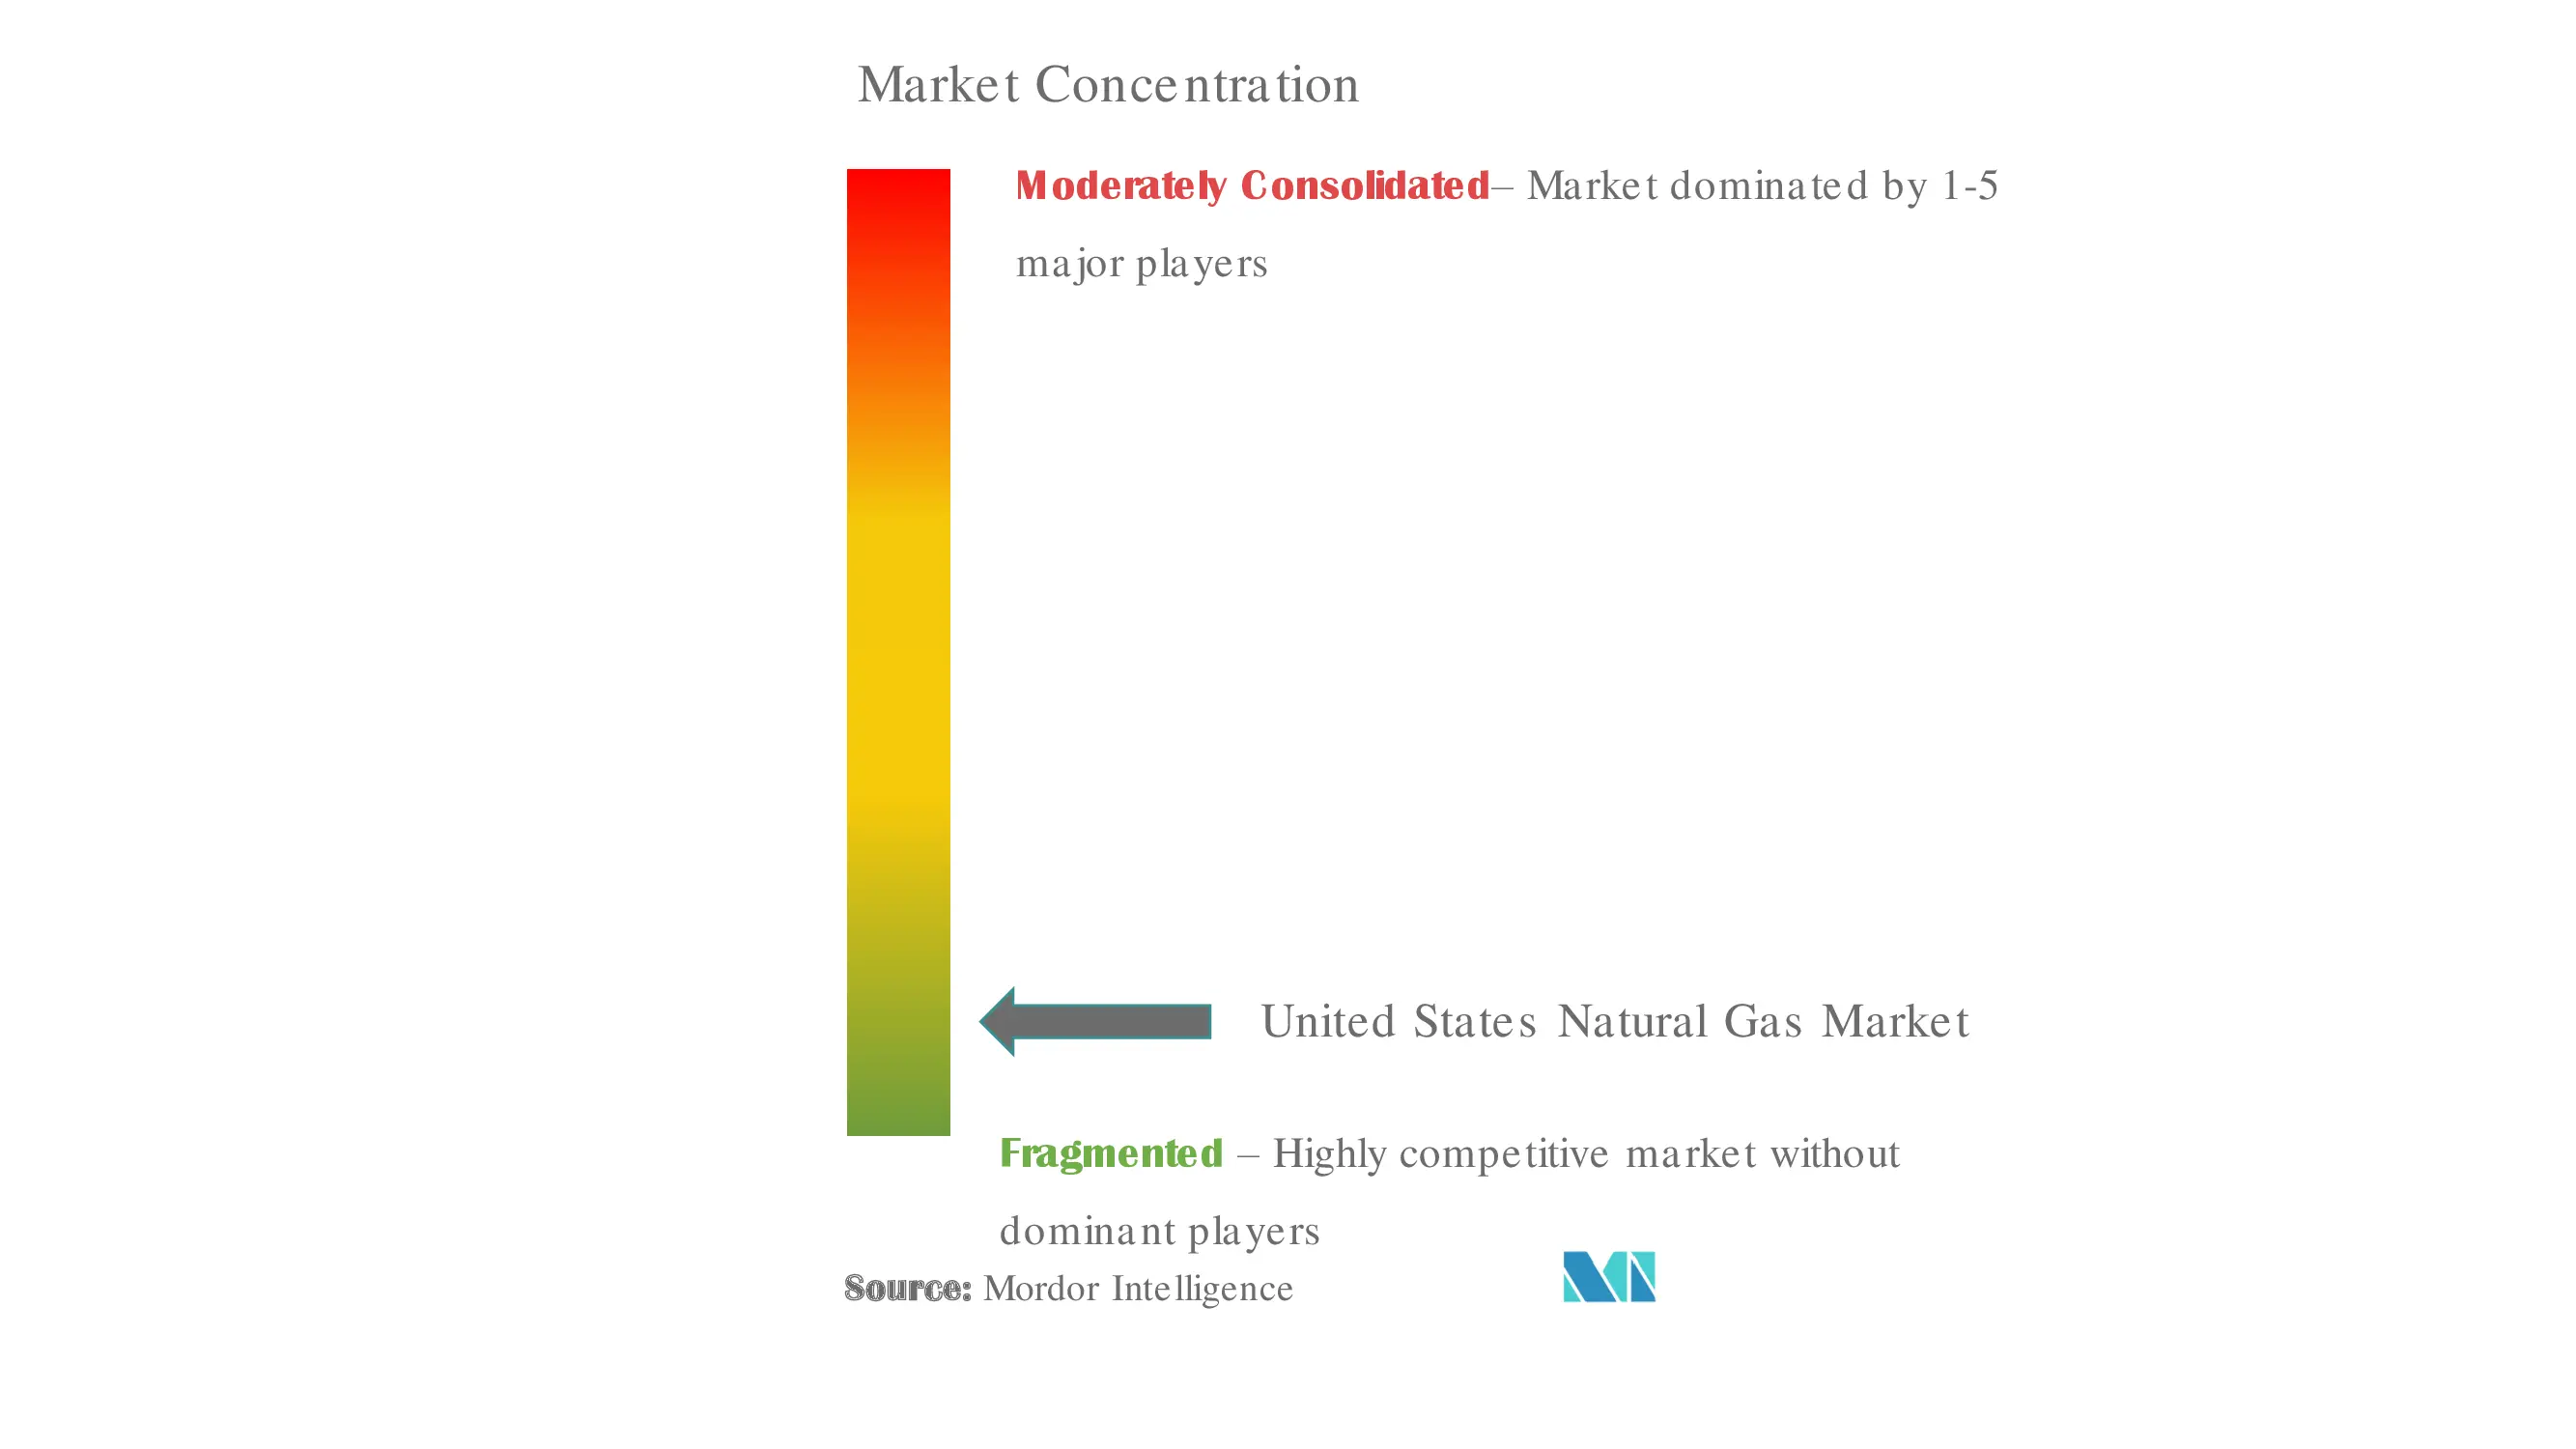
The US natural gas market is fragmented. Some key players in this market (in no particular order) are ExxonMobil Corporation, Chevron Corporation, ConocoPhillips, EOG Resources Inc., and Occidental Petroleum Corporation.
United States Natural Gas Industry Leaders
-
ExxonMobil Corporation
-
Chevron Corporation
-
ConocoPhillips
-
EOG Resources, Inc.
-
Occidental Petroleum Corporation
- *Disclaimer: Major Players sorted in no particular order
Market Opportunities and Future Outlook
A key opportunity area sits at the intersection of gas supply growth and the buildout of midstream capacity that relieves basin bottlenecks and improves deliverability to demand centers and export corridors. Regulatory streamlining provides a tangible catalyst: FERCs May 2026 NOPR (RM25-12-001) to expand and update the blanket certificate program parameters creates a clearer pathway for certain categories of interstate pipeline upgrades and extensions, especially where cost thresholds and procedural steps influence project sequencing and execution.
End-use demand diversification also creates visible whitespace, with large-load industrial demand and digital infrastructure shaping new contracting patterns for gas-fired generation and related gas supply and transportation services. In June 2026, Chevron signed a 20-year power purchase agreement with Microsoft tied to Project Kilby in West Texas, a 2.67 GW natural gas-powered facility dedicated to a data center. That long-tenor offtake supports planning across upstream and midstream in gas-centric regions. In parallel with domestic demand pull, LNG-linked value creation continues to attract integration and capacity positioning, as ExxonMobils Golden Pass Train 1 reached first LNG in Q1 2026, reinforcing Gulf Coast liquefaction as an offtake outlet that can support incremental gathering, processing, and pipeline connectivity.
Recent Industry Developments
- June 2026: Chevron Corporation signed a 20-year power purchase agreement with Microsoft to develop Project Kilby in West Texas, a 2.67 gigawatt natural gas powered facility dedicated to a data center. The arrangement ties gas demand to technology sector energy needs and strengthens gas-fired capacity utilization in Texas.
- April 2026: Chevron Corporation made a final investment decision on the Aseng Gas Monetization Project offshore Equatorial Guinea. The project expands Chevron's LNG export footprint and demonstrates continued international gas monetization investments impacting gas supply dynamics.
- February 2026: EOG Resources, Inc. announced 2026 capital program of $6.3 to $6.7 billion including 585 net wells across domestic US portfolio. The plan signals capital discipline while expanding drilling inventory, with potential impact on US gas supply growth and pricing dynamics.
Research Methodology Framework and Report Scope
Market Definition and Coverage
For this report, the United States natural gas market is defined as the value tied to natural gas volumes supplied for domestic end use. Demand is tracked across power generation, industrial use, residential, and commercial consumption, then valued using observed price benchmarks.
Scope exclusions: the sizing does not include crude oil, natural gas liquids, or midstream fee-only revenues that do not represent the gas commodity value.
Segmentation Overview
- Type
- Wet Natural Gas
- Dry Natural Gas
- End Use
- Power Generation
- Automotive
- Residential
- Industries
Data Sources, Market Sizing, and Validation
Desk Research
Desk work starts with building a consistent fact base for supply, demand, and pricing. Those three items explain most of the movement in natural gas value in the United States. We mainly use public series such as U.S. Energy Information Administration data for production, consumption, storage, and prices, along with Federal Energy Regulatory Commission materials on pipeline and market rules.
To keep the model grounded in trade and industry signals, we also refer to sources such as U.S. Census Bureau trade statistics, Bureau of Labor Statistics price indexes where relevant for energy inflation context, and association publications such as the American Gas Association. Company annual filings, investor presentations, and reputable energy press are used to sanity-check capacity additions, LNG export activity, and storage behavior. Where needed, approved paid datasets are used for company financial intelligence, shipment-level imports and exports, and patent databases to cross-check technology and project activity. The desk research sources listed here are illustrative, and many other public sources were also used to collect data, validate assumptions, and clarify gaps.
Primary Interviews and Surveys
Primary interviews and surveys were used to stress-test the demand pool and the price assumptions, especially where public data is delayed or gets revised. We spoke with a mix of upstream, midstream, utility, power, and large industrial stakeholders. The interviews were balanced across key producing and consuming parts of the United States so regional price spreads and constraints could be reflected. Inputs from these conversations helped us validate storage seasonality, pipeline constraint impacts, and realistic ranges for forward pricing and utilization.
Distribution of primary research fieldwork respondents
| Company type | Respondent position |
|---|---|
| Top tier: 29% | CXOs: 12% |
| Mid tier: 50% | Functional/Unit leaders: 43% |
| Smaller Players: 21% | Managers: 45% |
Market-Sizing & Forecasting
The core model uses top-down demand pool reconstruction, where national and regional consumption volumes are built from official balances and then converted into market value using representative hub prices and realized price spreads. We then corroborate results with selective bottom-up approximations, such as sampling producer sales exposure, checking LNG export terminal utilization against feedgas flows, and applying sampled price-by-volume checks for key end-use clusters.
Practical inputs used in the model include dry gas production, working gas in storage levels, LNG export feedgas volumes, power sector gas burn, and heating degree day patterns that influence residential and commercial consumption. Price inputs are anchored around published spot and futures indicators, and they are adjusted using primary feedback on basis behavior during constraint periods. Forecasts are developed using scenario analysis supported by short time-series smoothing for key drivers, where scenarios mainly reflect different paths for demand growth, storage tightness, and export utilization. When bottom-up checks do not cover smaller end users, gaps are handled through share-based allocation tied back to official sector consumption splits.
Data Validation & Update Cycle
Validation is done by comparing model outputs against independent signals such as reported supply-demand balances, storage injections and withdrawals, and implied pricing movements for the same periods. Any large variances are reviewed, and the assumptions behind volumes, price timing, and regional spreads are revisited before the numbers are finalized.
A second analyst review is completed to check formulas, unit conversions, and year-to-year continuity. This is followed by targeted re-contacts if the market shows unusual shifts such as weather-driven spikes or major LNG ramp-ups. Reports are refreshed annually, and interim updates are made when material events change the outlook. Before delivery, a final check is performed so clients receive the latest updated view.
Mordor Intelligence's United States Natural Gas Market Size Measured Against Other Published Estimates
Published market sizes for United States natural gas can look far apart because the studies are not always counting the same thing, even when the titles sound similar. Differences usually come from what is treated as the market value (commodity sales versus service revenues), whether prices are taken from spot, futures, or blended realized levels, and how LNG and cross-border flows are handled.
Natural gas liquids revenues sit outside Mordor Intelligence's scope here, which is one reason some larger dollar totals appear elsewhere when they bundle liquids, wider oil and gas categories, or midstream service fees into a single number. Another common gap comes from the year used for pricing and currency timing, since gas prices can move quickly and annual averages versus point-in-time prices can change the value. Finally, refresh cadence matters, since storage levels, LNG utilization, and power burn can shift the near-term baseline, and older models may not re-check these signals before publishing.
Benchmark comparison
| Source | Market Size | Gaps in Research Methodology |
|---|---|---|
| Mordor Intelligence | USD 500.00 B (2026) | |
| Industry Portal A | USD 490.53 B (2026) | Uses a broader supply chain description that can mix commodity value with logistics and processing activities, and it may apply longer-range price growth that smooths short-term basis and storage tightness effects. |
| Syndicated Publisher B | USD 155.00 B (2024) | Appears closer to a narrower value definition and may reflect selected end-user or distribution-focused revenues, which can understate the commodity value implied by total national consumption and benchmark prices. |
Looking across the table, the spread mainly tracks how each publisher defines the dollar pool, how price levels are taken across the year, and whether adjacent liquids or service revenues are blended into the market. By keeping the sizing tied to observable consumption volumes and clearly stated pricing inputs, the estimate stays easier to replicate and to update when new storage, LNG, or power demand data is released.
Key Questions Answered in the Report
What is the current United States Natural Gas Market size?
The United States Natural Gas Market is projected to register a CAGR of 4.86% during the forecast period (2026-2031).
Who are the key players in United States Natural Gas Market?
ExxonMobil Corporation, Chevron Corporation, ConocoPhillips, EOG Resources, Inc. and Occidental Petroleum Corporation are the major companies operating in the United States Natural Gas Market.
What years does this United States Natural Gas Market cover?
The report covers the United States Natural Gas Market historical market size for years: 2020, 2021, 2022, 2023 and 2024. The report also forecasts the United States Natural Gas Market size for years: 2025, 2026, 2027, 2028, 2029 and 2030.