Market Overview
| Study Period | 2021 - 2031 |
|---|---|
| Forecast Data Period | 2026 - 2031 |
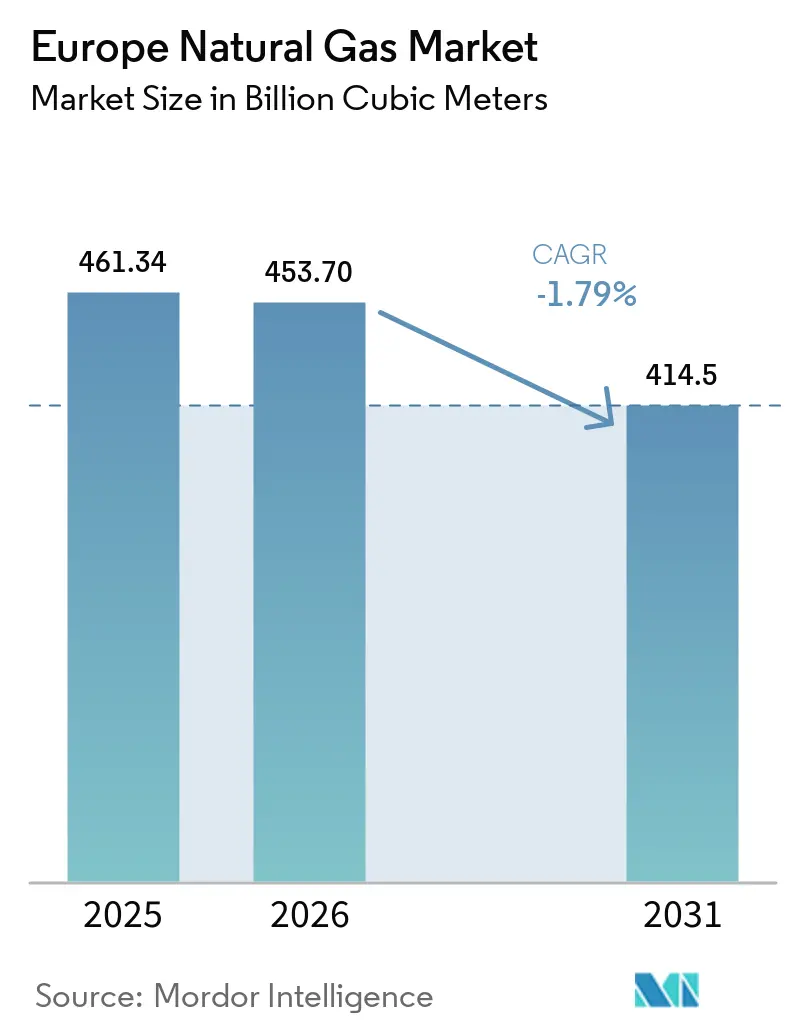
| Base Year Market Size (2025) | 461.34 Billion cubic meters |
| Market Volume (2026) | 453.70 Billion cubic meters |
| Market Volume (2031) | 414.5 Billion cubic meters |
| Growth Rate (2026 - 2031) | -1.79% CAGR |
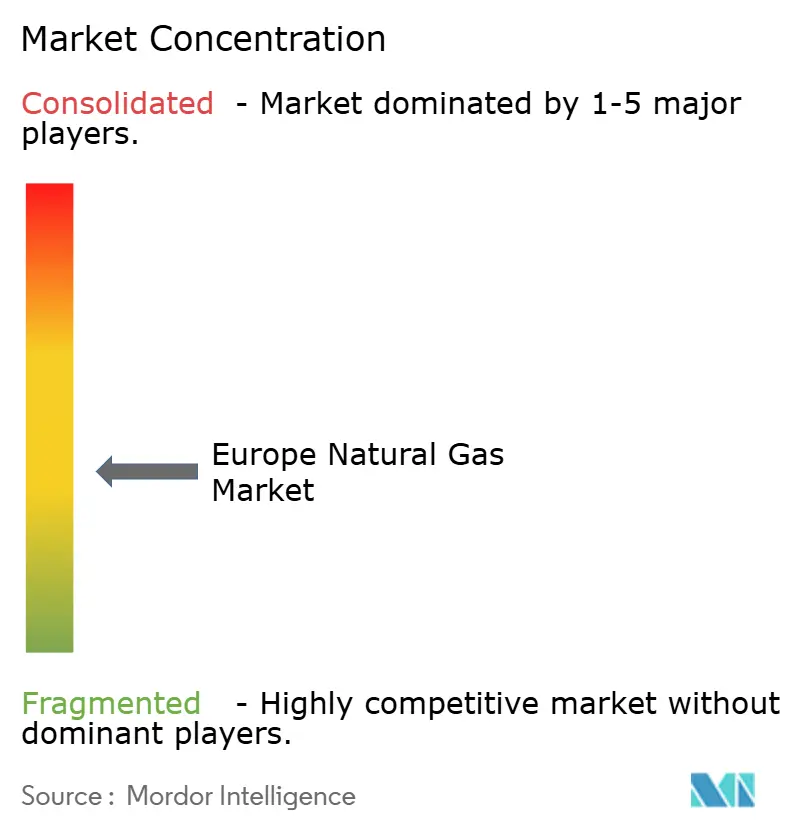
| Market Concentration | Medium |
Major Players *Disclaimer: Major Players sorted in no particular order Image © Mordor Intelligence. Reuse requires attribution under CC BY 4.0. | |
Europe Natural Gas Market Analysis by Mordor Intelligence
The Europe Natural Gas Market size is projected to contract from 461.34 Billion cubic meters in 2025 and 453.70 Billion cubic meters in 2026 to 414.5 Billion cubic meters by 2031, registering a CAGR of -1.79% between 2026 to 2031.
Europe’s managed decline is driven by binding decarbonization targets, soaring carbon prices, and accelerated electrification, yet the headline contraction masks resilient growth pockets. Liquefied natural gas (LNG) infrastructure continues to expand as floating storage regasification units (FSRUs) and small-scale terminals strengthen supply-security in the Baltic and North Sea regions.[1]GIE Analysts, “European LNG Regasification Capacity Reaches 270 BCM,” Gas Infrastructure Europe, gie.eu Central and Eastern European states, led by Poland, are prioritizing LNG and new pipeline routes to diversify away from Russian imports, while hydrogen-ready upgrades bolster asset longevity across Western Europe.[2]Bundesnetzagentur, “Germany Approves 9,040 km Hydrogen Core Network,” Bundesnetzagentur, bundesnetzagentur.de The pivot toward flexible, fuel-agnostic assets lowers stranding risk, and long-term offtake contracts with integrated majors improve cash-flow visibility. Competitive intensity has risen now that Gazprom’s presence has collapsed, enabling Shell, TotalEnergies, Equinor, and others to lock in multi-year supply agreements and co-invest in hydrogen-ready pipeline conversions.[3]Financial Times Reporters, “Gazprom’s European Share Falls to 13%,” Financial Times, ft.com
Key Report Takeaways
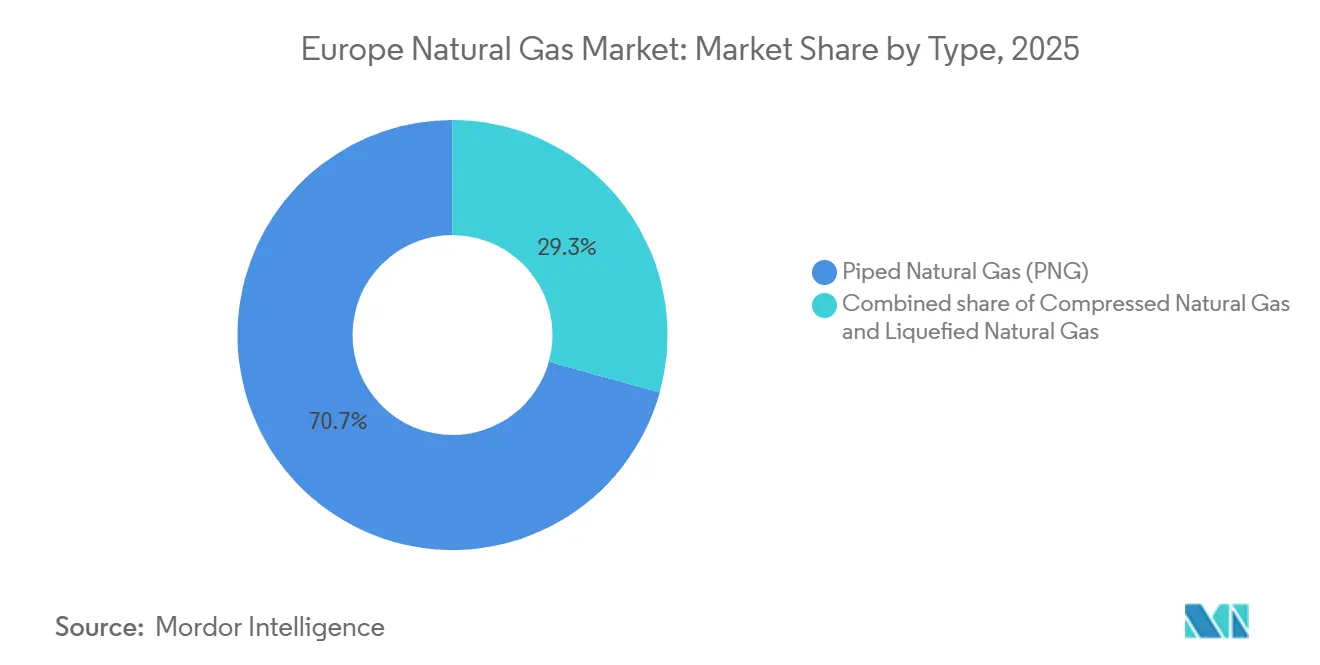
- By type, piped natural gas led with 70.7% of the Europe natural gas market share in 2025, while LNG is expected to advance at a 3.5% CAGR through 2031.
- By source, LNG imports captured 40.4% of supply in 2025 and remain the only category set to grow and is expected to expand at a 2.7% CAGR to 2031.
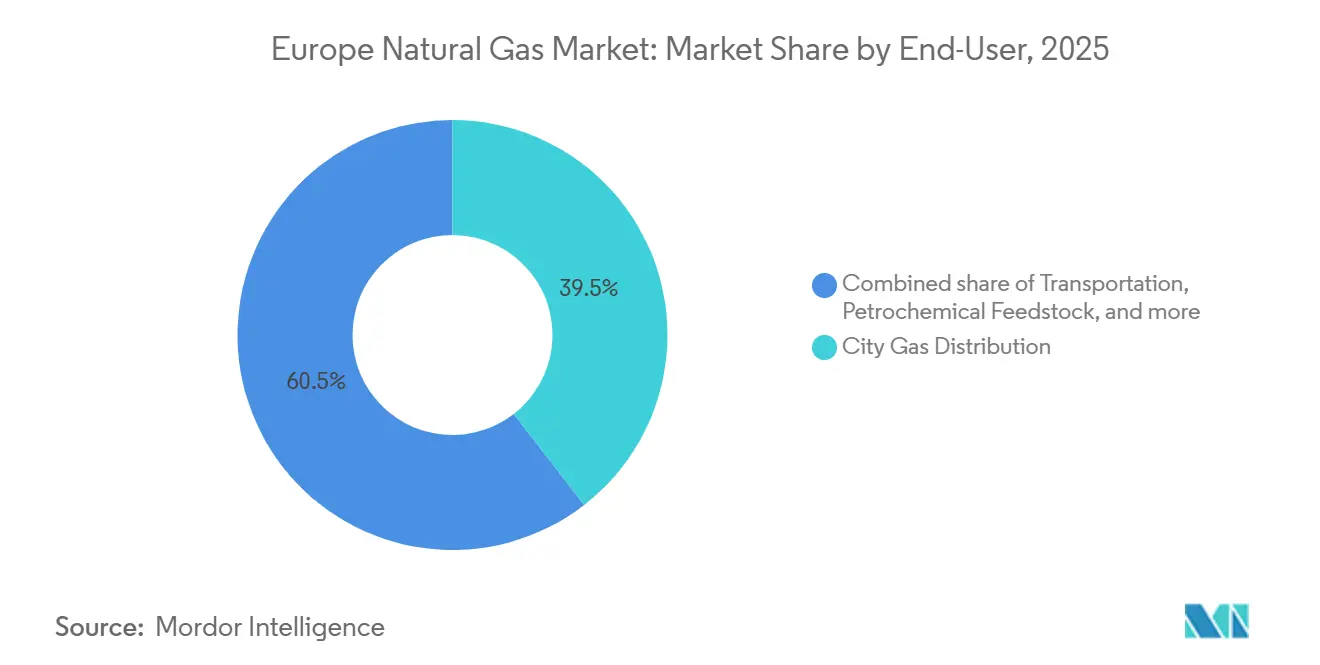
- By end-use sector, city gas distribution accounted for 39.5% of the Europe natural gas market size in 2025; transportation is projected to expand at a 4.1% CAGR to 2031.
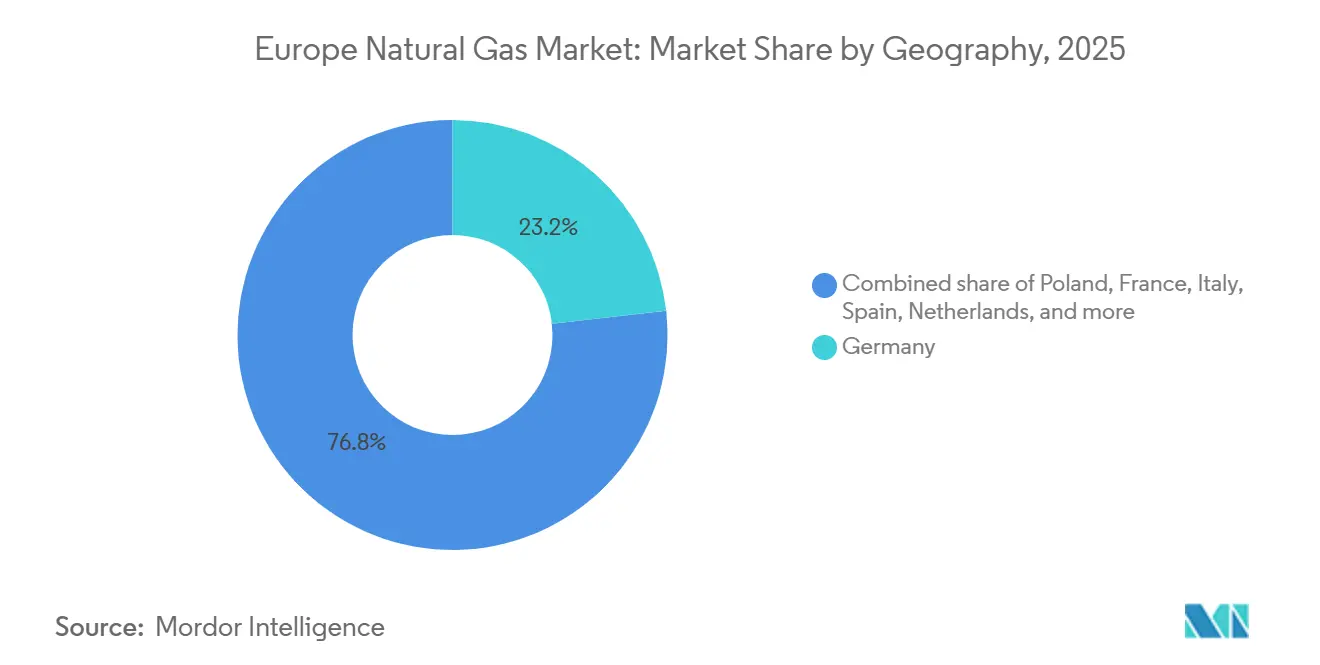
- By geography, Germany held a 23.2% share in 2025, whereas Poland is the fastest-growing country and is expected to grow at a 4.4% CAGR over the forecast horizon.
Note: Market size and forecast figures in this report are generated using Mordor Intelligence’s proprietary estimation framework, updated with the latest available data and insights as of 2026.
Europe Natural Gas Market Trends and Insights
Drivers Impact Analysis*
| Driver | (~) % Impact on CAGR Forecast | Geographic Relevance | Impact Timeline |
|---|---|---|---|
| Coal-to-gas switching in power & district-heating fleets | +0.6% | Germany, Poland, Netherlands, Central Europe | Short term (≤ 2 years) |
| Expansion of European LNG regasification capacity | +0.8% | Poland, Germany, Netherlands, Baltic states | Medium term (2-4 years) |
| Policy support for gas as a transition fuel under Fit-for-55 | +0.4% | EU-wide, strongest in Germany, France, Italy | Medium term (2-4 years) |
| Growth of small-scale LNG bunkering infrastructure in Baltic & North Seas | +0.3% | Poland, Lithuania, Netherlands, Norway, Baltic & North Sea ports | Medium term (2-4 years) |
| Hydrogen-ready pipeline retrofits lowering stranded-asset risk | +0.5% | Germany, Netherlands, France, Spain (H2Med corridor) | Long term (≥ 4 years) |
| Source: Mordor Intelligence | |||


Coal-to-Gas Switching in Power & District Heating Fleets
Municipal operators in Germany and Poland continue migrating from aging coal boilers to gas-fired combined heat and power units as carbon-allowance prices climbed to EUR 83.79 per tonne CO₂ in December 2025 and are heading toward EUR 149 by 2030.[4]Bloomberg Energy Desk, “EU Carbon Prices Hit EUR 83.79 per Tonne,” Bloomberg, bloomberg.com Mid-sized cities favor incremental gas conversions because district-heating grids often lack capacity for large-scale heat pumps. The opportunity window, however, is narrowing as Title Transfer Facility (TTF) prices occasionally exceed coal-switching thresholds, reducing baseload gas economics. While gas-fired electricity output slipped 6% in 2024, near-term compliance deadlines under the Energy Efficiency Directive still support residual switching in heating. As grid upgrades and renewables proliferate, district-heating gas demand is expected to plateau after 2029, reinforcing the European natural gas market’s structural decline even as short-term gains persist.
Expansion of European LNG Regasification Capacity
Europe’s regasification capacity jumped 32% between 2022 and 2025 to roughly 270 BCM per year, propelled by rapid FSRU deployments in Germany and expansions in Poland and the Netherlands. Germany alone commissioned 44.8 BCM of import capacity across Wilhelmshaven, Brunsbüttel, Lubmin, and Stade within 24 months. Poland’s Gdańsk FSRU and Świnoujście upgrade now provide 14.4 BCM combined, giving Warsaw surplus volumes for regional exports. Lithuania’s Klaipėda terminal underscores the rise of small-scale reloads, posting 1,834 truck loadings in 2025. Forecast additions could lift capacity to 405 BCM by 2030, implying significant over-build if demand trends hold, so asset owners increasingly seek long-term offtake partners to mitigate utilization risk.
Policy Support for Gas as a Transition Fuel Under Fit-for-55
The Fit-for-55 package labels natural gas a bridge fuel, provided renewable and low-carbon gases reach 66% of total use by mid-century. This stance unlocks Connecting Europe Facility grants for hydrogen-ready retrofits such as Spain’s EUR 75.8 million H2Med corridor and Germany’s EUR 19 billion hydrogen core grid. Transmission system operators have accelerated capex, aiming to blend up to 15% hydrogen by volume where regulators allow. The strategy preserves the regulated asset base and eases stranded-asset fears, yet success hinges on timely green-hydrogen scale-up. Any electrolyzer delays would leave repurposed pipelines underutilized, diluting projected returns.
Growth of Small-Scale LNG Bunkering Infrastructure in Baltic & North Seas
Ship-to-ship LNG bunkering is expanding quickly to meet IMO sulfur limits in emission-control areas. Świnoujście executed its first STS operation in November 2025 following a PLN 27.88 million EU grant, cutting logistics costs for LNG-powered vessels. Klaipėda handled 26 small-scale carriers during 2025, a 30% year-on-year rise. The Netherlands’ FirstBio2Shipping plant brings 2,400 tonnes of bio-LNG annually online, opening the door for renewable drop-in fuels. Europe counted 780 LNG truck refueling stations in 2025, up from 200 in 2019. Still, battery-electric and hydrogen alternatives could curb long-run terminal utilization, prompting operators to diversify fuels and target flexible service models.
Restraints Impact Analysis*
| Restraint | (~) % Impact on CAGR Forecast | Geographic Relevance | Impact Timeline |
|---|---|---|---|
| Geopolitical supply disruptions after Russia–Ukraine war | -1.2% | EU-wide, acute in Germany, Italy, Austria | Short term (≤ 2 years) |
| EU 2040 decarbonisation target accelerating electrification | -0.9% | EU-wide, strongest in Germany, France, Netherlands | Long term (≥ 4 years) |
| Mandatory biomethane blending quotas reducing fossil-gas demand | -0.4% | Germany, France, Austria, Netherlands, Italy | Medium term (2-4 years) |
| Source: Mordor Intelligence | |||
Geopolitical Supply Disruptions After Russia–Ukraine War
Russian pipeline flows plunged from about 40% of EU supply in 2021 to 13% in 2025 as sanctions and the transit-agreement expiry forced diversification. The European Commission now seeks a full Russian-gas ban by the end of 2027, funneling demand to LNG spot markets and Norwegian pipelines. Norway supplied 31% of EU needs in 2025, yet flat output limits future upside. Inventory dipped to 40% in February 2025, below the 50% regulatory minimum, sparking price spikes and industrial curtailments. Utilities remain hesitant to sign 20-year LNG deals at elevated prices, prolonging supply-risk premiums and deterring new liquefaction investments.
EU 2040 Decarbonization Target Accelerating Electrification
The July 2025 proposal for a 90% greenhouse-gas cut by 2040 effectively caps unabated-gas use after that date. Electricity’s share of final energy is slated to rise from 27% in 2025 to 50% by 2040, displacing gas in space heating and industrial processes. Heat-pump uptake in France and Sweden continues to erode residential gas demand. Steelmakers and chemical firms are shifting toward electric arc furnaces and hydrogen pathways, trimming feedstock needs. With new gas plants facing an economic life of barely 14 years, investors are reluctant to commit, reinforcing the European natural gas market’s long-term contraction trajectory.
*Our forecasts treat driver/restraint impacts as directional, not additive. The impact forecasts reflect baseline growth, mix effects, and variable interactions.
Segment Analysis
By Type: LNG Flexibility Offsets PNG Decline
Piped natural gas retained 70.7% of the Europe natural gas market share in 2025, reflecting decades of network build-out that offers low tariffs of EUR 2–4 per MWh. Pipeline volumes, however, decline as legacy Russian contracts expire and residential electrification widens, shrinking the European natural gas market size allocated to PNG. LNG, although costlier at EUR 6–8 per MWh delivered, is forecast to expand 3.5% annually through 2031 thanks to new FSRUs and flexible spot-purchase options.
LNG’s adaptability makes it the favored marginal source for utilities balancing volatile renewables. Small-scale LNG also supports trucking and marine bunkering, reinforcing downstream growth. Compressed natural gas remains niche, with 786 refueling stations mainly in Italy, France, and Germany. Competing drivetrain technologies restrict CNG’s headroom, and total demand is set to plateau late in the decade. Overall, LNG’s expansion partially cushions pipeline-volume erosion, slowing, but not reversing, the European natural gas market’s aggregate decline.


By Source: LNG Imports Dominate Post-Russia Reconfiguration
LNG imports controlled 40.4% of supply in 2025 and will rise modestly at a 2.7% CAGR, the only source recording absolute growth. The United States shipped 57% of EU LNG cargoes in 2025, a leap from negligible volumes a decade earlier. This shift boosts the European natural gas market size for imported LNG even as total demand trends lower. Domestic offshore production, mainly Norwegian continental-shelf gas, remains vital at 122.8 BCM in 2024 but is nearing a plateau owing to resource maturity.
Onshore European output continues to shrink after the Dutch Groningen closure in 2024. Reliance on long-haul LNG introduces transatlantic weather- and licensing-related exposures, compelling terminal operators to secure diverse offtake contracts. Spain’s seven terminals, running at only one-third utilization, illustrate latent capacity that could unlock regional flexibility once cross-border interconnectors expand.
By End-Use Sector: Transportation Gains as Industrial Demand Softens
City gas distribution still formed the largest slice of the Europe natural gas market size at 39.5% in 2025, but its trajectory is downward as building codes favor electrification. Germany’s residential-and-commercial demand slid 12% in 2024 as heat-pump subsidies took hold. Transportation, in contrast, is advancing at a 4.1% CAGR, propelled by LNG bunkering and heavy-truck adoption across 780 fueling stations. Bio-LNG blends in France and biomethane in Italy further enhance the segment’s decarbonization credentials.
Industrial feedstock use shows persistent weakness. Fertilizer and petrochemical firms idled capacity during the 2022-23 price spike and have restarted only selectively, with Yara’s Sluiskil ammonia plant still running below 70%. Steelmakers pivoting to hydrogen and electric furnaces aggravate declines. Consequently, transportation’s growth only partially offsets weakening industrial baseload, reinforcing a net downtrend in the European natural gas market.
Geography Analysis
Germany remained the largest single market at 23.2% share in 2025, yet volumes slipped as industrial output fell and renewables displaced gas-fired power. Four German FSRUs adding 44.8 BCM per year have insulated supply security, while the EUR 19 billion hydrogen core network seeks to repurpose 9,040 kilometers of pipelines by 2032. These moves cushion stranded-asset risk, though overall German demand is expected to keep drifting lower.
France and Italy occupy the next tiers, each pursuing aggressive biomethane blending along with hydrogen-ready grid upgrades. Italy’s transport sector already sources 60% of natural-gas vehicle fuel from biomethane, highlighting a pathway to keep infrastructure relevant even as conventional gas recedes. Spain and the Netherlands serve as import hubs; Spain’s 73.4 BCM of regas capacity operated at roughly 30% utilization in 2025, suggesting room to grow cross-border gas-for-hydrogen swaps over time.
Poland stands out as the fastest-growing geography with a 4.4% CAGR as energy-security priorities outweigh broader EU demand contraction. The Baltic Pipe and dual LNG terminals give Poland 24.4 BCM of diversified capacity against domestic use of 21.5 BCM, positioning Warsaw as a regional swing supplier. Elsewhere, the Rest of Europe category shows mixed dynamics: Austria’s 9.75% renewable-gas mandate, Greece’s Alexandroupolis FSRU, and Belgium’s ammonia-cracking plans each address unique national priorities while remaining within the broader EU regulatory umbrella.
Competitive Landscape
Gazprom’s fall from 40% market share in 2021 to 13% in 2025 dramatically reshaped competition, opening space for integrated majors to scale. Shell, TotalEnergies, Equinor, BP, and Eni collectively managed about 38% of European LNG capacity last year, tightening control of flexible supply channels. TotalEnergies deepened vertical integration through a EUR 5.1 billion joint venture with EPH that consolidated 14 GW of gas-fired plants across five countries, adding roughly USD 750 million in annual cash flow.
Equinor secured a GBP 20 billion, 10-year contract with Centrica to deliver 5 BCM per year to the U.K., a move ensuring steady monetization of plateauing Norwegian output. Enagás earmarked EUR 3.125 billion for hydrogen pipelines, signaling a pivot toward low-carbon molecules. Asset repositioning extends to midstream: SEFE’s purchase of WIGA hands it 4,150 kilometers of German pipelines, creating optionality for hydrogen transport. Competitive advantage now hinges on portfolio diversity, hydrogen-ready infrastructure, and long-term offtake depth rather than mere throughput volumes, mirroring the European natural gas market’s transition era.
Europe Natural Gas Industry Leaders
Chevron Corporation
BP PLC
Shell PLC
TotalEnergies SE
Eni S.p.A.
- *Disclaimer: Major Players sorted in no particular order

Recent Industry Developments
- February 2026: Equinor and Eneco signed a 5-year deal to supply 0.5 BCM per year of low-carbon Norwegian gas to the Netherlands.
- February 2026: Shell and METLEN agreed on 0.5–1.0 BCM per year of LNG for Greek terminals from 2027 to 2031.
- January 2026: Enagás obtained approval for 42 hydrogen-injection plants across Spain, advancing its EUR 3.125 billion hydrogen plan.
- December 2025: Germany enacted RED III, lifting the GHG-reduction quota to 59% by 2040 and adding advanced-biofuel and RFNBO sub-mandates.


Europe Natural Gas Market Report Scope
Natural gas is a fossil energy source that forms deep beneath the Earth's surface. Natural gas contains many different compounds. The largest component of natural gas is methane, a compound with one carbon atom and four hydrogen atoms (CH4). The European natural gas market scope includes:
By Type
| Compressed Natural Gas (CNG) |
| Piped Natural Gas (PNG) |
| Liquefied Natural Gas (LNG) |
By Source
| Domestic Production – Onshore |
| Domestic Production – Offshore |
| LNG Imports |
By End-Use Sector
| Fertilizer Production |
| City Gas Distribution |
| Transportation |
| Petrochemical Feedstock |
| Others [Industrial Manufacturing, Agriculture (Tea Plantation), IC for Pipeline System, LPG Shrinkage, Sponge Iron/Steel] |
By Geography
| Germany |
| France |
| Italy |
| Spain |
| Netherlands |
| Norway |
| Poland |
| Rest of Europe |
| By Type | Compressed Natural Gas (CNG) |
| Piped Natural Gas (PNG) | |
| Liquefied Natural Gas (LNG) | |
| By Source | Domestic Production – Onshore |
| Domestic Production – Offshore | |
| LNG Imports | |
| By End-Use Sector | Fertilizer Production |
| City Gas Distribution | |
| Transportation | |
| Petrochemical Feedstock | |
| Others [Industrial Manufacturing, Agriculture (Tea Plantation), IC for Pipeline System, LPG Shrinkage, Sponge Iron/Steel] | |
| By Geography | Germany |
| France | |
| Italy | |
| Spain | |
| Netherlands | |
| Norway | |
| Poland | |
| Rest of Europe |


Key Questions Answered in the Report
What volume does the Europe natural gas market expect by 2031?
The market is forecast to reach 414.56 BCM in 2031, down from 453.70 BCM in 2026.
How fast will LNG grow within European supply?
LNG volumes are projected to expand at a 3.5% CAGR through 2031, the only segment in sustained growth.
Which country is the fastest-growing consumer?
Poland is advancing at a 4.4% CAGR on the back of Baltic Pipe inflows and new LNG capacity.
How will EU climate policy affect gas demand?
The proposed 90% emissions-reduction target for 2040 accelerates electrification, driving structural demand decline.
Which companies hold leading positions after Gazprom's retreat?
Shell, TotalEnergies, Equinor, BP, and Eni collectively manage 38% of European LNG import infrastructure.
Page last updated on:


