North America Biofertilizer Market Size and Share
Market Overview
| Study Period | 2018 - 2031 |
|---|---|
| Forecast Data Period | 2026 - 2031 |
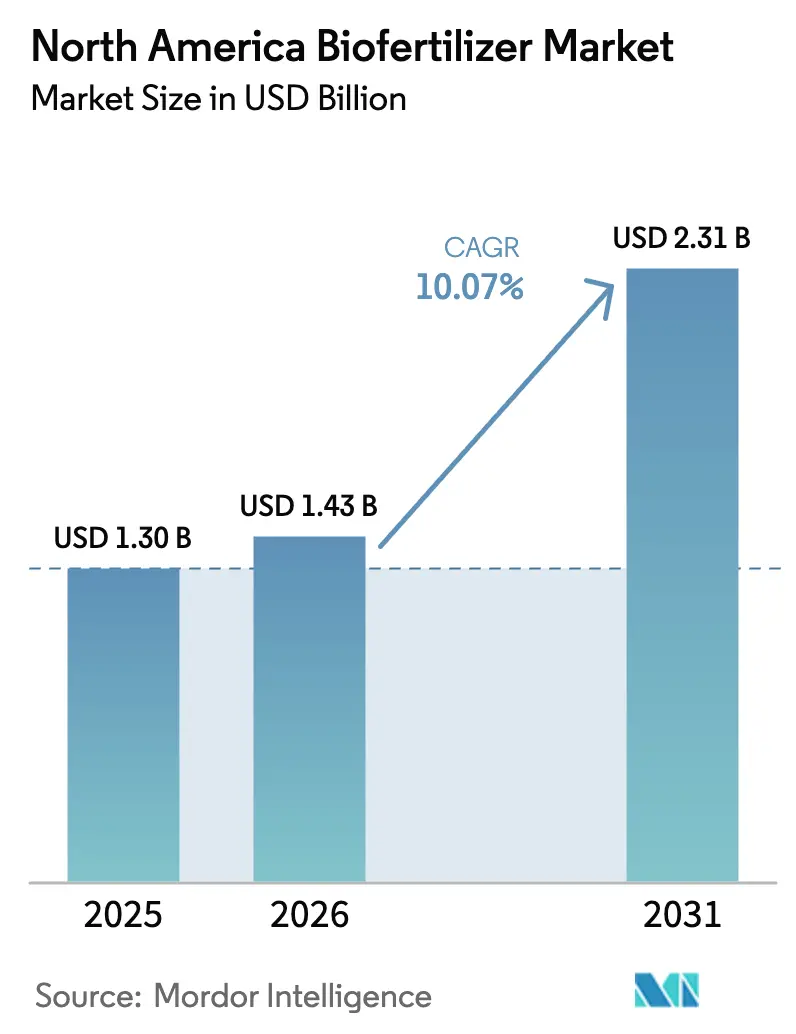
| Base Year Market Size (2025) | USD 1.30 Billion |
| Market Size (2026) | USD 1.43 Billion |
| Market Size (2031) | USD 2.31 Billion |
| Growth Rate (2026 - 2031) | 10.07% CAGR |
| Market Concentration | Low |
Major Players *Disclaimer: Major Players sorted in no particular order Image © Mordor Intelligence. Reuse requires attribution under CC BY 4.0. | |
North America Biofertilizer Market Analysis by Mordor Intelligence
The North America biofertilizer market size was valued at USD 1.30 billion in 2025 and estimated to grow from USD 1.43 billion in 2026 to reach USD 2.31 billion by 2031, at a CAGR of 10.07% during the forecast period (2026-2031). The growth reflects stronger state and federal incentives for organic cultivation, widening opportunities to monetize carbon credits, and sustained pressure from retailer sustainability mandates. Volatile synthetic fertilizer prices, which fluctuated between USD 600-800 per metric ton in 2024, continue to encourage growers to hedge input risks with biological alternatives. Technology breakthroughs in shelf-stable liquid consortia now extend product viability past 18 months, solving long-standing last-mile distribution challenges. At the same time, low market concentration unlocks space for nimble biotechnology entrants pursuing novel microbial formulations that meet evolving soil health and climate goals.
Key Report Takeaways
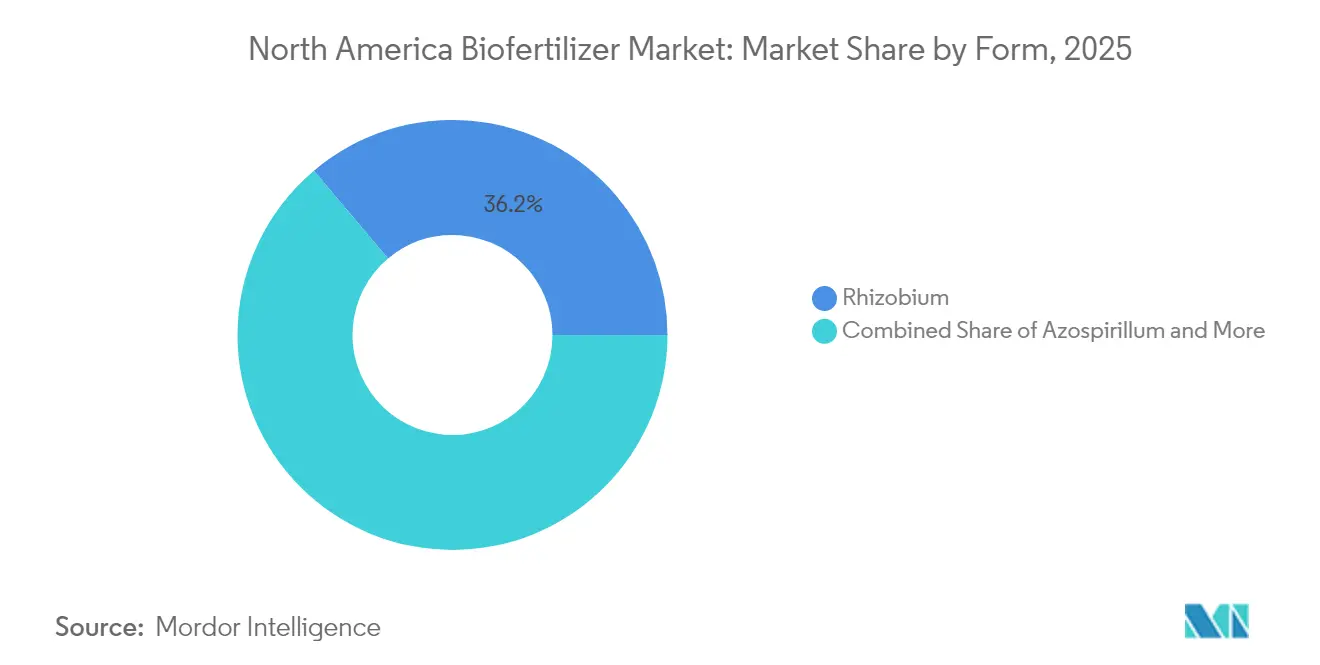
- By Form, Rhizobium captured 36.15% of the North America biofertilizer market share in 2025 and is advancing at a 10.58% CAGR through 2031.
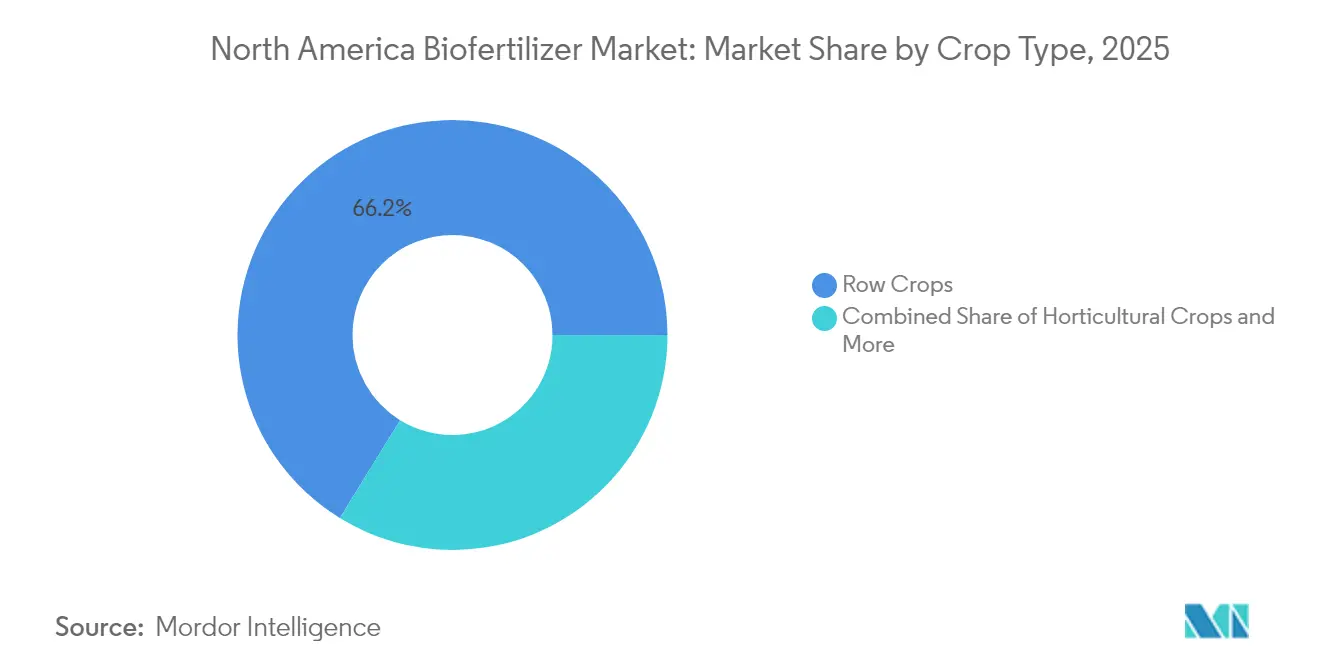
- By Crop Type, row crops held a 66.22% share of the North America biofertilizer market size in 2025 and are growing at a 10.26% CAGR to 2031.
- By Geography, the United States accounted for 47.72% of the North America biofertilizer market in 2025 while posting the fastest 12.45% CAGR through 2031.
Note: Market size and forecast figures in this report are generated using Mordor Intelligence’s proprietary estimation framework, updated with the latest available data and insights as of 2026.
North America Biofertilizer Market Trends and Insights
Drivers Impact Analysis*
| Driver | (~) % Impact on CAGR Forecast | Geographic Relevance | Impact Timeline |
|---|---|---|---|
| Regulatory incentives for organic cultivation | +2.1% | United States and Canada, with Mexico implementing 2025 | Medium term (2-4 years) |
| Premium pricing for organic produce and consumer pull | +1.8% | North America, strongest in California and Northeast US | Long term (≥ 4 years) |
| High synthetic fertilizer price volatility | +2.3% | Global, with acute impact in energy-dependent US regions | Short term (≤ 2 years) |
| Carbon credit monetization for nitrogen reduction | +1.7% | United States and Canada, pilot programs in Mexico | Medium term (2-4 years) |
| Retailer Scope-3 emission mandates on growers | +1.4% | North America, led by major retail chains | Medium term (2-4 years) |
| Shelf-stable liquid consortia unlocking last-mile distribution | +1.0% | North America, addressing rural distribution challenges | Short term (≤ 2 years) |
| Source: Mordor Intelligence | |||
Regulatory incentives for organic cultivation
Federal and state programs continue to direct significant capital toward biological inputs. The United States Department of Agriculture (USDA) expanded its BioPreferred program in recent years to include more biofertilizer categories, and California’s Healthy Soils Program allocated substantial funding to carbon farming practices that explicitly favor biological products.[1]Source: California Department of Food and Agriculture, “Healthy Soils Program Awards,” CDFA.CA.GOV Mexico’s recent bioinput legislation promises financial incentives for firms reducing chemical fertilizer use, solidifying continental policy alignment. Accelerated registrations are now clear in a shorter timeframe compared to previous durations, which speeds the commercialization of new microbial strains. Dual-certified products that serve both organic and conventional growers are becoming more common because they simplify procurement decisions for diversified farms. Collectively, these measures create predictable demand signals that justify private investment in capacity and research and development.[2]Source: Economic Research Service, “Drivers of Fertilizer Markets: Supply, Demand, and Prices,” ERS.USDA.GOV
Premium pricing for organic produce and consumer pull
Organic food sales in the United States have shown significant growth and continue to maintain a notable price premium over conventional produce. Even during periods of inflation, consumers have demonstrated a strong preference for certified organic offerings, encouraging specialty crop growers to adopt input regimes compatible with organic labels. Farm-gate returns have improved for select fruits and vegetables, helping to offset the higher per-unit cost of biological inputs. Retailers such as Walmart now utilize digital traceability tools to track greenhouse gas footprints back to individual farms, incentivizing suppliers who use biofertilizers to reduce synthetic nitrogen. Geographic hot spots have emerged in regions like California, the Pacific Northwest, and the Northeast, where household organic penetration is considerably higher than the national average.
High synthetic fertilizer price volatility
Anhydrous ammonia prices fluctuated significantly during the year, influenced by changes in natural gas markets. Phosphate prices experienced a notable increase over several months, while potash also saw substantial gains due to trade tensions. These sudden changes increased working-capital requirements for growers, as conventional fertilizer often represents a significant portion of row-crop operating costs. Biofertilizers, although higher in cost on a per-nutrient basis, offer more stable pricing and reduced exposure to energy market volatility, which is particularly beneficial during budgeting periods. Crop advisors are increasingly evaluating the total cost of ownership rather than focusing solely on first-year nutrient equivalence, highlighting multi-season benefits that make biological solutions appealing even when synthetic fertilizer prices temporarily decrease.
Carbon credit monetization for nitrogen reduction
Agricultural carbon programs now offer payments for verified reductions in synthetic nitrogen use, and biofertilizer usage qualifies under these protocols. Standardized measurement and verification frameworks have lowered transaction costs, opening participation to midsize farms. In Canada, federal carbon pricing further enhances the revenue potential for biological nitrogen fixation. Food brands seeking lower scope 3 emissions increasingly contract directly with growers and embed per-bushel bonuses for documented fertilizer reductions. These combined incentives turn biofertilizers from cost centers into revenue sources, accelerating adoption even among conventionally managed acres.
Restraints Impact Analysis*
| Restraint | (~) % Impact on CAGR Forecast | Geographic Relevance | Impact Timeline |
|---|---|---|---|
| Short shelf life and cold-chain sensitivity | -1.2% | North America, acute in Mexico and rural US regions | Short term (≤ 2 years) |
| Cheaper chemical fertilizer substitutes | -0.9% | Global, with regional variations based on energy costs | Medium term (2-4 years) |
| Patchwork state-level regulation and label heterogeneity | -0.7% | United States and Canada, interstate commerce barriers | Long term (≥ 4 years) |
| Limited cold-chain infrastructure in Mexico | -0.5% | Mexico and southern US border regions | Medium term (2-4 years) |
| Source: Mordor Intelligence | |||
Short shelf life and cold-chain sensitivity
Many microbial inoculants still require cold storage, and viability can significantly drop within a few months at ambient temperatures. Distribution costs increase when refrigerated freight is necessary, a challenge particularly evident in rural areas of Mexico and the southern United States. Research indicates that optimized fermentation processes can enhance cell counts, which helps maintain activity during transit[3]Source: Plants Journal, “Microbial Inoculants in Sustainable Agriculture,” MDPI.COM. Companies are also investing in lyophilization and microencapsulation, but these processes raise unit costs and may deter price-sensitive growers. Until stabilization technologies mature further, cold-chain dependence will temper market velocity.
Cheaper chemical fertilizer substitutes
When natural gas prices eased in late 2024, anhydrous ammonia briefly fell, narrowing the cost gap with biological inputs. A few firms dominate U.S. nitrogen production capacity, enabling pricing moves that can undercut biofertilizers during troughs. Nutrient density also favors synthetics at face value, as biologicals often require higher application volume to attain comparable crop response. Although multi-year soil health benefits tilt life-cycle economics toward biofertilizers, growers making annual purchasing decisions may delay adoption during periods of low conventional prices.
*Our forecasts treat driver/restraint impacts as directional, not additive. The impact forecasts reflect baseline growth, mix effects, and variable interactions.
Segment Analysis
By Form: Rhizobium Leads Nitrogen Innovation
Rhizobium-based solutions generated 36.15% of the North America biofertilizer market size in 2025, owing to decades of proven nitrogen fixation in soybean and pulse crops. New research now validates associative nitrogen fixation in non-legume cereals, broadening the addressable acreage. Advanced liquid consortia keep microbial viability stable for up to 25 months, a breakthrough that eases inventory management for distributors serving multi-crop retailers. Azospirillum and Azotobacter products are gaining share in corn and wheat, while mycorrhizal inoculants find traction in high-value horticulture where soil health premiums justify higher spend. Phosphate-solubilizing bacteria represent an emerging niche as phosphate fertilizer prices remain elevated above USD 780 per metric ton. Companies are also bundling nutrient and biocontrol traits in a single jug to justify EPA registration costs and differentiate from commodity strains.
Over the forecast horizon, Rhizobium retains category leadership because it aligns with existing crop insurance and carbon credit protocols that quantify nitrogen offset benefits. The segment’s 10.58% CAGR outpaces most chemical fertilizer categories, underscoring its strategic relevance to nutrient management plans. Shelf-stable formulations decrease freight frequency, lowering landed cost in remote counties. Public-private grants under the USDA Fertilizer Production Expansion Program have targeted scale-up of Rhizobium manufacturing lines, ensuring domestic supply security. Collectively, these drivers maintain the segment’s central role in the North America biofertilizers market.


By Crop Type: Row Crops Drive Volume Growth
Row crops commanded 66.22% of the North America biofertilizer market share in 2025, reflecting the sheer scale of corn-soybean rotations covering nearly 180 million acres. Growers see immediate value in nitrogen-fixing inoculants that cushion them from volatile anhydrous ammonia prices. Carbon programs that reward synthetic nitrogen reduction push adoption further, driving a 10.26% CAGR for row-crop applications through 2031. Rising corn production for ethanol and export markets intensifies nutrient demand, positioning biofertilizers as a hedge against high-input cost seasons.
Specialty horticultural segments expand more slowly in volume but command premium price points and stronger consumer narratives around organic and regenerative agriculture. Fresh produce growers in California and Florida leverage biofertilizers to secure organic certification, where retail premiums remain in the 20-40% range. Cash crops such as cotton and sugarcane explore microbial solutions for phosphorus and potassium mobilization, diversifying the product pipeline. Across all acreage, field trials increasingly focus on stackable benefits, such as yield stability under water stress and disease suppression, reinforcing biofertilizers’ contribution beyond simple nutrient replacement.
Geography Analysis
The United States remains the powerhouse of the North America biofertilizers market, accounting for nearly half of 2025 revenues and retaining a robust 12.45% CAGR outlook. USDA grants under the Fertilizer Production Expansion Program are building domestic capacity while smoothing supply chain bottlenecks. Within the country, California leads specialty-crop uptake through generous soil health incentives, whereas the Midwest integrates biofertilizers into corn-soybean systems to buffer against synthetic nitrogen volatility. Streamlined EPA registrations now approve new microbial strains within 15 months, enabling faster commercial rollouts and reinforcing market momentum.
Canada contributes a meaningful growth vector despite climate and logistics headwinds. Uniform approval procedures under the Canadian Food Inspection Agency, coupled with provincial carbon pricing at CAD 65 (USD 50.7) per metric ton, encourage growers to monetize nitrogen reductions. Extensive acreage in Alberta, Saskatchewan, and Manitoba presents a sizeable canvas for biofertilizer expansion, although refrigerated storage gaps outside major corridors remain a hurdle. Continued government funding for sustainable agriculture projects promises incremental cold-chain improvements that will broaden product reach over the medium term.
Mexico is poised for acceleration as the 2025 bioinput framework takes effect, offering fiscal incentives and clearer registration pathways. Cold-chain deficiencies still confine distribution hubs to within 300 kilometers of major cities, limiting access for smallholders who dominate national agriculture. Nevertheless, specialty-crop exporters in Sinaloa and Baja California Sur already integrate biofertilizers to satisfy stringent importer residue requirements. As regional infrastructure develops and financial incentives flow, Mexico will transition from a niche buyer to a critical growth contributor in the North America biofertilizers market.
Competitive Landscape
The North America biofertilizer market remains highly fragmented. Novonesis leverages global fermentation facilities and strong distribution networks, positioning itself as a technology pace-setter. Rizobacter, drawing from South American expertise, has partnered with U.S. cooperatives to localize production and avoid cross-border cold-chain issues. MustGrow Biologics holds over 112 issued and pending patents for soil health innovations, reflecting the intellectual-property intensity of the space.
Distribution alliances are increasingly strategic. Pivot Bio’s agreements with MFA and other regional ag-retailers ensure shelf-stable lines reach growers before planting windows close. Indigo Ag embeds its Carbon by Indigo platform to provide performance data that supports emission-reduction claims, an attribute valued by retailers and grain buyers. Start-ups focusing on shelf-life extension continue to attract venture capital, with Holganix among the beneficiaries of USDA grants that fund scaling of its Bio 800+ line.
Regulatory competence is another pillar of competition. Firms capable of navigating EPA, USDA, and state rules simultaneously gain faster routes to market and stronger brand recognition. Meanwhile, product differentiation centers on multispecies consortia that offer both nutrient and biocontrol benefits, helping justify higher price points. The competitive field is anticipated to remain dynamic as new entrants exploit white-space opportunities created by low concentration and as incumbents seek bolt-on acquisitions to deepen biological portfolios.
North America Biofertilizer Industry Leaders
Novonesis
Rizobacter (Bioceres Crop Solutions Corp.)
Corteva Agriscience
Lallemand Inc
Suståne Natural Fertilizer Inc.
- *Disclaimer: Major Players sorted in no particular order


Recent Industry Developments
- June 2025: Indogulf BioAg introduced Azospirillum lipoferum, a microbial biofertilizer designed to naturally fix atmospheric nitrogen. It supports root development and nutrient absorption, providing U.S. farmers with a sustainable option to enhance crop productivity.
- March 2025: Phospholutions entered into a distribution agreement with The Andersons Inc. to introduce RhizoSorb, a phosphorus-efficient biofertilizer, to U.S. growers beginning with the 2026 crop season. This collaboration aims to promote sustainable nutrient management in North American agriculture.
- March 2024: Novonesis has partnered with FMC Canada to distribute its biosolutions for plant health throughout Canada beginning in 2025. This partnership aims to enhance access to sustainable agricultural inputs for Canadian growers.


North America Biofertilizer Market Report Scope
The North America Biofertilizer Market Report is Segmented by Form (Azospirillum, Azotobacter, Mycorrhiza, Phosphate Solubilizing Bacteria, and Rhizobium), Crop Type (Cash Crops, Horticultural Crops, and Row Crops), and Geography (Canada, Mexico, and United States). The Market Forecasts are Provided in Terms of Value (USD) and Volume (Metric Tons).
| Azospirillum |
| Azotobacter |
| Mycorrhiza |
| Phosphate Solubilizing Bacteria |
| Rhizobium |
| Other Biofertilizer |
| Cash Crops |
| Horticultural Crops |
| Row Crops |
| Canada |
| Mexico |
| United States |
| Rest of North America |
| Form | Azospirillum |
| Azotobacter | |
| Mycorrhiza | |
| Phosphate Solubilizing Bacteria | |
| Rhizobium | |
| Other Biofertilizer | |
| Crop Type | Cash Crops |
| Horticultural Crops | |
| Row Crops | |
| Country | Canada |
| Mexico | |
| United States | |
| Rest of North America |


Market Definition
- AVERAGE DOSAGE RATE - The average application rate is the average volume of biofertilizers applied per hectare of farmland in the respective region/country.
- CROP TYPE - Crop type includes Row crops (Cereals, Pulses, Oilseeds), Horticultural Crops (Fruits and vegetables) and Cash Crops (Plantation Crops, Fibre Crops and Other Industrial Crops)
- FUNCTION - The crop nutrition function of agricultural biological consists of various products that provide essential plant nutrients and enhance soil quality.
- TYPE - Biofertilizers enhance soil quality by increasing the population of beneficial microorganisms. They help crops absorb nutrients from the environment.
| Keyword | Definition |
|---|---|
| Cash Crops | Cash crops are non-consumable crops sold as a whole or part of the crop to manufacture end-products to make a profit. |
| Integrated Pest Management (IPM) | IPM is an environment-friendly and sustainable approach to control pests in various crops. It involves a combination of methods, including biological controls, cultural practices, and selective use of pesticides. |
| Bacterial biocontrol agents | Bacteria used to control pests and diseases in crops. They work by producing toxins harmful to the target pests or competing with them for nutrients and space in the growing environment. Some examples of commonly used bacterial biocontrol agents include Bacillus thuringiensis (Bt), Pseudomonas fluorescens, and Streptomyces spp. |
| Plant Protection Product (PPP) | A plant protection product is a formulation applied to crops to protect from pests, such as weeds, diseases, or insects. They contain one or more active substances with other co-formulants such as solvents, carriers, inert material, wetting agents or adjuvants formulated to give optimum product efficacy. |
| Pathogen | A pathogen is an organism causing disease to its host, with the severity of the disease symptoms. |
| Parasitoids | Parasitoids are insects that lay their eggs on or within the host insect, with their larvae feeding on the host insect. In agriculture, parasitoids can be used as a form of biological pest control, as they help to control pest damage to crops and decrease the need for chemical pesticides. |
| Entomopathogenic Nematodes (EPN) | Entomopathogenic nematodes are parasitic roundworms that infect and kill pests by releasing bacteria from their gut. Entomopathogenic nematodes are a form of biocontrol agents used in agriculture. |
| Vesicular-arbuscular mycorrhiza (VAM) | VAM fungi are mycorrhizal species of fungus. They live in the roots of different higher-order plants. They develop a symbiotic relationship with the plants in the roots of these plants. |
| Fungal biocontrol agents | Fungal biocontrol agents are the beneficial fungi that control plant pests and diseases. They are an alternative to chemical pesticides. They infect and kill the pests or compete with pathogenic fungi for nutrients and space. |
| Biofertilizers | Biofertilizers contain beneficial microorganisms that enhance soil fertility and promote plant growth. |
| Biopesticides | Biopesticides are natural/bio-based compounds used to manage agricultural pests using specific biological effects. |
| Predators | Predators in agriculture are the organisms that feed on pests and help control pest damage to the crops. Some common predator species used in agriculture include ladybugs, lacewings, and predatory mites. |
| Biocontrol agents | Biocontrol agents are living organisms used to control pests and diseases in agriculture. They are alternatives to chemical pesticides and are known for their lesser impact on the environment and human health. |
| Organic Fertilizers | Organic fertilizer is composed of animal or vegetable matter used alone or in combination with one or more non-synthetically derived elements or compounds used for soil fertility and plant growth. |
| Protein hydrolysates (PHs) | Protein hydrolysate-based biostimulants contain free amino acids, oligopeptides, and polypeptides produced by enzymatic or chemical hydrolysis of proteins, primarily from vegetal or animal sources. |
| Biostimulants/Plant Growth Regulators (PGR) | Biostimulants/Plant Growth Regulators (PGR) are substances derived from natural resources to enhance plant growth and health by stimulating plant processes (metabolism). |
| Soil Amendments | Soil Amendments are substances applied to soil that improve soil health, such as soil fertility and soil structure. |
| Seaweed Extract | Seaweed extracts are rich in micro and macronutrients, proteins, polysaccharides, polyphenols, phytohormones, and osmolytes. These substances boost seed germination and crop establishment, total plant growth and productivity. |
| Compounds related to biocontrol and/or promoting growth (CRBPG) | Compounds related to biocontrol or promoting growth (CRBPG) are the ability of a bacteria to produce compounds for phytopathogen biocontrol and plant growth promotion. |
| Symbiotic Nitrogen-Fixing Bacteria | Symbiotic nitrogen-fixing bacteria such as Rhizobium obtain food and shelter from the host, and in return, they help by providing fixed nitrogen to the plants. |
| Nitrogen Fixation | Nitrogen fixation is a chemical process in soil which converts molecular nitrogen into ammonia or related nitrogenous compounds. |
| ARS (Agricultural Research Service) | ARS is the U.S. Department of Agriculture's chief scientific in-house research agency. It aims to find solutions to agricultural problems faced by the farmers in the country. |
| Phytosanitary Regulations | Phytosanitary regulations imposed by the respective government bodies check or prohibit the importation and marketing of certain insects, plant species, or products of these plants to prevent the introduction or spread of new plant pests or pathogens. |
| Ectomycorrhizae (ECM) | Ectomycorrhiza (ECM) is a symbiotic interaction of fungi with the feeder roots of higher plants in which both the plant and the fungi benefit through the association for survival. |


Research Methodology
Mordor Intelligence follows a four-step methodology in all our reports.
- Step-1: Identify Key Variables: In order to build a robust forecasting methodology, the variables and factors identified in Step-1 are tested against available historical market numbers. Through an iterative process, the variables required for market forecast are set and the model is built on the basis of these variables.
- Step-2: Build a Market Model: Market-size estimations for the forecast years are in nominal terms. Inflation is not a part of the pricing, and the average selling price (ASP) is kept constant throughout the forecast period.
- Step-3: Validate and Finalize: In this important step, all market numbers, variables and analyst calls are validated through an extensive network of primary research experts from the market studied. The respondents are selected across levels and functions to generate a holistic picture of the market studied.
- Step-4: Research Outputs: Syndicated Reports, Custom Consulting Assignments, Databases & Subscription Platforms.


