
Music Publishing Market Size and Share
Market Overview
| Study Period | 2020 - 2031 |
|---|---|
| Market Size (2026) | USD 12.37 Billion |
| Market Size (2031) | USD 16.46 Billion |
| Growth Rate (2026 - 2031) | 5.88 % |
| Fastest Growing Market | Asia Pacific |
| Largest Market | North America |
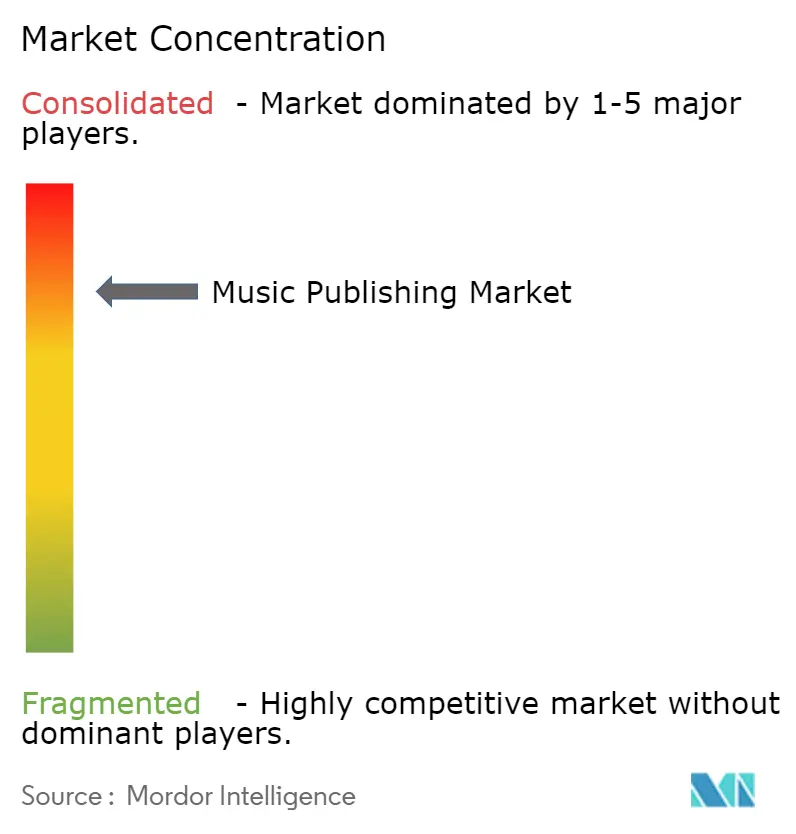
| Market Concentration | High |
Major Players *Disclaimer: Major Players sorted in no particular order Image © Mordor Intelligence. Reuse requires attribution under CC BY 4.0. | |
Music Publishing Market Analysis by Mordor Intelligence
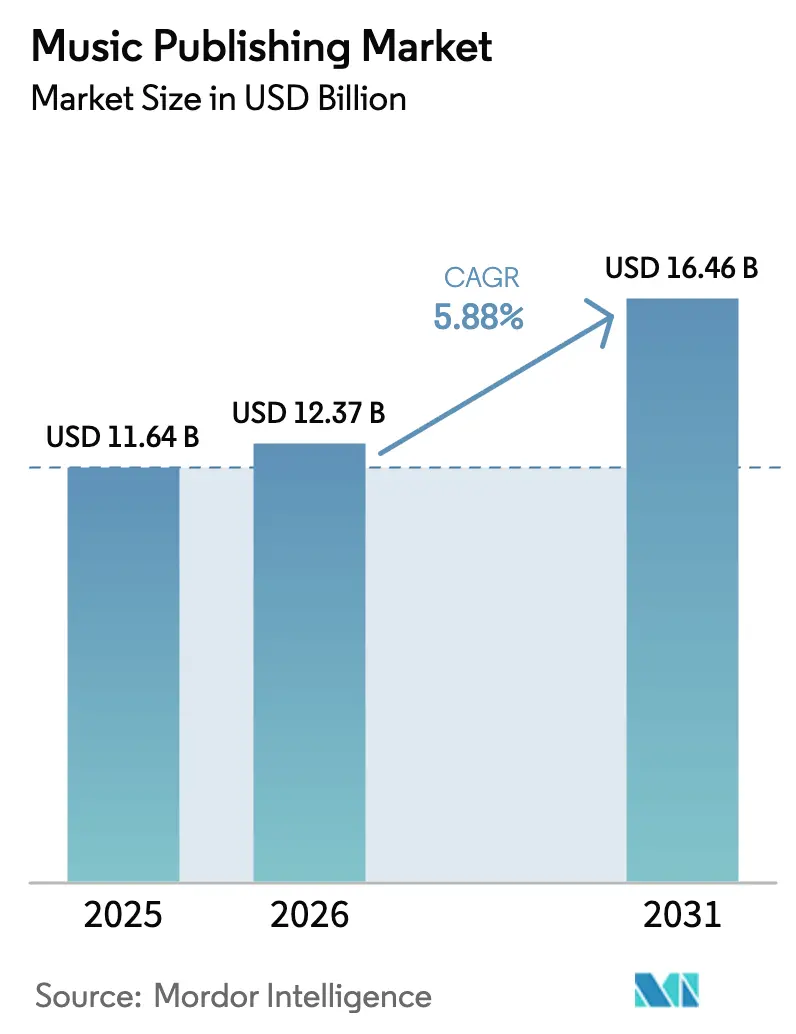
The music publishing market size is expected to increase from USD 11.64 billion in 2025 to USD 12.37 billion in 2026 and reach USD 16.46 billion by 2031, growing at a CAGR of 5.88% over 2026-2031. Demand is shifting from physical formats to digital-first licensing, where streaming audio, social media clips, and user-generated videos now drive most royalty flows. Catalogue acquisitions by pension funds and private-equity groups are injecting fresh liquidity, while smartphone adoption in emerging economies is widening the global revenue base despite low paid-subscription penetration. Performance royalties retain a commanding role because terrestrial radio remains influential in mature markets, yet digital revenue royalties are climbing as platforms monetize short-form videos through new ad-sharing tools. Competitive pressure continues to bifurcate the field into a consolidated top tier of three multinationals and a fragmented mid-tier of technology-enabled independents that clear synch rights in hours rather than weeks.
Key Report Takeaways
- By royalties, performance captured 46.71% of the music publishing market share in 2025.
- By publisher type, majors controlled 63.89% of 2025 revenue, while digital-native publishers posted the fastest 7.19% CAGR through 2031.
- By rights type, performance rights anchored 44.02% of collections in 2025, whereas neighbouring rights are projected to grow at a 6.61% CAGR to 2031.
- By usage platform, streaming audio held 58.06% share in 2025, yet social media platforms are forecast to post an 8.72% CAGR to 2031.
- By geography, North America led with 37.28% share in 2025; Asia Pacific is the fastest-growing region at a 7.43% CAGR to 2031.
Note: Market size and forecast figures in this report are generated using Mordor Intelligence’s proprietary estimation framework, updated with the latest available data and insights as of January 2026.
Market Trends and Insights
Drivers Impact Analysis of Music Publishing Market*
| Driver | (~) % Impact on CAGR Forecast | Geographic Relevance | Impact Timeline |
|---|---|---|---|
| Rising Popularity of Music Streaming Services | +1.4% | Global, peak growth in Asia Pacific and Latin America | Medium term (2-4 years) |
| Rapid Growth of Short-Form Video Platforms | +1.2% | Global, led by North America, Europe, Asia Pacific | Short term (≤ 2 years) |
| Surge in Catalogue Acquisitions by Investment Funds | +1.0% | North America and Europe, spillover to Asia Pacific | Long term (≥ 4 years) |
| Expansion of Emerging Markets’ Paid-Subscription Base | +1.1% | Asia Pacific core, Latin America, Middle East & Africa | Medium term (2-4 years) |
| Monetisation of User-Generated Content via AI Tagging | +0.8% | Global, concentrated in North America and Europe | Medium term (2-4 years) |
| Proliferation of Direct-to-Fan Platforms | +0.4% | North America and Europe, early adoption in Asia Pacific | Long term (≥ 4 years) |
| Source: Mordor Intelligence | |||
Rising Popularity of Music Streaming Services
Streaming platforms paid more than USD 10 billion to rights holders in 2024, with Spotify alone remitting USD 4.5 billion across 2023-2024, yet the global per-stream rate remained below USD 0.004. Sixty percent of total streams occur within the first 28 days of release, rewarding catalogue owners who secure prime playlist slots. Tencent Music Entertainment’s 119 million paying subscribers in China illustrate how bundling karaoke, social features, and live streams accelerates adoption in emerging markets.[1]Tencent Music Entertainment, “Q3 2024 Results,” tencentmusic.com Brazil’s 26.7 million Spotify subscribers show strong volume, although average revenue per user is 40% lower than North America because of currency depreciation and family-plan discounts. Ad-supported tiers, which served 55% of Spotify’s monthly users in 2024, generate royalties at one-tenth of premium rates, forcing publishers to balance reach with revenue quality.
Surge in Catalogue Acquisitions by Investment Funds
Institutional investors deployed more than USD 5 billion on song catalogues between 2022 and 2024, highlighted by Blackstone’s USD 1.6 billion purchase of Hipgnosis Songs Fund.[2]Blackstone, “Acquisition of Hipgnosis Songs Fund,” blackstone.com Sony Music Publishing’s USD 1.27 billion deal for Queen’s catalogue set a record for single-artist transactions. BMG Rights Management generated USD 1 billion revenue in 2024 and spent USD 263 million on mid-tier assets that return capital faster than premium catalogues. Reservoir Media’s USD 115 million of acquisitions lifted quarterly revenue 12%, yet its share price fell 18% as investors weighed rising interest rates on future multiples. Concentration among the top five buyers is creating a seller’s market where multiples of 12-18 times net publisher’s share are common, squeezing smaller bidders.
Rapid Growth of Short-Form Video Platforms
TikTok formalized royalty structures through 2024 agreements with Universal, Warner, and BMG, but per-use payouts trail streaming audio by a wide margin. YouTube’s Content ID paid more than USD 9 billion in 2024, achieving 99.5% match accuracy across 800 million videos.[3]YouTube, “How Content ID Works,” youtube.com Meta’s Music Revenue Sharing on Instagram Reels and Facebook limits eligibility to creators with sizable followings, excluding 85% of users and capping the immediate royalty pool. Instagram Reels hit 200 billion daily plays in 2024, yet opaque rate disclosures prompted collecting societies in France and Germany to initiate royalty audits. Fragmentation across TikTok, Instagram, YouTube Shorts, and Snapchat increases administrative costs and delays distributions by up to 12 months.
Expansion of Emerging Markets’ Paid-Subscription Base
India added 6 million paid Spotify subscribers by mid-2024, yet that equates to less than 1% of the nation’s 750 million smartphone users. Spotify’s licensing agreements with Warner Chappell India and Saregama broadened Bollywood and regional catalogs in 2024, reducing leakage to free platforms. Brazil’s 35% streaming penetration is offset by a 22% drop in dollar-denominated royalties due to currency depreciation. Indonesia’s high smartphone usage and ARPU below USD 2 illustrate how low pricing and piracy constrain revenue. Mexico’s 18% growth in 2024 stems from telco bundles that bypass credit-card barriers.
Restraints Impact Analysis of Music Publishing Market*
| Restraint | (~) % Impact on CAGR Forecast | Geographic Relevance | Impact Timeline |
|---|---|---|---|
| Complex Global Royalty Collection Frameworks | -0.6% | Global, acute where multiple CMOs overlap | Long term (≥ 4 years) |
| Rising Incidence of Copyright Infringement in Web3 | -0.4% | Global, concentrated in North America and Europe | Medium term (2-4 years) |
| High Valuations Limiting M&A ROI | -0.3% | North America and Europe | Medium term (2-4 years) |
| Currency Volatility Affecting Cross-Border Payments | -0.3% | Latin America, Asia Pacific, Africa | Short term (≤ 2 years) |
| Source: Mordor Intelligence | |||
Complex Global Royalty Collection Frameworks
The Mechanical Licensing Collective disbursed USD 1.8 billion in 2024, yet USD 424 million remained unmatched because of metadata gaps and split disputes. Europe’s 39 collection societies require separate registrations, delaying payouts up to 24 months and absorbing 15-25% in administrative fees.[4]ISAC, “Global Collections Report 2024,” cisac.org Cross-border streams trigger multiple rights in different jurisdictions, complicating attribution. Although the EU mandated multi-territorial licensing in 2024, only 12 member states had fully implemented the rule by year-end. Blockchain pilots promise real-time attribution, but lack of adoption by major labels limits interoperability.
Rising Incidence of Copyright Infringement in Web3
Decentralized platforms such as Audius and Royal grew to 10 million users in 2024, yet 15-20% of tracks violated existing rights. NFT marketplaces processed USD 500 million in music-related sales without consistent licensing frameworks, prompting 12 takedown notices from Warner Music Group in 2024. Pseudonymous wallets slow enforcement because identifying infringers requires subpoenas. Smart contracts that automate splits cannot accommodate typical publishing agreements, forcing renegotiations or exclusion from Web3. AI-generated derivatives trained on unlicensed catalogues have sparked lobbying for stricter platform liability.
*Our forecasts treat driver/restraint impacts as directional, not additive. The impact forecasts reflect baseline growth, mix effects, and variable interactions.
Music Publishing Market Segment Analysis
By Royalties:
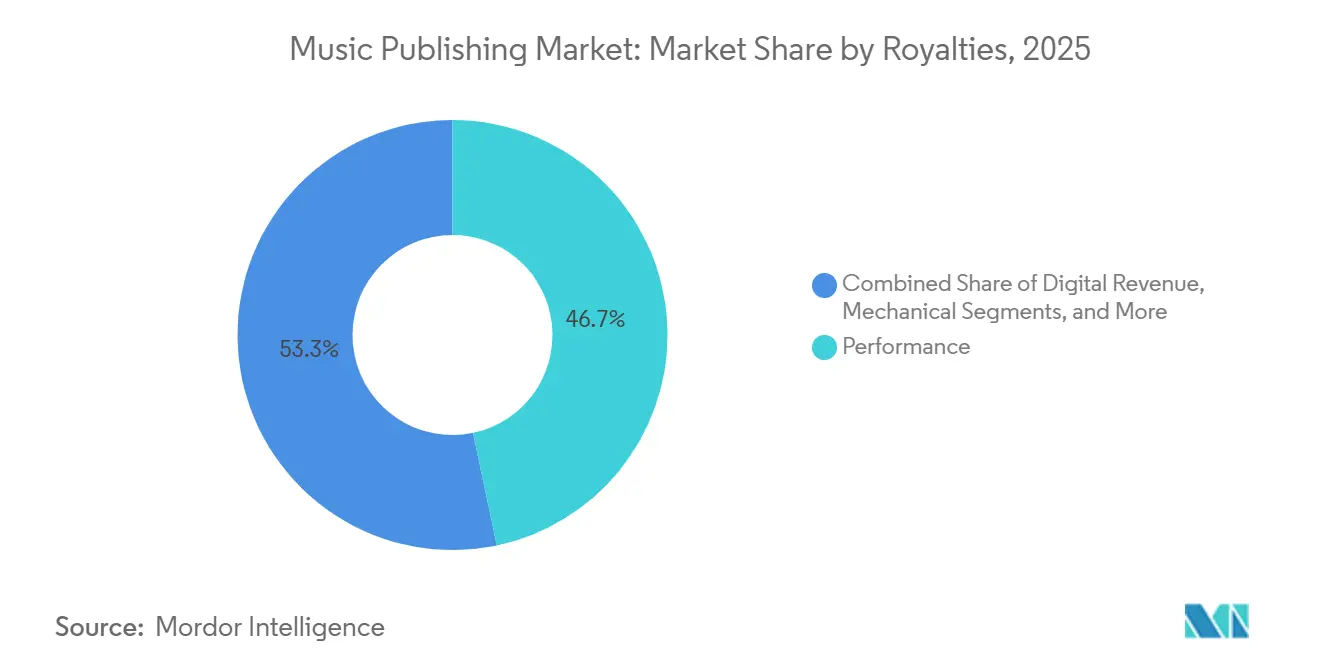
Performance Strength Maintains LeadPerformance royalties accounted for 46.71% of the music publishing market in 2025, underpinned by terrestrial radio and the classification of on-demand streams as public performances. Digital revenue royalties are projected to climb at a 6.24% CAGR through 2031 thanks to new monetization options on TikTok, YouTube Shorts, and Instagram Reels. Synchronization royalties captured 12% of the music publishing market size in 2025 as streaming-video services commissioned original soundtracks that demand bespoke licensing. Mechanical royalties slipped to 8% as the per-unit model faded, yet the U.S. rate hike to 15.1% of revenue offers partial relief.
Streaming-era dynamics favor catalogues that achieve fast front-loaded consumption, prompting publishers to optimize playlist placement. High-budget video-game and podcast projects continue to expand sync budgets, adding diversity to income streams. Mechanical royalty decline remains structural because bundled licenses cap platform liability. Print royalties, though small, maintain pricing power in niche educational segments. Neighbouring-rights legislation in Brazil, India, and South Africa is widening the royalty net for performers previously left outside core frameworks.



By Publisher Type:
Majors Dominate While Tech-Enabled Indies ScaleMajor companies, Sony, Universal, and Warner, held 63.89% of revenue in 2025 through exclusive songwriter deals and multi-territory infrastructure. Digital-native firms are expanding at a 7.19% CAGR by automating rights clearance with platforms like AMRA and Songtrust. Independents control 22%, thriving in regional genres that lack scale for the majors. Production libraries deliver 6% by offering pre-cleared tracks to advertisers and podcasters.
The music publishing market size for digital-native publishers is projected to increase as transparency dashboards attract creators seeking granular earnings data. BMG’s hybrid model illustrates how mid-tier players compete by charging lower commissions and providing open reporting. Production libraries commoditize background music yet shorten time-to-market for campaigns, aligning with the fast-turn content cycle. Technology investment will likely deepen the advantage of publishers that can pair machine learning with global collection networks.
By Rights Type:
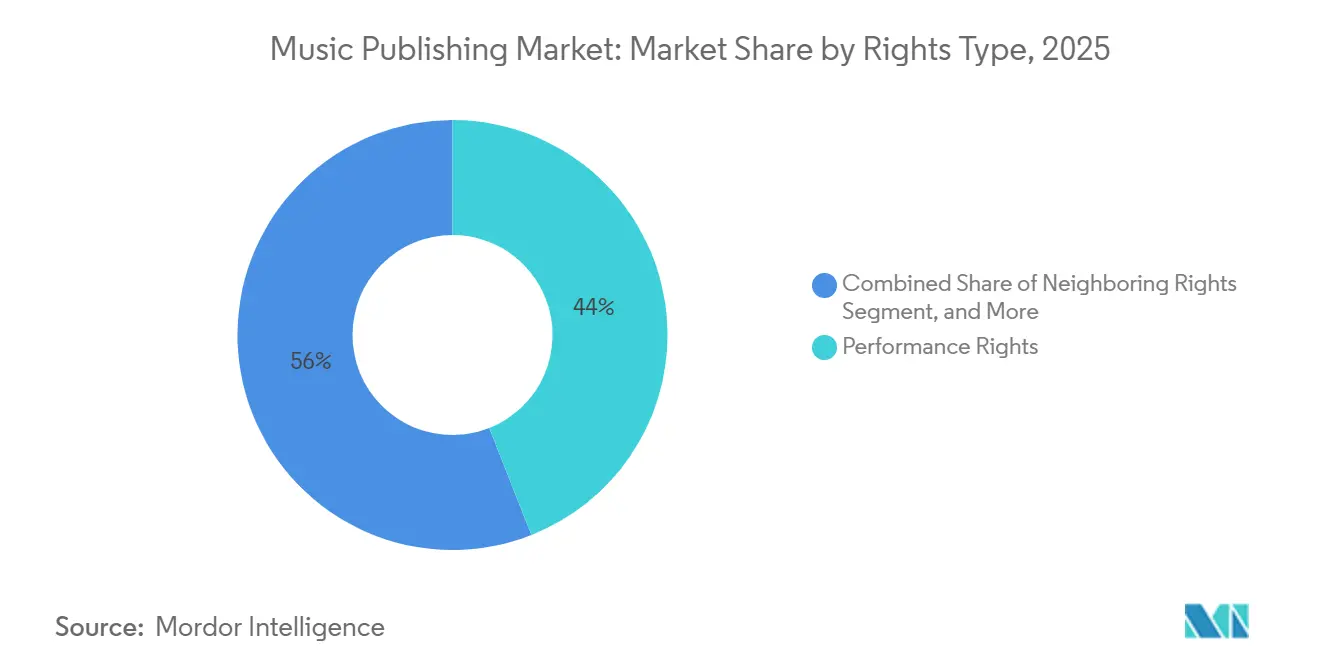
Performance Anchors, Neighbouring Rights AcceleratePerformance rights delivered 44.02% of 2025 revenue, collected by organizations such as PRS and GEMA. Neighbouring rights are poised for a 6.61% CAGR as legislative updates extend protections to session musicians, especially in Latin America and Asia Pacific. Mechanical rights accounted for 18% of revenue, shifting from per-unit to percentage-of-revenue models under blanket deals. Synchronization rights generated 14%, lifted by booming demand from streaming series, video games, and podcasts. Print rights remained at 3% but retained relevance in classical and jazz where sheet music is indispensable.
The music publishing market share of neighbouring rights will rise as more territories adopt performer protections. Synchronization income splits into premium blockbuster placements and micro-licensing for social clips, diversifying risk. Mechanical collections will be sensitive to appeals against the recent U.S. rate hike. Print rights face secular decline but hold niche pricing power due to professional engraving standards in orchestral works.
By Usage Platform:
Streaming Audio Still Rules, Social Media Ramps UpStreaming audio platforms provided 58.06% of 2025 revenue, led by Spotify’s 602 million monthly users and Apple Music’s 100 million subscribers. Social media video is projected to post an 8.72% CAGR, converting billions of reels and shorts into licensable uses. Video streaming services delivered 10%, fueled by record synchronization advances for originals. Traditional broadcast held 12% thanks to commuter radio and televised live events. Live venues rebounded to 6% as tours resumed, while video games represented 4%, set to triple by 2030 as metaverse concerts proliferate.
Content ID algorithms underpin the music publishing market’s ability to monetize user-generated postings, pushing platforms toward higher transparency. TikTok’s opaque rates remain a flashpoint, with collecting societies demanding audits. Netflix’s tendency to secure work-for-hire deals limits secondary licensing, disadvantaging publishers seeking reuse fees. Terrestrial radio remains a vital, though aging, revenue pillar in the United States.
Geography Analysis
North America Music Publishing Market
North America generated 37.28% of 2025 revenue, buoyed by USD 1.8 billion in MLC distributions and higher streaming-mechanical rates. United States saturation constrains growth to mid-single digits, yet synchronization demand from streaming-video services sustains advances. Canada’s bilingual market and Mexico’s telco-bundled subscriptions diversify income streams within the region.
APAC Music Publishing Market
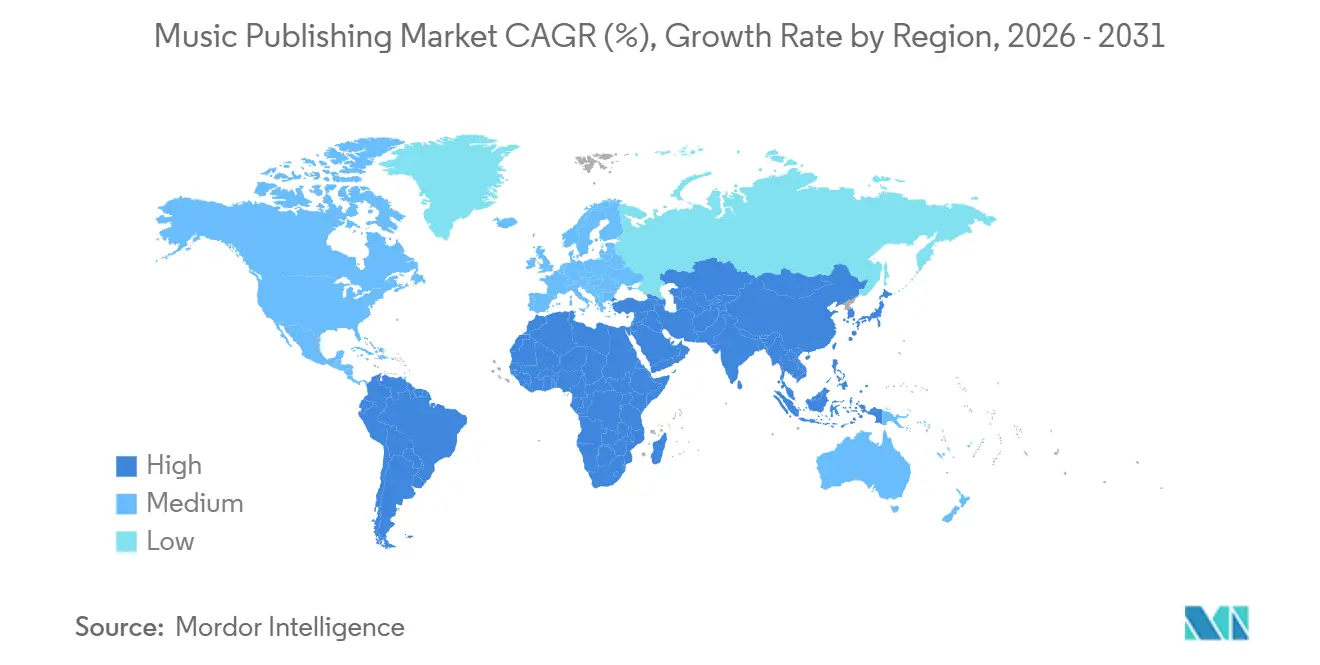
Asia Pacific is the fastest-growing territory with a 7.43% CAGR through 2031, paced by Tencent Music Entertainment’s 119 million paying subscribers and Spotify’s early-stage penetration in India. Japan’s USD 2.8 billion publishing sector still leans on physical sales and karaoke, while South Korea monetizes global K-pop placements. Indonesia’s large population and low ARPU highlight latent upside once piracy and pricing barriers ease.
Europe Music Publishing Market
Europe contributed 28% of global revenue in 2025, accelerated by the Digital Single Market Directive that moved liability to platforms and spurred YouTube to ink new licensing pacts with GEMA and PRS. Germany, the United Kingdom, and France form the core, supported by resilient radio and premium advertising synchs. Russia’s revenue fell 15% after platform exits tied to sanctions, while the Netherlands leveraged festival culture for high-margin sync fees.

Regulatory Landscape
Music publishing regulation continues to be anchored in copyright statutes, statutory licensing, and the governance of collective management organizations (CMOs) that administer performance, mechanical, and related rights across territories. In the United States, the Music Modernization Act framework remains central to mechanical licensing administration, and in March 2026 the Copyright Royalty Judges published a final rule setting certain digital performance royalty rates for the 2026-2030 license period, reinforcing the importance of rate-setting processes for digital uses alongside traditional broadcast collections.
Across Asia and Europe, governments and supranational bodies are tightening the operational expectations placed on CMOs and platform ecosystems, with a visible emphasis on transparency and data governance. Thailand opened a second public consultation in April 2026 on its Draft Act to regulate collective rights management organizations, while EU-level debates around streaming-market transparency and algorithmic accountability have kept distribution methodologies and cross-border royalty impacts in focus for rights holders and collecting societies.
Value Chain Analysis
The value chain begins with songwriters and composers creating works that are contracted to publishers via administration, co-publishing, or full publishing deals. Publishers then register works, splits, and identifiers, route rights through domestic and international CMO networks (for performance and mechanical where applicable), and increasingly negotiate direct licenses with digital service providers (DSPs) and short-form video platforms for high-volume digital uses. Royalty reporting, matching, and distribution sit at the center of the chain, where metadata completeness and dispute resolution (splits, ownership conflicts, and duplicate claims) directly influence the speed and accuracy of payouts.
Downstream, DSPs, social platforms, broadcasters, and sync buyers (film/TV, advertising, games, podcasts) trigger usage reports that flow back into publisher and CMO systems for calculation and settlement. 2026 consolidation and partnership activity highlights how scale and data infrastructure are being used to reduce friction: BMG and Concord announced a definitive merger agreement (April 2026), Reservoir Media launched a joint venture with TU Publishing (June 2026), and Primary Wave finalized its acquisition of Kobalt Music Group (July 2026), bringing Kobalt-aligned administration and digital collections capabilities under a larger rights-owning platform.
Competitive Landscape
Three multinationals, Sony Music Publishing, Universal Music Publishing Group, and Warner Chappell Music, control roughly 60% of global performance royalties through exclusive rosters and unmatched administrative reach. Their scale secures favorable per-stream rates and minimum guarantees, though EU regulators are assessing whether bundled deals curb competition. Digital-native challengers like Kobalt and Downtown capture independents by offering real-time dashboards and commissions under 15%.
Growth strategies center on catalogue purchases; Blackstone’s USD 1.6 billion acquisition of Hipgnosis Songs Fund and Sony’s USD 1.27 billion Queen deal illustrate institutional appetite for evergreen assets. Technology is an emerging wedge: majors deploy machine learning to forecast sync demand, while smaller publishers test blockchain registries that automate splits. Direct-to-fan platforms give songwriters alternate income paths yet still rely on publishers for global collection. Rising AI-generated music content has united rights holders in lobbying for tighter platform accountability.
Music Publishing Industry Leaders
Sony Music Publishing LLC
Universal Music Publishing Group Inc.
Warner Chappell Music Inc.
Kobalt Music Group Ltd.
BMG Rights Management GmbH
- *Disclaimer: Major Players sorted in no particular order
Music Publishing Market Companies Covered in this Report
- Sony Music Publishing LLC
- Universal Music Publishing Group Inc.
- Warner Chappell Music Inc.
- Kobalt Music Group Ltd.
- BMG Rights Management GmbH
- Round Hill Music LP
- Pulse Recordings LLC
- Big Yellow Dog Music LLC
- Black River Entertainment LLC
- Reach Music Publishing Inc.
- Disney Music Group LLC
- Big Deal Music LLC
- Concord Music Publishing LLC
- Downtown Music Holdings Inc.
- Hipgnosis Songs Fund Ltd.
- Spirit Music Group Inc.
- Reservoir Media Inc.
- Peermusic III Ltd.
- Primary Wave Music IP Fund 3 LP
- Anthem Entertainment Group Inc.

Market Opportunities and Future Outlook
Opportunities are concentrating around rights administration modernization and new licensing surfaces where volume is high but monetization and matching remain imperfect. In the United States, the Mechanical Licensing Collective disbursed USD 1.8 billion in 2024 while still carrying USD 424 million unmatched, keeping demand active for metadata improvement, faster dispute resolution, and tools that reduce uncollected royalties. In parallel, short-form video monetization keeps expanding the number of licensable uses, and platforms such as YouTube continue to demonstrate the scale of automated identification, with Content ID paying more than USD 9 billion in 2024.
Another opportunity area is rights-holder alignment with AI-music ecosystems and clearer licensing pathways for training and generation use cases. In June 2026, the National Music Publishers Association announced industry-wide licensing agreements with AI music companies Udio and KLAY, signaling a shift toward standardized frameworks that publishers can use to protect catalogs while capturing new revenue lines. Catalogue and administration expansion also remains a primary lever for major and independent publishers, supported by large, named transactions and mandates such as Sony Music Publishings May 2026 agreement to acquire Recognition Music Group (45,000 songs) and the continued build-out of global administration networks through joint ventures and cross-border partnerships.
Recent Industry Developments in Music Publishing Market
- July 2026: Universal Music Publishing Group and ONE4 Records formed a joint publishing venture. The partnership expands UMPGs access to pipeline development around emerging and regional repertoire while offering ONE4 a scaled global administration and licensing route. The move also reflects how JVs are being used to accelerate signing velocity and downstream monetization across DSPs and social platforms.
- May 2026: Sony Music Publishing announced an agreement to acquire the Recognition Music Group catalog, broadening cross-territory licensing and catalog ownership.
- April 2026: Warner Chappell Music renewed its global publishing partnership with Quevedo. Renewals with high-streaming artists support continuity of rights administration and help publishers defend share in performance and digital royalty flows where front-loaded consumption is common. The agreement also reinforces Warner Chappells ability to compete for global repertoire as majors and tech-enabled independents tighten creator services and reporting.


Music Publishing Market Report Scope and Research Methodology
Market Definition and Coverage
For this study, the music publishing market is defined as revenue earned from owning and administering musical composition rights, and then monetizing them through licensing, collections, and related publisher services across major usage platforms.
Scope exclusions: It does not count recorded music master revenues, live event ticketing, or artist merchandising as standalone markets.
Segments Covered in This Report
- By Royalties
- Performance
- Synchronisation
- Digital Revenue
- Mechanical
- Other Royalties
- By Publisher Type
- Major Publishers
- Independent Publishers
- Digital-Native Publishers
- Production Music Libraries
- By Rights Type
- Mechanical Rights
- Performance Rights
- Synchronisation Rights
- Print Music Rights
- Neighbouring Rights
- By Usage Platform
- Streaming - Audio
- Video Streaming Platforms
- Social Media Platforms
- Traditional Broadcast (Radio and TV)
- Live Events and Venues
- Video Games and Interactive Media
- By Geography
- North America
- United States
- Canada
- Mexico
- South America
- Brazil
- Argentina
- Colombia
- Rest of South America
- Europe
- Germany
- United Kingdom
- France
- Italy
- Spain
- Russia
- Netherlands
- Rest of Europe
- Asia-Pacific
- China
- Japan
- India
- South Korea
- Australia
- Indonesia
- Rest of Asia-Pacific
- Middle East
- Saudi Arabia
- United Arab Emirates
- Turkey
- Rest of Middle East
- Africa
- South Africa
- Nigeria
- Egypt
- Kenya
- Rest of Africa
- North America
Data Sources, Market Sizing, and Validation
Desk Research
Desk research was used to set the starting structure of the market and to pin down demand signals that can be verified in public sources. We reviewed public filings and investor presentations to understand how publishing income is reported, and then checked those patterns against what rights bodies publish on collections and usage.
For the fact base, we relied on reputable public or official sources such as US Copyright Office references, WIPO copyright and treaty material, US Bureau of Economic Analysis data series used for royalties and intellectual property context, Eurostat cultural and services indicators where relevant for regional sanity checks, and international trade statistics such as UN Comtrade for print music related trade signals. We also used press releases and statistical summaries from publisher and songwriter associations, along with reputable music industry press for major regulatory and licensing updates. A paid subscription for company financials and intelligence was used to normalize revenue disclosures across currencies and fiscal years, and a patent database was used to track technology changes that affect licensing workflows. These examples are not exhaustive, and many other sources were also used for data collection, validation, and clarifying open questions.
Primary Interviews and Surveys
Primary work focused on both seller and buyer side checks so assumptions could be corrected before finalizing the model. We spoke with composition rights holders, publishing administrators, licensing teams, digital platform specialists, and experts familiar with performance and mechanical collections across major regions to test pricing logic, usage splits, and collection timing.
Coverage was balanced across APAC, EMEA, and the Americas so differences in regulation, collection systems, and platform mix could be reflected in the final sizing and forecast.
Distribution of primary research fieldwork respondents
| Company type | Respondent position | Region |
|---|---|---|
| Top tier: 37% | CXOs: 13% | APAC: 46% |
| Mid tier: 43% | Functional/Unit leaders: 41% | EMEA: 33% |
| Smaller Players: 20% | Managers: 46% | Americas: 21% |
Market-Sizing & Forecasting
Market sizing was built using a top-down and bottom-up approach, with the top-down side anchored on royalty pool build-ups by usage platform and rights type, and then translated into publisher revenue capture using observed collection and administration patterns. To keep the totals realistic, the output was then checked with selective bottom-up approximations such as sampled publisher revenue disclosures, channel checks on sync licensing activity, and simple ASP times volume logic for repeatable licensing categories.
Key inputs used in the model included the split of publishing income across performance, mechanical, synchronization, print, and digital revenue, shifts in platform mix (streaming audio, video streaming, social media, games, and broadcast), collection lag assumptions between usage and payout, cross-border royalty flow intensity, and administration fee ranges observed in practice. When bottom-up data was missing for smaller and private participants, gaps were handled through peer group ratios and regional scaling factors that were re-tested during interviews.
For forecasting, we used scenario analysis supported by a light multivariate regression layer, where growth is linked to platform usage trends and expected royalty yield progression by region. Assumptions were kept simple enough to be rechecked each refresh cycle, and they were adjusted only after expert feedback confirmed the direction and practical magnitude.
Data Validation & Update Cycle
Validation was done in several steps so unusual outputs could be caught early. We compared the modeled totals against independent signals like the direction of collection trends, disclosed publishing revenue growth in public filings, and the expected share of publishing within broader music monetization, and then variances were reviewed by a second analyst before sign-off.
If a key assumption moved sharply, such as a meaningful shift in platform mix or a change in collection practices, experts were re-contacted to retest the driver and tighten the input range. Reports are refreshed annually, with interim updates for material events, and a final pre-delivery review is completed so clients receive the most current view available.
Mordor Intelligence's Music Publishing Market Sizing Compared With Other Published Estimates
Published market sizes for music publishing often do not match because each source defines the revenue pool differently, and it may also use different timing for currency conversion and the recognition of royalty collections. Differences also show up when one estimate leans more on reported company revenue, and another leans more on aggregated royalty pools, which can move the total even if the growth story sounds similar.
Some external figures broaden the definition into wider music royalty income or neighboring rights, and some narrow it to a subset of publisher company revenues that are easier to track. For Mordor Intelligence, the total includes composition-related publishing revenues across performance, mechanical, synchronization, print, and other publishing royalties, and recorded-music master revenues are kept outside the market size so the number stays tied to the publishing demand pool.
Benchmark comparison
| Source | Market Size | Gaps in Research Methodology |
|---|---|---|
| Mordor Intelligence | USD 11.64 B (2025) | |
| Global Consultancy A | USD 7.93 B (2025) | Often reflects a narrower revenue capture that relies more heavily on reported publisher revenue categories and does not always scale for administration-only and platform-specific monetization consistently across regions. |
| Industry Journal B | USD 11.10 B (2025) | Typically represents an aggregated total for a limited set of major markets rather than a full global roll-up, which can compress the headline value depending on which countries are included. |
The gap across sources is mostly explained by how much is counted beyond core composition publishing, and whether the estimate is global or limited to a defined country set. By tying the model to repeatable variables like royalty type mix, platform usage, and collection timing checks, the final number can be traced back to clear inputs and revalidated on each refresh.


Key Questions Answered in the Report
What is the current value of the music publishing market?
The music publishing market size reached USD 12.37 billion in 2026 and is projected to climb to USD 16.46 billion by 2031.
Which royalty stream is largest in music publishing?
Performance royalties lead with 46.71% of 2025 revenue thanks to radio airplay and classification of streams as public performances.
Which region is growing fastest for publishing revenues?
Asia Pacific posts the fastest trajectory with a 7.43% CAGR through 2031, led by China, India, and South Korea.
How concentrated is the competitive landscape?
Three majors control about 60% of performance-royalty collections, resulting in a market concentration score of 7.
What drives future growth in the sector?
Rising streaming penetration, short-form video monetization, and catalogue acquisitions by institutional investors underpin the 5.88% forecast CAGR.
Page last updated on:


 Your data is secure and never sold or shared.


