Market Overview
| Study Period | 2020 - 2031 |
|---|---|
| Forecast Data Period | 2026 - 2031 |
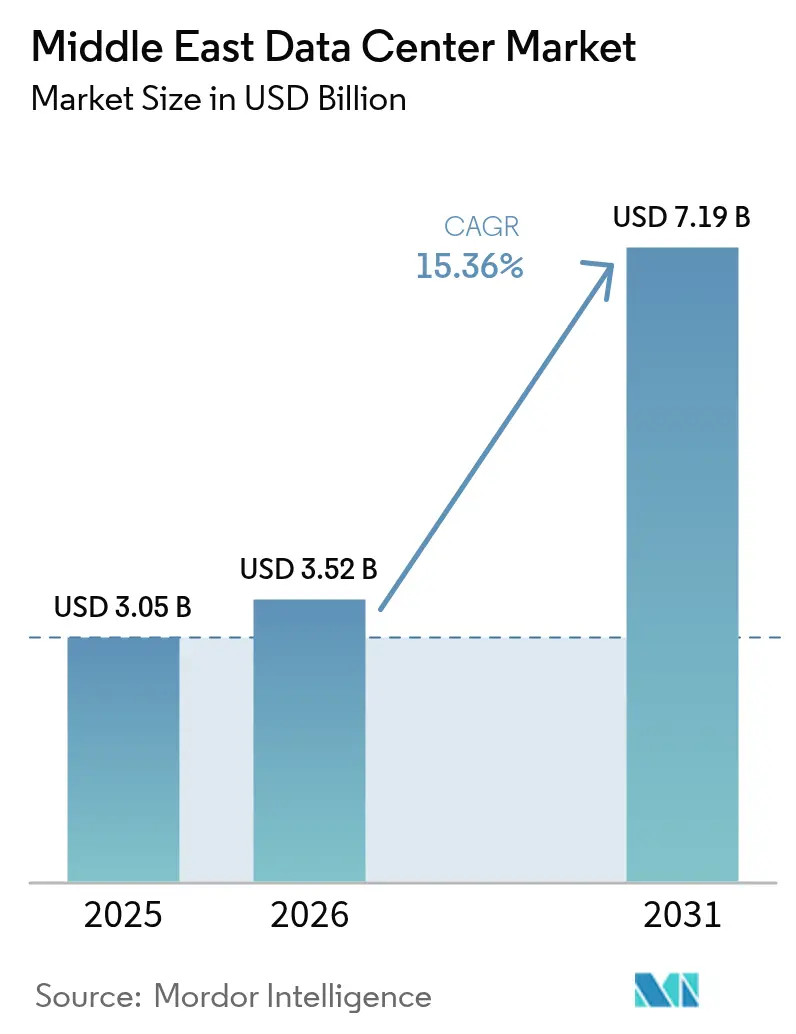
| Base Year Market Size (2025) | USD 3.05 Billion |
| Market Size (2026) | USD 3.52 Billion |
| Market Size (2031) | USD 7.19 Billion |
| Growth Rate (2026 - 2031) | 15.36% CAGR |
| Market Concentration | Medium |
Major Players *Disclaimer: Major Players sorted in no particular order Image © Mordor Intelligence. Reuse requires attribution under CC BY 4.0. | |
Middle East Data Center Market Analysis by Mordor Intelligence
The Middle East Data Center Market size is expected to grow from USD 3.05 billion in 2025 to USD 3.52 billion in 2026 and is forecast to reach USD 7.19 billion by 2031 at 15.36% CAGR over 2026-2031. In terms of the installed base, the market is expected to grow from 1.82 thousand megawatts in 2025 to 2.84 thousand megawatts by 2030, at a CAGR of 9.23% during the forecast period from 2025 to 2030. The market segment shares and estimates are calculated and reported in terms of MW. Solid sovereign funding, hyperscale capacity mandates, dense subsea cable landings, and supportive cloud-first regulations combine to attract capital and talent to the region at a pace that shortens traditional build cycles and boosts utilization rates. Sovereign programs such as Saudi Arabia’s HUMAIN and the UAE-France AI pact create guaranteed anchor demand for GPU-dense halls, while oil-field waste-gas-to-power pilots hint at structurally lower energy costs that could widen regional cost advantages over Europe and parts of Asia. Operators that pair land and power control with liquid-cooling know-how are securing long-term commitments from hyperscalers eager to hedge against capacity shortages elsewhere. Competitive pressure is mounting as domestic champions, global colocation brands, and energy majors jostle for sites in Riyadh, Abu Dhabi, and Tel Aviv, driving up land prices but also accelerating inter-campus fiber builds that improve cross-border workload mobility.
Key Report Takeaways
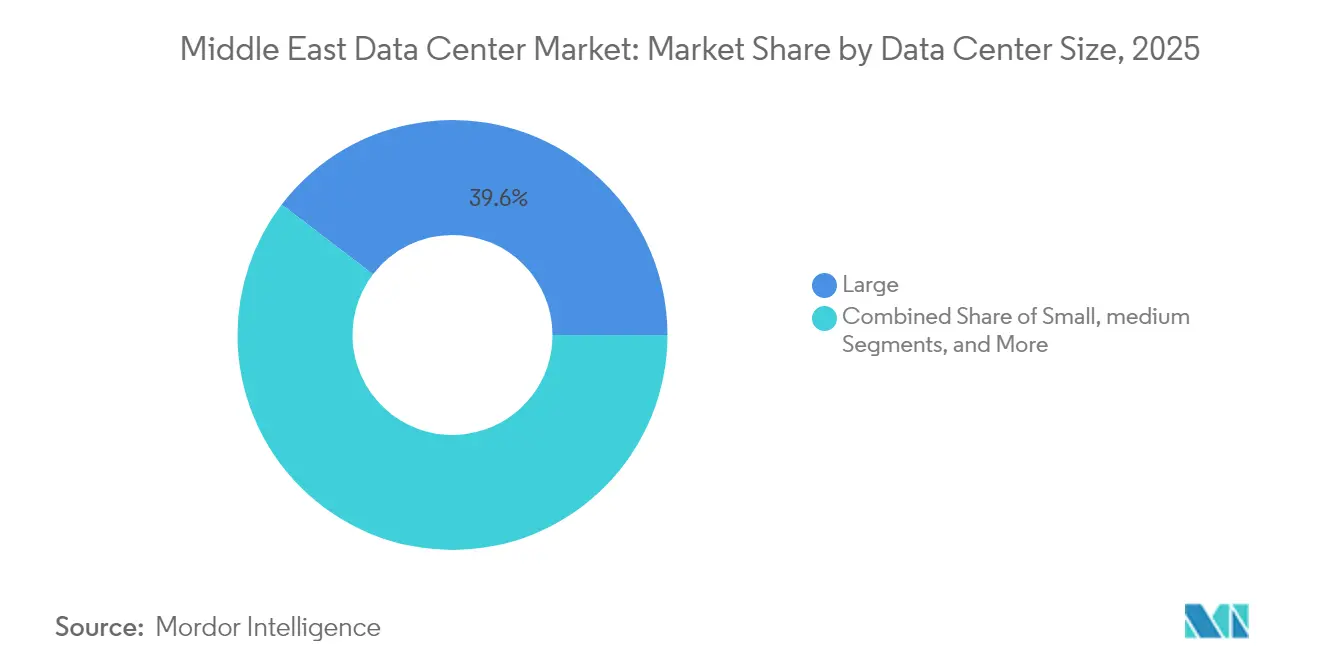
- By data center size, large facilities held a 39.62% share of the Middle East data center market in 2025, whereas massive campuses are expected to advance at a 16.69% CAGR through 2031.
- By tier standard, Tier 3 infrastructure accounted for 67.05% of the Middle East data center market share in 2025, while Tier 4 is projected to grow at 16.55% CAGR.
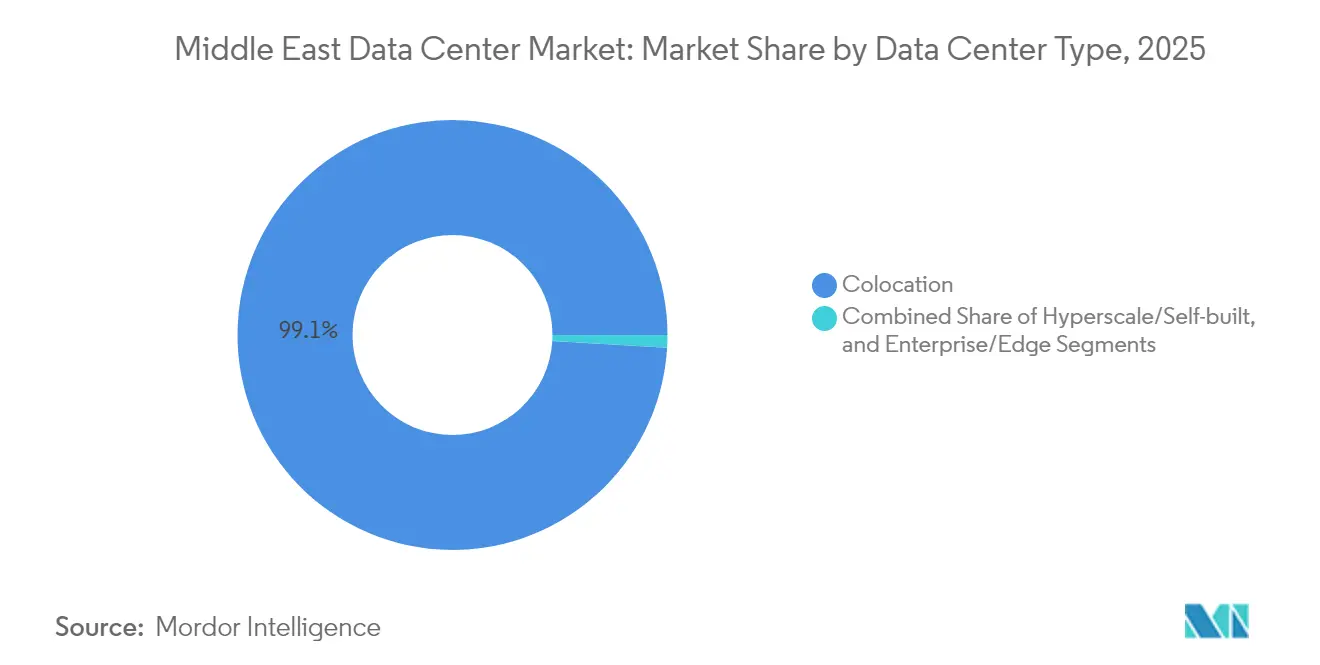
- By data center type, the colocation model captured 99.05% of deployed capacity in 2025; edge deployments are expanding at 16.41% CAGR.
- By end-user industry, IT and telecom contributed 55.10% of demand in 2025, whereas BFSI workloads are growing the fastest at 17.29% CAGR.
- By country, Israel led with a 46.52% share in 2025, while the United Arab Emirates is projected to post the highest growth, at 16.77% CAGR, through 2031.
Note: Market size and forecast figures in this report are generated using Mordor Intelligence’s proprietary estimation framework, updated with the latest available data and insights as of 2026.
Middle East Data Center Market Trends and Insights
Drivers Impact Analysis*
| Driver | (~) % Impact on CAGR Forecast | Geographic Relevance | Impact Timeline |
|---|---|---|---|
| Rapid adoption of national cloud-first policies | +3.2% | Saudi Arabia, UAE, spillover to Qatar and Bahrain | Medium term (2–4 years) |
| Government-backed hyperscale capacity targets | +2.8% | Saudi Arabia and UAE cores, regional benefit | Long term (≥ 4 years) |
| Surge in sovereign AI funding | +2.1% | Saudi Arabia primary, UAE secondary | Medium term (2–4 years) |
| Sub-sea cable densification | +1.9% | Dubai, Riyadh, Tel Aviv | Long term (≥ 4 years) |
| Under-utilized oil-field waste-gas power | +1.4% | Kuwait, Saudi Arabia, UAE | Long term (≥ 4 years) |
| AI-optimized liquid-cooling exports from Israel | +1.0% | Israel to GCC markets | Short term (≤ 2 years) |
| Source: Mordor Intelligence | |||


Rapid Adoption of National Cloud-First Policies in Saudi Arabia and the UAE
Binding cloud-first mandates oblige ministries and state-owned firms to migrate workloads on timelines that ignore typical cost optimization,[1]Michael Chrysostomou, Nicholas Christofides, and Stelios Ioannou, “Turning Weakness into Strength - A Feasibility Analysis and Comparison of Data-Center Deployment in Hot and Cold Climates,” Solar Energy Advances, sciencedirect.com effectively creating a demand floor that cushions developers against cyclical slowdowns. These directives also embed strict data-sovereignty clauses, encouraging sovereign-cloud zones that fetch premium pricing. Because compliance is required to win public-sector contracts, foreign cloud providers must partner with licensed local operators, reinforcing domestic value capture and accelerating skill transfer to the local workforce.
Government-Backed Hyperscale Capacity Targets Exceeding 1.3 GW by 2030
Flagship programs such as Saudi Telecom Company’s center3 target a 1 GW roadmap, guarantee anchor tenancy, and often bundle power-purchase concessions,[2]Saudi Telecom Company, “Annual Report 2024,” stc.com dropping risk premiums and compressing development timelines to 18-24 months. Sovereign financing removes the typical scramble for off-take agreements, enabling simultaneous multi-campus launches that would be hard to fund in purely commercial markets. The oversupply that results in early years further reduces entry barriers for international hyperscalers seeking low-latency redundancy between Europe and Asia.
Surge in Sovereign AI Funding
Saudi Arabia’s USD 100 billion HUMAIN program and the UAE-France AI corridor create instant demand for racks rated above 100 kW, pushing operators toward immersion and two-phase liquid-cooling topologies that lift rack economics by up to 30%. Because these programs carry sovereign guarantees, facility owners can justify higher capital intensity per MW, confident that GPU cluster demand will materialize.
Sub-Sea Cable Densification Boosting Regional Inter-Connectivit
Cable systems such as 2Africa and the Saudi Vision Cable increase landing points across Jeddah, Dubai and Tel Aviv, cutting round-trip latency to Europe to sub-80 ms and enabling Middle Eastern sites to serve as alternate nodes for congested Mediterranean paths. The wider mesh raises the marginal value of every additional data center hall connected to it, creating a virtuous cycle of capacity buildouts and connectivity upgrades.
Restraints Impact Analysis*
| Restraint | (~) % Impact on CAGR Forecast | Geographic Relevance | Impact Timeline |
|---|---|---|---|
| Climate-driven cooling OPEX escalation | -1.8% | UAE, Saudi Arabia, Qatar | Short term (≤ 2 years) |
| Scarcity of certified data-center engineers | -1.2% | GCC and Israel, acute in UAE and Saudi Arabia | Medium term (2-4 years) |
| LNG-indexed electricity tariff volatility | -0.9% | UAE and Qatar | Short term (≤ 2 years) |
| Geopolitical cyber-risk premium on insurance | -0.7% | Israel, UAE, Saudi Arabia | Medium term (2-4 years) |
| Source: Mordor Intelligence | |||
Climate-Driven Cooling OPEX Escalation
Desert ambient temperatures push annual PUE up by 3-5% over temperate sites and force operators to finance large chilled-water plants or adopt liquid-cooling in order to keep GPU racks within spec.[3]Uptime Institute, “Cooling Systems Survey 2025: DLC adoption remains slow and steady,” Uptime Institute. AI clusters exacerbate the heat profile, and water-scarcity regulations restrict evaporative systems, increasing dependence on electrically driven chillers that inflate operating costs just when price pressure from new entrants intensifies.
Scarcity of Certified Data-Center Engineers
The regional talent pool for high-density power distribution, immersion-cooling maintenance and AI infrastructure management remains shallow. Global vendors report 15-25% wage premiums for skilled staff in Riyadh and Abu Dhabi compared with Frankfurt or Amsterdam. Nationalization policies compound the issue by narrowing the pool of legally compliant hires.
*Our forecasts treat driver/restraint impacts as directional, not additive. The impact forecasts reflect baseline growth, mix effects, and variable interactions.
Segment Analysis
By Data Center Size: Massive Facilities Amplify Hyperscale Demand
Large facilities accounted for 39.62% of deployed capacity, thanks to enterprise loyalty and fully depreciated assets. However, as new-generation campuses come online, this share is set to decline. Meanwhile, massive campuses, driven by sovereign AI programs and hyperscalers requiring contiguous power blocks exceeding 50 MW, recorded the highest growth in the segment with a 16.69% CAGR. Between 2026 and 2031, the Middle East data center market is expected to more than double in size due to these massive builds. Operators securing multi-hundred-megawatt grid connections are currently enjoying a status of preferential procurement.
The shift favors developers like DataVolt, whose 1.5 GW net-zero AI factory in NEOM underlines how sovereign planning circumvents the incremental build logic of traditional colocation. Mega and medium formats remain relevant for regional cloud services that require country-specific presence yet cannot absorb the economics of massive footprints. Small edge nodes continue to address latency-critical use cases and regulatory residency clauses, ensuring a barbell-sized structure that blends both hyperscale and micro deployments within the same regional ecosystem.


By Tier Standard: Tier 4 Gains Traction
Tier 3 facilities accounted for 67.05% of the Middle East data center market share in 2025, confirming their status as the cost-effective sweet spot for reliability in multi-tenant applications. Tier 4, however, is advancing at 16.55% CAGR as AI training, digital payments clearing, and national security workloads raise the bar on fault tolerance. The Middle East data center market size allocated to Tier 4 is expected to triple by the end of the decade, driven by expedited sovereign permitting for critical infrastructure projects.
Regional operators showcase Tier 4 ambitions to signal long-term reliability. Uptime Institute certifications, such as Etisalat’s Tier III Gold for Operational Sustainability, illustrate a maturing quality culture that reduces perceived geopolitical risk. Yet the CAPEX per MW differential between Tier 3 and Tier 4 remains a hurdle for second-tier cities where price-sensitive tenants dominate. Developers must therefore calibrate redundancy levels to local demand elasticity, often blending Tier 3 and Tier 4 halls on the same site.
By Data Center Type: Edge Momentum Meets Colocation Scale
Colocation retained 99.05% of installed capacity in 2025, making it the default procurement model for enterprises that prefer opex flexibility. Nonetheless, the edge slice is growing at 16.41% CAGR as smart-city, mobility, and industrial IoT projects push compute to within 20 ms of users. Use cases such as the UAE’s Sovereign Mobility Cloud place specialized edge clusters inside logistics hubs where colocation economics alone cannot justify the site.
Hyperscale self-builds, while niche, set technology agendas around containerized DX cooling and direct-to-chip systems that later trickle down to colo operators. Enterprise-owned sites continue in sectors like defense and banking, where full-stack control outweighs the capital burden. The coexistence of these archetypes suggests that the Middle East data center market is not converging on a single design, but rather fragmenting to accommodate workload diversity.
By End User Industry: BFSI Outpaces Core IT
IT and telecom generated 55.10% of the installed load in 2025, but BFSI is registering 17.29% CAGR, driven by digital banking licenses, instant payment rails, and stringent uptime requirements for fintech sandboxes. As a result, the Middle East data center market size allocated to BFSI workloads is expected to nearly double by 2031. Cyber-resilience audits and dual-site mandates make BFSI tenants willing to pay premiums for Tier 4 and liquid-cooled racks that support analytics engines.
Government programs represent a second wave of structural demand because ministries must adhere to sovereign-cloud and data-localization clauses. E-commerce, media streaming, and emerging Industry 4.0 pilots continue to grow at mid-teen rates, widening the tenant mix and reducing single-customer concentration risk for operators.
Geography Analysis
Israel commanded 46.52% of regional installed capacity in 2025, a position built on decades of cybersecurity R&D, early adoption of immersion cooling, and strong global tech linkages. Domestic vendors such as ZutaCore export cooling kits to Gulf operators, leveraging intellectual property rather than land availability to influence regional designs. A dense peering fabric around Tel Aviv enables hyperscalers to utilize Israel as a low-latency connection to both Europe and India, thereby boosting its centrality.
The United Arab Emirates is the fastest-growing market at 16.77% CAGR through 2031, propelled by sovereign wealth fund capital that unlocks grid interconnections and renewable PPAs at commercially attractive tariffs. Khazna alone controls 70% of operational UAE capacity and continues to add halls inside Abu Dhabi and Dubai, leveraging cable landings at Fujairah that shorten routes to Mumbai and Marseille. Cross-border initiatives, such as the EUR 30-50 billion (approximately USD 35-70 billion) UAE-France AI corridor, reinforce the country’s ambition to act as a neutral computing hub covering three continents.
Saudi Arabia combines top-line volume potential with policy support. The 1 GW center3 roadmap aligns with Vision 2030 goals and benefits from land-grant incentives near industrial zones where waste-gas power trials are underway. Qatar, Kuwait and Bahrain supply redundancy for enterprises seeking multi-jurisdiction resilience, often specializing in niche propositions such as LEED Platinum sustainability credentials or LNG-pegged tariff hedging.
Competitive Landscape
The market remains moderately concentrated. National champions such as Khazna, stc center3 and MEEZA dominate home territories, yet no single group holds regional supremacy. International brands such as Digital Realty and Equinix prefer joint ventures or managed-shell models over head-to-head greenfield contests, underscoring the value of local partner credibility. Energy majors are emerging disruptors, attracted by the prospect of monetizing flare gas or co-locating behind-the-meter solar assets, a shift that could squeeze traditional colo margins by lowering the cost base for new entrants.
Technology differentiation rather than pure scale is becoming the key competitive axis. Operators that master 100 kW-per-rack liquid cooling and AI cluster orchestration can charge a 20-30% premium over basic footprint. Certifications (Uptime, LEED, ISO 27001) have become table stakes; customers now focus on sustainability metrics, such as water usage effectiveness and grid-carbon factor. Cross-border fiber ownership is another moat; firms that bundle lit capacity between Riyadh, Abu Dhabi, and Tel Aviv secure stickier multi-site contracts and can arbitrage bandwidth pricing.
Consolidation is likely, as Tier-2 providers struggle with capital intensity and staffing shortages. Strategic buyers include private-equity backed platform companies hunting for yield, and sovereign funds seeking geopolitical leverage through control of digital infrastructure. Niche players will survive by specializing in edge nodes, sovereign-cloud enclaves or retrofit liquid-cooling services.
Middle East Data Center Industry Leaders
Teraco Data Environments (Digital Realty)
Adgar Investments & Development Ltd.
Equinix, Inc
Khazna Data Centers LLC
Amazon Web Services Inc.
- *Disclaimer: Major Players sorted in no particular order

Recent Industry Developments
- November 2025: Microsoft (MSFT.O) and Abu Dhabi's G42 have announced a 200-megawatt data center expansion in the UAE, part of Microsoft's over USD 15 billion investment in the Gulf. Khazna Data Centers, a G42 unit, will lead the project, with operations expected to commence by late next year.
- August 2025: Center3 unveiled plans for 1 gigawatt of data-center capacity in Saudi Arabia by 2030.
- March 2025: Alfanar announced a USD 1.4 billion investment in Saudi data centers.
- February 2025: Abu Dhabi’s ADQ and Energy Capital Partners have created a USD 25 billion vehicle for U.S. data center power projects.


Middle East Data Center Market Report Scope
By Data Center Size
| Large |
| Massive |
| Medium |
| Mega |
| Small |
By Tier Standard
| Tier 1 and 2 |
| Tier 3 |
| Tier 4 |
By Data Center Type
| Hyperscale or Self-built | ||
| Enterprise or Edge | ||
| Colocation | Non Utilized | |
| Utilized | Retail Colocation | |
| Wholesale Colocation | ||
By End User Industry
| BFSI |
| IT and ITES |
| E-Commerce |
| Government |
| Manufacturing |
| Media and Entertainment |
| Telecom |
| Other End User Industries |
By Country
| Saudi Arabia |
| United Arab Emirates |
| Israel |
| Rest of Middle East |
| By Data Center Size | Large | ||
| Massive | |||
| Medium | |||
| Mega | |||
| Small | |||
| By Tier Standard | Tier 1 and 2 | ||
| Tier 3 | |||
| Tier 4 | |||
| By Data Center Type | Hyperscale or Self-built | ||
| Enterprise or Edge | |||
| Colocation | Non Utilized | ||
| Utilized | Retail Colocation | ||
| Wholesale Colocation | |||
| By End User Industry | BFSI | ||
| IT and ITES | |||
| E-Commerce | |||
| Government | |||
| Manufacturing | |||
| Media and Entertainment | |||
| Telecom | |||
| Other End User Industries | |||
| By Country | Saudi Arabia | ||
| United Arab Emirates | |||
| Israel | |||
| Rest of Middle East | |||


Market Definition
- IT LOAD CAPACITY - The IT load capacity or installed capacity, refers to the amount of energy consumed by servers and network equipments placed in a rack installed. It is measured in megawatt (MW).
- ABSORPTION RATE - It denotes the extend to which the data center capacity has been leased out. For instance, a 100 MW DC has leased out 75 MW, then absorption rate would be 75%. It is also referred as utilization rate and leased-out capacity.
- RAISED FLOOR SPACE - It is an elevated space build over the floor. This gap between the original floor and the elevated floor is used to accommodate wiring, cooling, and other data center equipment. This arrangement assist in having proper wiring and cooling infrastructure. It is measured in square feet (ft^2).
- DATA CENTER SIZE - Data Center Size is segmented based on the raised floor space allocated to the data center facilities. Mega DC - # of Racks must be more than 9000 or RFS (raised floor space) must be more than 225001 Sq. ft; Massive DC - # of Racks must be in between 9000 and 3001 or RFS must be in between 225000 Sq. ft and 75001 Sq. ft; Large DC - # of Racks must be in between 3000 and 801 or RFS must be in between 75000 Sq. ft and 20001 Sq. ft; Medium DC # of Racks must be in between 800 and 201 or RFS must be in between 20000 Sq. ft and 5001 Sq. ft; Small DC - # of Racks must be less than 200 or RFS must be less than 5000 Sq. ft.
- TIER TYPE - According to Uptime Institute the data centers are classified into four tiers based on the proficiencies of redundant equipment of the data center infrastructure. In this segment the data center are segmented as Tier 1,Tier 2, Tier 3 and Tier 4.
- COLOCATION TYPE - The segment is segregated into 3 categories namely Retail, Wholesale and Hyperscale Colocation service. The categorization is done based on the amount of IT load leased out to potential customers. Retail colocation service has leased capacity less than 250 kW; Wholesale colocation services has leased capacity between 251 kW and 4 MW and Hyperscale colocation services has leased capacity more than 4 MW.
- END CONSUMERS - The Data Center Market operates on a B2B basis. BFSI, Government, Cloud Operators, Media and Entertainment, E-Commerce, Telecom and Manufacturing are the major end-consumers in the market studied. The scope only includes colocation service operators catering to the increasing digitalization of the end-user industries.
| Keyword | Definition |
|---|---|
| Rack Unit | Generally referred as U or RU, it is the unit of measurement for the server unit housed in the racks in the data center. 1U is equal to 1.75 inches. |
| Rack Density | It defines the amount of power consumed by the equipment and server housed in a rack. It is measured in kilowatt (kW). This factor plays a critical role in data center design and, cooling and power planning. |
| IT Load Capacity | The IT load capacity or installed capacity, refers to the amount of energy consumed by servers and network equipment placed in a rack installed. It is measured in megawatt (MW). |
| Absorption Rate | It denotes how much of the data center capacity has been leased out. For instance, if a 100 MW DC has leased out 75 MW, then the absorption rate would be 75%. It is also referred to as utilization rate and leased-out capacity. |
| Raised Floor Space | It is an elevated space built over the floor. This gap between the original floor and the elevated floor is used to accommodate wiring, cooling, and other data center equipment. This arrangement assists in having proper wiring and cooling infrastructure. It is measured in square feet/meter. |
| Computer Room Air Conditioner (CRAC) | It is a device used to monitor and maintain the temperature, air circulation, and humidity inside the server room in the data center. |
| Aisle | It is the open space between the rows of racks. This open space is critical for maintaining the optimal temperature (20-25 °C) in the server room. There are primarily two aisles inside the server room, a hot aisle and a cold aisle. |
| Cold Aisle | It is the aisle wherein the front of the rack faces the aisle. Here, chilled air is directed into the aisle so that it can enter the front of the racks and maintain the temperature. |
| Hot Aisle | It is the aisle where the back of the racks faces the aisle. Here, the heat dissipated from the equipment’s in the rack is directed to the outlet vent of the CRAC. |
| Critical Load | It includes the servers and other computer equipment whose uptime is critical for data center operation. |
| Power Usage Effectiveness (PUE) | It is a metric which defines the efficiency of a data center. It is calculated by: (𝑇𝑜𝑡𝑎𝑙 𝐷𝑎𝑡𝑎 𝐶𝑒𝑛𝑡𝑒𝑟 𝐸𝑛𝑒𝑟𝑔𝑦 𝐶𝑜𝑛𝑠𝑢𝑚𝑝𝑡𝑖𝑜𝑛)/(𝑇𝑜𝑡𝑎𝑙 𝐼𝑇 𝐸𝑞𝑢𝑖𝑝𝑚𝑒𝑛𝑡 𝐸𝑛𝑒𝑟𝑔𝑦 𝐶𝑜𝑛𝑠𝑢𝑚𝑝𝑡𝑖𝑜𝑛). Further, a data center with a PUE of 1.2-1.5 is considered highly efficient, whereas, a data center with a PUE >2 is considered highly inefficient. |
| Redundancy | It is defined as a system design wherein additional component (UPS, generators, CRAC) is added so that in case of power outage, equipment failure, the IT equipment should not be affected. |
| Uninterruptible Power Supply (UPS) | It is a device that is connected in series with the utility power supply, storing energy in batteries such that the supply from UPS is continuous to IT equipment even during utility power is snapped. The UPS primarily supports the IT equipment only. |
| Generators | Just like UPS, generators are placed in the data center to ensure an uninterrupted power supply, avoiding downtime. Data center facilities have diesel generators and commonly, 48-hour diesel is stored in the facility to prevent disruption. |
| N | It denotes the tools and equipment required for a data center to function at full load. Only "N" indicates that there is no backup to the equipment in the event of any failure. |
| N+1 | Referred to as 'Need plus one', it denotes the additional equipment setup available to avoid downtime in case of failure. A data center is considered N+1 when there is one additional unit for every 4 components. For instance, if a data center has 4 UPS systems, then for to achieve N+1, an additional UPS system would be required. |
| 2N | It refers to fully redundant design wherein two independent power distribution system is deployed. Therefore, in the event of a complete failure of one distribution system, the other system will still supply power to the data center. |
| In-Row Cooling | It is the cooling design system installed between racks in a row where it draws warm air from the hot aisle and supplies cool air to the cold aisle, thereby maintaining the temperature. |
| Tier 1 | Tier classification determines the preparedness of a data center facility to sustain data center operation. A data center is classified as Tier 1 data center when it has a non-redundant (N) power component (UPS, generators), cooling components, and power distribution system (from utility power grids). The Tier 1 data center has an uptime of 99.67% and an annual downtime of <28.8 hours. |
| Tier 2 | A data center is classified as Tier 2 data center when it has a redundant power and cooling components (N+1) and a single non-redundant distribution system. Redundant components include extra generators, UPS, chillers, heat rejection equipment, and fuel tanks. The Tier 2 data center has an uptime of 99.74% and an annual downtime of <22 hours. |
| Tier 3 | A data center having redundant power and cooling components and multiple power distribution systems is referred to as a Tier 3 data center. The facility is resistant to planned (facility maintenance) and unplanned (power outage, cooling failure) disruption. The Tier 3 data center has an uptime of 99.98% and an annual downtime of <1.6 hours. |
| Tier 4 | It is the most tolerant type of data center. A Tier 4 data center has multiple, independent redundant power and cooling components and multiple power distribution paths. All IT equipment are dual powered, making them fault tolerant in case of any disruption, thereby ensuring interrupted operation. The Tier 4 data center has an uptime of 99.74% and an annual downtime of <26.3 minutes. |
| Small Data Center | Data center that has floor space area of ≤ 5,000 Sq. ft or the number of racks that can be installed is ≤ 200 is classified as a small data center. |
| Medium Data Center | Data center which has floor space area between 5,001-20,000 Sq. ft, or the number of racks that can be installed is between 201-800, is classified as a medium data center. |
| Large Data Center | Data center which has floor space area between 20,001-75,000 Sq. ft, or the number of racks that can be installed is between 801-3,000, is classified as a large data center. |
| Massive Data Center | Data center which has floor space area between 75,001-225,000 Sq. ft, or the number of racks that can be installed is between 3001-9,000, is classified as a massive data center. |
| Mega Data Center | Data center that has a floor space area of ≥ 225,001 Sq. ft or the number of racks that can be installed is ≥ 9001 is classified as a mega data center. |
| Retail Colocation | It refers to those customers who have a capacity requirement of 250 kW or less. These services are majorly opted by small and medium enterprises (SMEs). |
| Wholesale Colocation | It refers to those customers who have a capacity requirement between 250 kW to 4 MW. These services are majorly opted by medium to large enterprises. |
| Hyperscale Colocation | It refers to those customers who have a capacity requirement greater than 4 MW. The hyperscale demand primarily originates from large-scale cloud players, IT companies, BFSI, and OTT players (like Netflix, Hulu, and HBO+). |
| Mobile Data Speed | It is the mobile internet speed a user experiences via their smartphones. This speed is primarily dependent on the carrier technology being used in the smartphone. The carrier technologies available in the market are 2G, 3G, 4G, and 5G, where 2G provides the slowest speed while 5G is the fastest. |
| Fiber Connectivity Network | It is a network of optical fiber cables deployed across the country, connecting rural and urban regions with high-speed internet connection. It is measured in kilometer (km). |
| Data Traffic per Smartphone | It is a measure of average data consumption by a smartphone user in a month. It is measured in gigabyte (GB). |
| Broadband Data Speed | It is the internet speed that is supplied over the fixed cable connection. Commonly, copper cable and optic fiber cable are used in both residential and commercial use. Here, optic cable fiber provides faster internet speed than copper cable. |
| Submarine Cable | A submarine cable is a fiber optic cable laid down at two or more landing points. Through this cable, communication and internet connectivity between countries across the globe is established. These cables can transmit 100-200 terabits per second (Tbps) from one point to another. |
| Carbon Footprint | It is the measure of carbon dioxide generated during the regular operation of a data center. Since, coal, and oil & gas are the primary source of power generation, consumption of this power contributes to carbon emissions. Data center operators are incorporating renewable energy sources to curb the carbon footprint emerging in their facilities. |


Research Methodology
Mordor Intelligence follows a four-step methodology in all our reports.
- Step-1: Identify Key Variables: In order to build a robust forecasting methodology, the variables and factors identified in Step-1 are tested against available historical market numbers. Through an iterative process, the variables required for market forecast are set and the model is built on the basis of these variables.
- Step-2: Build a Market Model: Market-size estimations for the forecast years are in nominal terms. Inflation is not a part of the pricing, and the average selling price (ASP) is kept constant throughout the forecast period for each country.
- Step-3: Validate and Finalize: In this important step, all market numbers, variables and analyst calls are validated through an extensive network of primary research experts from the market studied. The respondents are selected across levels and functions to generate a holistic picture of the market studied.
- Step-4: Research Outputs: Syndicated Reports, Custom Consulting Assignments, Databases & Subscription Platforms


