Market Overview
| Study Period | 2021 - 2031 |
|---|---|
| Forecast Data Period | 2026 - 2031 |
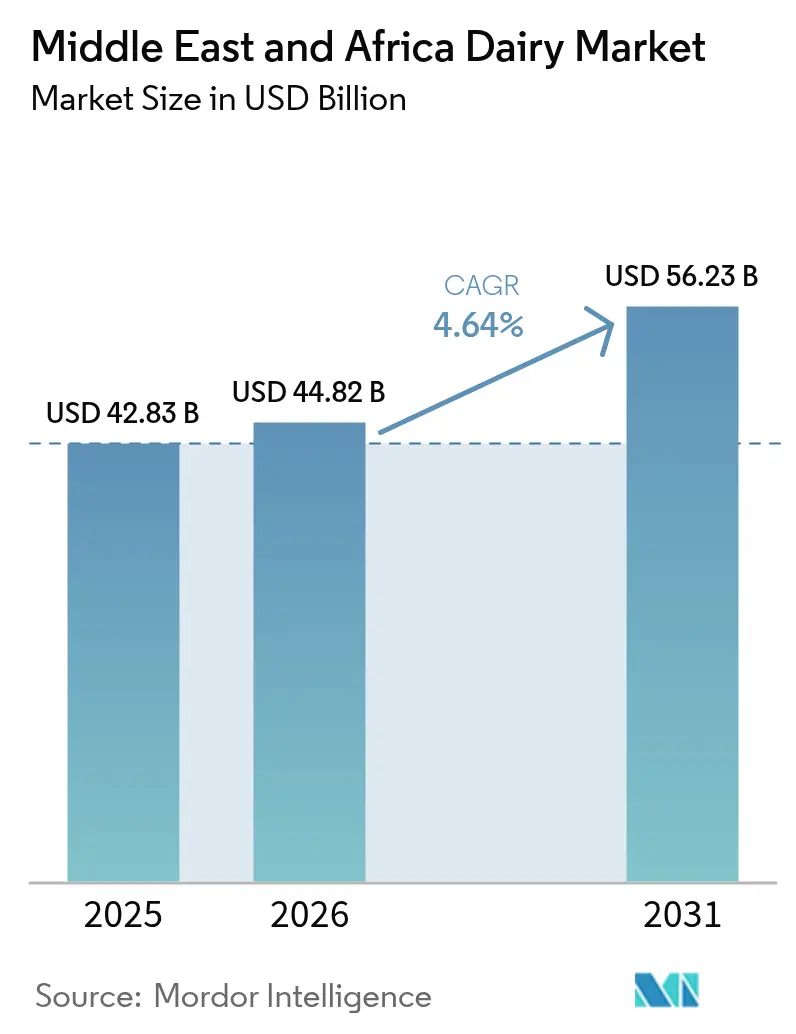
| Base Year Market Size (2025) | USD 42.83 Billion |
| Market Size (2026) | USD 44.82 Billion |
| Market Size (2031) | USD 56.23 Billion |
| Growth Rate (2026 - 2031) | 4.64% CAGR |
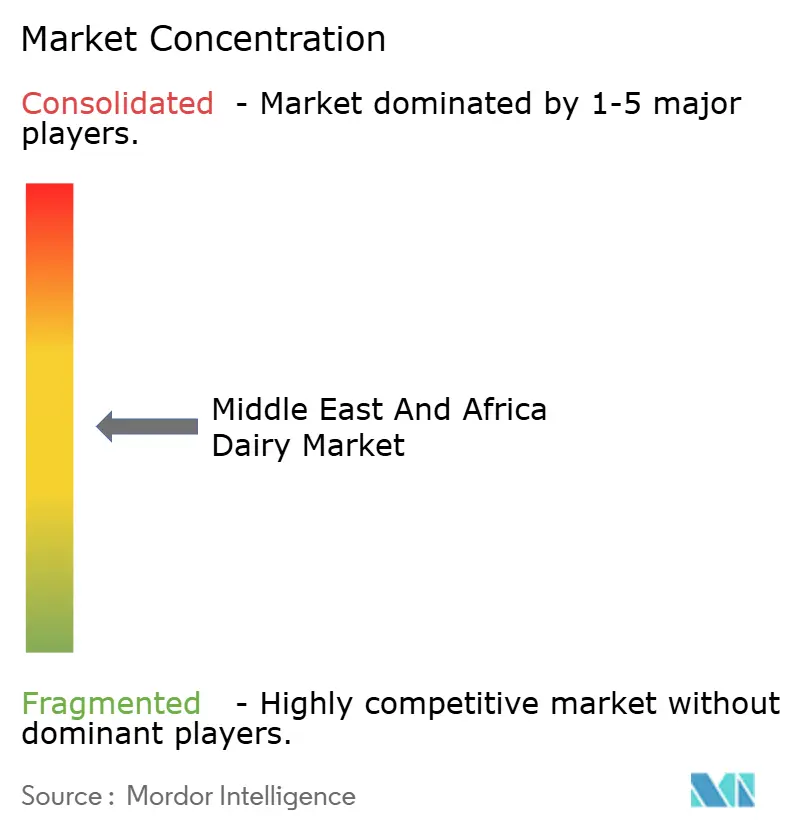
| Market Concentration | Medium |
Major Players
*Disclaimer: Major Players sorted in no particular order Image © Mordor Intelligence. Reuse requires attribution under CC BY 4.0. |
|
Middle East And Africa Dairy Market Analysis by Mordor Intelligence
Middle East and Africa dairy market size in 2026 is estimated at USD 44.82 billion, growing from 2025 value of USD 42.83 billion with 2031 projections showing USD 56.23 billion, growing at 4.64% CAGR over 2026-2031. This growth is supported by government-funded school milk programs, product innovations catering to on-the-go consumption, and increasing demand for premium products with functional benefits. However, challenges such as gaps in cold-chain infrastructure and competition from plant-based alternatives are limiting further expansion. Saudi Arabia is projected to contribute 31.31% of the 2024 output, driven by Almarai’s USD 4.8 billion investment in farm-to-logistics operations. The United Arab Emirates is expected to achieve the highest growth rate at a CAGR of 5.89%, supported by the growth of organic cow- and camel-milk brands. Yogurt is the fastest-growing category, with a CAGR of 5.93%, driven by the popularity of probiotic spoonable and drinkable products, while milk remains a key category due to shelf-stable ultra-high-temperature (UHT) products that address refrigeration challenges. Modern retail channels are anticipated to account for 65.43% of 2024 off-trade distribution, while on-trade channels, including hotels, restaurants, and cafés, are recovering alongside the resurgence of Gulf hospitality. Competitive intensity remains moderate, with leading national players benefiting from strong domestic market positions, while multinational companies are increasingly entering the market through joint ventures and premium product segments.
Key Report Takeaways
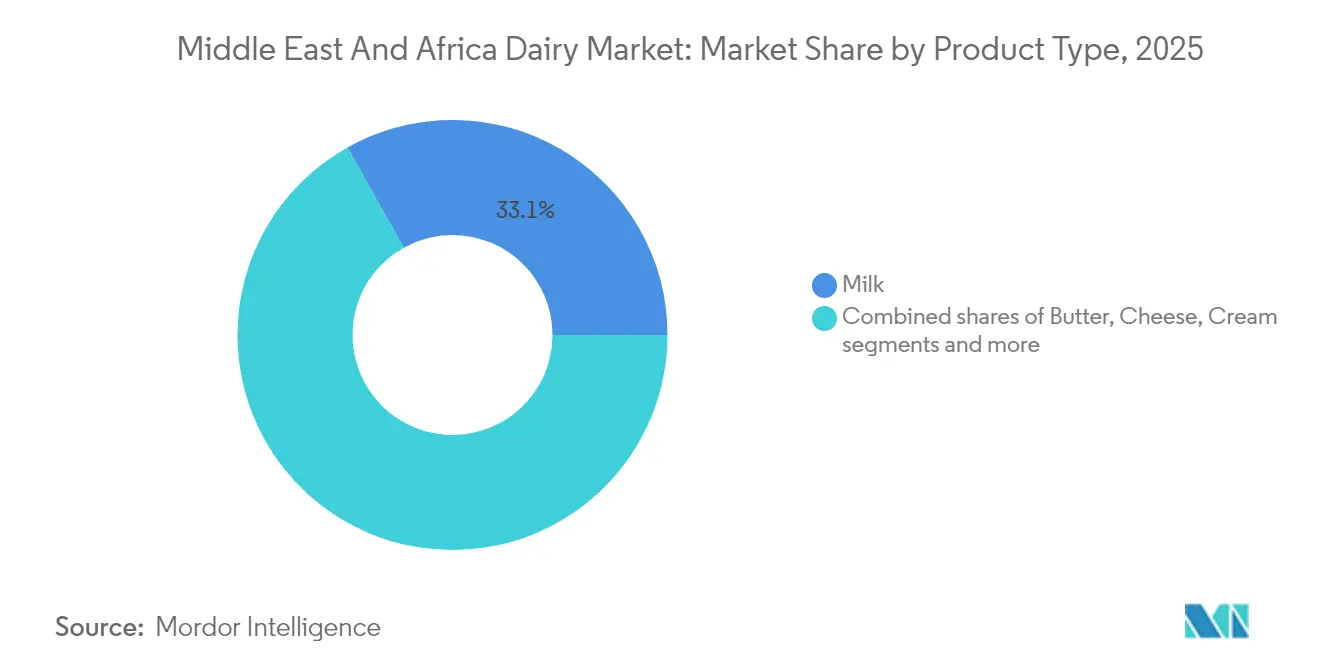
- By product type, milk held 33.12% of the Middle East and Africa dairy market share in 2025, whereas yogurt is forecast to expand at a 5.70% CAGR through 2031.
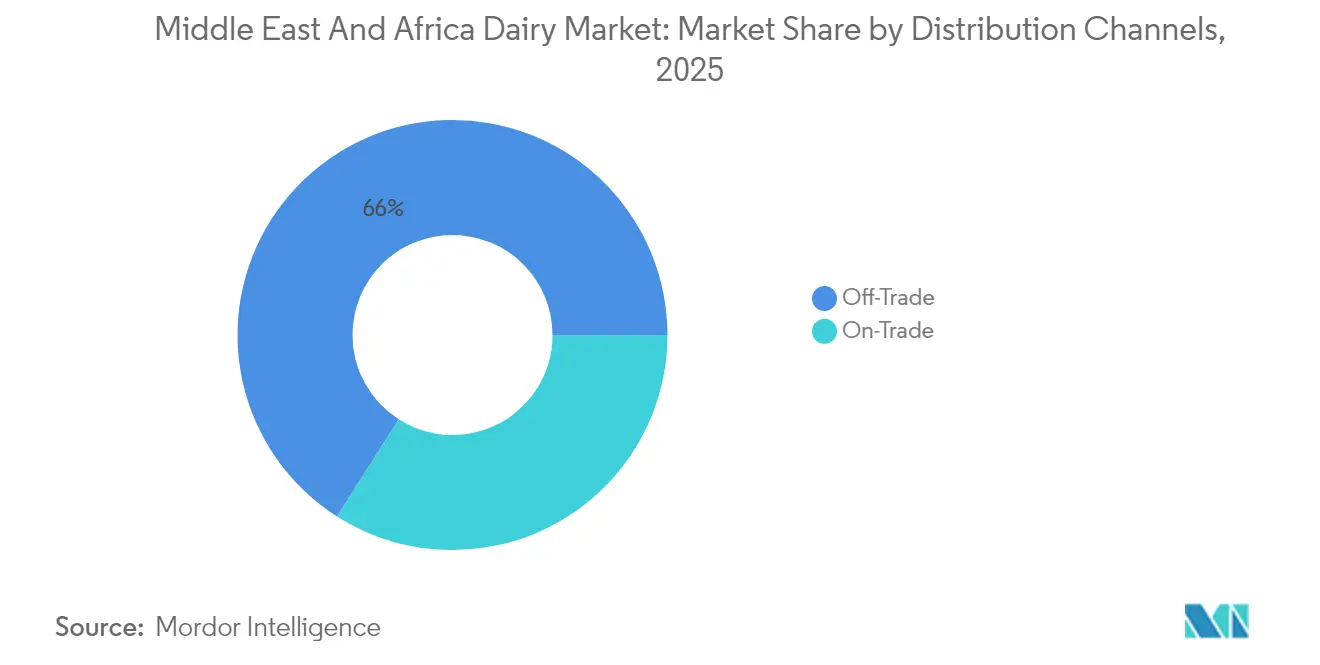
- By distribution channel, off-trade captured 65.98% of 2025 sales, while on-trade is poised for the quickest advance with a 5.78% CAGR to 2031.
- By geography, Saudi Arabia commanded 31.05% of 2025 value, yet the United Arab Emirates records the fastest trajectory at a 5.66% CAGR over the outlook period.
Note: Market size and forecast figures in this report are generated using Mordor Intelligence’s proprietary estimation framework, updated with the latest available data and insights as of 2026.
Middle East And Africa Dairy Market Trends and Insights
Drivers Impact Analysis*
| Driver | (~) % Impact on CAGR Forecast | Geographic Relevance | Impact Timeline |
|---|---|---|---|
| Rising health consciousness boosting interest in probiotic, fortified, and lactose-free dairy | +1.2% | Gulf Cooperation Council core, urban Egypt and South Africa | Medium term (2-4 years) |
| Government-backed school milk and nutrition programs creating stable institutional demand | +0.9% | Saudi Arabia, United Arab Emirates, Egypt, Qatar | Long term (≥ 4 years) |
| Public health campaigns promoting balanced diets and adequate calcium, vitamin D, and protein intake | +0.7% | Global across United Arab Emirates, strongest in Gulf Cooperation Council | Medium term (2-4 years) |
| Growing consumer preference for convenient, ready-to-drink and single-serve dairy formats | +1.0% | Gulf Cooperation Council, urban centers in Egypt and South Africa | Short term (≤ 2 years) |
| Rising interest in organic and clean-label dairy products | +0.5% | United Arab Emirates, Qatar, Saudi Arabia premium segments | Medium term (2-4 years) |
| Cultural attachment to traditional products such as laban, labneh, and sour milk drinks | +0.6% | Gulf Cooperation Council, Levant influence in Saudi Arabia and United Arab Emirates | Long term (≥ 4 years) |
| Source: Mordor Intelligence | |||


Rising Health Consciousness Boosting Interest in Probiotic, Fortified, and Lactose-Free Dairy
Functional dairy has shifted from being a niche category to a standard expectation in the Gulf Cooperation Council (GCC) region, driven by consumers' growing focus on ingredient labels for live cultures, added vitamins, and lactose-free claims. In Abu Dhabi, the 2024 school nutrition guidelines mandate that all dairy products served in public schools meet specific minimum thresholds for calcium and vitamin D, effectively excluding commodity suppliers and favoring brands that invest in fortification. For example, Mleiha Dairy in the United Arab Emirates launched a lactose-free laban product line in early 2025, quickly capturing a significant share of the emirate's laban market by addressing the needs of the substantial proportion of Middle Eastern adults who experience lactose malabsorption. In Saudi Arabia, the demand for probiotic yogurt surged, supported by social media campaigns highlighting the connection between gut microbiome health and immunity—a message that resonated strongly with consumers amid heightened health awareness following the pandemic. Similarly, Danone's Activia brand, reformulated with the Bifidobacterium lactis strain, experienced notable volume growth in Egypt during 2024, demonstrating how science-backed strain specificity can justify premium pricing, even in price-sensitive markets. Furthermore, in 2024, the federal government allocated AED 5 billion to healthcare, as reported by the United States-United Arab Emirates Business Council [1]Source: The U.S.-U.A.E. Business Council, "U.A.E. Healthcare & Life Sciences Sector", usuaebusiness.org .
Government-Backed School Milk and Nutrition Programs Creating Stable Institutional Demand
School milk schemes provide a consistent demand base for producers, shielding them from retail market fluctuations while imposing strict quality and traceability requirements that often benefit vertically integrated dairies. In 2024, the Ministry of Education in Saudi Arabia renewed its five-year school milk contract, committing to supply hundreds of millions of 200-milliliter cartons annually to millions of students, representing a significant share of the Kingdom's total fluid milk consumption. Almarai and SADAFCO jointly hold this contract, utilizing ultra-high-temperature processing to extend shelf life for several months without refrigeration, a crucial feature for schools in remote areas with limited access to reliable cold storage. In Egypt, the Takaful and Karama social protection program, which supports millions of families, includes a monthly dairy voucher redeemable at government-approved retailers, channeling a substantial annual amount into the formal dairy sector and reducing reliance on informal, unbranded milk sources. Meanwhile, in Qatar, the Supreme Council of Health mandates that all school cafeterias provide at least one fortified dairy option per meal, prompting Baladna to develop a vitamin D-enriched flavored milk product that now contributes significantly to the company’s domestic revenue. Additionally, in Saudi Arabia, the Ministry of Education has emphasized the impact of its nationwide school nutrition initiative, which serves 5.2 million students across 35,000 schools and has created a stable institutional demand valued at approximately USD 400 million in 2024 [2]Source: Ministry of Education in Saudi Arabia, "Data and Statistics", moe.gov.sa.
Growing Consumer Preference for Convenient, Ready-to-Drink and Single-Serve Dairy Formats
Single-serve packaging is transforming distribution economics, allowing dairy brands to expand into convenience stores, petrol stations, and vending machines—channels traditionally dominated by carbonated soft drinks. In the United Arab Emirates, ready-to-drink flavored milk in 250-milliliter Tetra Pak cartons experienced significant volume growth during 2024, surpassing the growth of traditional one-liter family packs, as on-the-go consumption patterns increasingly align with those in Western markets. Saudi Dairy and Foodstuff Company’s Saudia brand introduced a 180-milliliter chocolate milk with a resealable sports cap in March 2025, specifically targeting gym-goers and school children. Within a few months, this product contributed notably to the company’s flavored milk revenue. Similarly, Nestlé’s Nido fortified milk powder launched single-serve sachets in Egypt in late 2024, effectively lowering the upfront cost for low-income households and driving a substantial volume increase in rural governorates, where bulk purchases often place a financial strain on household budgets.
Cultural Attachment to Traditional Products Such as Laban, Labneh, and Sour Milk Drinks
Traditional fermented dairy products continue to serve as cultural staples while experiencing premiumization and format innovation aimed at appealing to younger, health-conscious consumers. Laban, a thin and tangy yogurt drink, is projected to account for a significant portion of the Gulf's total yogurt market by volume in the year 2024. This share has remained consistent over the past decade, reflecting entrenched consumption patterns. In the year 2024, Al Ain Farms in the United Arab Emirates launched an organic laban in glass bottles, priced significantly higher than conventional plastic-bottled alternatives. The product sold out its initial production run within a short period, demonstrating that heritage products can support premium positioning when provenance and sustainability narratives are effectively communicated. Labneh, a strained yogurt with a cream cheese-like texture, is increasingly being offered in single-serve tubs with flavored options such as za'atar, olive oil, and honey. NADEC leveraged this trend with the introduction of a small-sized labneh cup in May of the year 2025, which now accounts for a notable portion of its fresh dairy revenue. Additionally, the Gulf Cooperation Council Standardization Organization updated microbiological standards for fermented dairy products in the year 2024, mandating batch-level pathogen testing. This regulation increased compliance costs by a measurable percentage but also established a quality benchmark that benefits established brands by creating barriers for informal producers.
Restraints Impact Analysis*
| Restraint | (~) % Impact on CAGR Forecast | Geographic Relevance | Impact Timeline |
|---|---|---|---|
| Rising consumer interest in plant-based alternatives, especially in urban centers | -0.8% | United Arab Emirates, Saudi Arabia urban, Egypt Cairo | Short term (≤ 2 years) |
| Stricter environmental and animal-welfare expectations increasing compliance costs | -0.5% | Gulf Cooperation Council, South Africa | Medium term (2-4 years) |
| Halal-certification delays and costs for imported ingredients limiting speed of innovation | -0.4% | Gulf Cooperation Council, Egypt, Malaysia-certified imports | Medium term (2-4 years) |
| Inadequate cold-chain coverage and power reliability | -0.9% | Sub-Saharan Africa, rural Egypt, Yemen | Long term (≥ 4 years) |
| Source: Mordor Intelligence | |||
Rising Consumer Interest in Plant-Based Alternatives, Especially in Urban Centers
Plant-based milk alternatives have transitioned from niche health stores to prominent shelf space in mainstream supermarkets across Dubai, Riyadh, and Cairo, reducing dairy's volume share among urban millennials and Generation Z consumers. Nuitree, a United Arab Emirates-based oat milk brand launched in 2024, achieved listings in Carrefour and Spinneys within six months and reported first-year sales of USD 3.2 million. Although this figure may seem modest, it reflects the rapid adoption of plant-based dairy in a market where such products were nearly absent just a few years ago. In 2024, almond and oat drinks in the United Arab Emirates experienced significant volume growth, while conventional cow's milk saw minimal growth. This disparity led Almarai to announce in September 2025 its plans to consider launching a plant-based product line in 2026. Additionally, as of 2024, 10% of Saudi Arabia's population identified as vegetarian or vegan, according to Farmlandgrab [3]Source: Farmlandgrab, "Down on the farm", farmlandgrab.org.
Inadequate Cold-Chain Coverage and Power Reliability
Cold-chain deficiencies represent the most significant infrastructure challenge in Sub-Saharan Africa, where a substantial portion of dairy products spoils before reaching consumers. This spoilage results in considerable financial losses across the continent. In Nigeria, the national electricity grid provides power for limited hours each day, compelling dairy distributors to depend on diesel generators. This dependency significantly increases logistics costs, thereby reducing profit margins in a market where retail prices are restricted by the purchasing power of consumers. In Egypt's rural governorates, the absence of refrigerated transport for last-mile delivery has driven companies such as Juhayna and Domty to allocate resources toward solar-powered cooling units for village retailers. The investment required for each unit is substantial, making it viable only for outlets with high sales volumes. In Morocco, a cold-chain project supported by the United Nations Development Programme, initiated in 2024 with significant funding, aims to establish hundreds of solar-refrigerated collection points in the Atlas Mountains. However, the initiative has faced delays due to disputes over land ownership and resistance from local communities to centralized milk aggregation.
*Our forecasts treat driver/restraint impacts as directional, not additive. The impact forecasts reflect baseline growth, mix effects, and variable interactions.
Segment Analysis
By Product Type: Yogurt Leads Growth as Milk Defends Volume Share
Milk accounted for 33.12% of the product-type share in 2025, primarily driven by Ultra-High Temperature (UHT) milk variants, which hold a significant position in the Gulf Cooperation Council (GCC) region. The consistently high ambient temperatures in the region, typically ranging between 35 degrees Celsius and 45 degrees Celsius during the summer months, create logistical difficulties for distributing refrigerated fresh milk, particularly in areas outside major urban centers. This has led to a preference for UHT milk, which does not require refrigeration and is better suited to the region's climatic and logistical conditions.
Yogurt is projected to grow at a Compound Annual Growth Rate (CAGR) of 5.70% from 2026 to 2031, supported by the increasing popularity of probiotic-enriched and drinkable formats that cater to on-the-go lifestyles. Notably, Danone's Activia and local brands such as SADAFCO's Saudia Yoghurt reported a combined volume growth of 21% in Saudi Arabia in 2024. Cheese imports are expected to increase by 26% in value by 2030, driven by expatriate demand for European-style natural cheeses and the reliance of quick-service restaurant chains on processed cheese for menu standardization. In South Africa, Clover Industries reported a 14% growth in its cheddar line in 2024, surpassing overall dairy market growth, as pizza and burger chains expanded their store networks.


By Distribution Channel: Off-Trade Dominates, Yet On-Trade Accelerates
Off-trade channels, including supermarkets, hypermarkets, convenience stores, online retail, and specialist retailers, accounted for 65.98% of the distribution share in 2025. This reflects the rapid expansion of modern retail in the Middle East and Africa and consumers' preference for one-stop shopping. On the other hand, on-trade outlets such as hotels, restaurants, and cafes are projected to grow at a faster rate, with a CAGR of 5.78% for 2026-2031. This growth is attributed to a rebound in tourism and hospitality spending across the Gulf Cooperation Council. For instance, Dubai welcomed 17.15 million overnight visitors in 2024, marking a 12% year-on-year increase, which has driven demand for portion-controlled dairy formats in hotel buffets and café menus.
Supermarkets and hypermarkets alone contributed 42% of off-trade volume, with chains like Carrefour, Lulu, and Tamimi Markets expanding their cold-chain-enabled store networks. Notably, Lulu Group opened 18 new hypermarkets across the Gulf in 2024, each featuring dedicated dairy sections with 150 to 200 SKUs. Convenience stores, while smaller in absolute volume, recorded an 11% growth in dairy sales during 2024. This growth was driven by the popularity of single-serve formats and extended operating hours, catering to shift workers and late-night shoppers.
Geography Analysis
Saudi Arabia emerged as the leading segment in the regional dairy market, holding a significant 31.05% of the country-level market share in 2025. This dominance is underpinned by Almarai's robust vertically integrated model, which encompasses 58,000 dairy cows, 14 processing plants, and a distribution network that serves 55,000 retail outlets. The Kingdom's Vision 2030 economic diversification plan places a strong emphasis on food security, prompting the government to actively support domestic dairy production. Measures such as feed-cost subsidies and low-interest loans have been implemented, with the Saudi Ministry of Environment, Water, and Agriculture allocating SAR 1.2 billion (USD 320 million) in 2024 to dairy farmers. These initiatives have effectively reduced input costs by an estimated 18%, further strengthening the sector's competitiveness.
The United Arab Emirates is positioned as the fastest-growing segment in the regional dairy market, with a projected compound annual growth rate (CAGR) of 5.66% for the period 2026-2031. This growth is driven by the rising demand for organic and premium dairy products, led by innovators such as Mleiha Dairy and camel-milk brands like Camelicious, which cater to the preferences of health-conscious expatriates and local consumers. Dubai's 2024 Food Security Strategy has set an ambitious target, mandating that 30% of dairy consumed in government institutions must be locally sourced by 2027. This directive has encouraged key players like Al Ain Farms and Emirates Industry for Camel Milk & Products (Camelicious) to expand their herd sizes and enhance processing capacities to meet the growing demand.
Other markets in the region, such as Egypt and Iran, face unique challenges that impact their growth trajectories. Egypt's dairy sector, while substantial in volume, is expected to grow at a modest 3.72% CAGR for 2026-2031. The sector is constrained by factors such as currency devaluation, which increased imported-input costs by 40% in 2024, and the prevalence of informal milk markets, which account for an estimated 60% of total consumption. Juhayna, Egypt's largest dairy processor, reported a 9% revenue increase in 2024, driven by its Laban Ray'e' and flavored-milk product lines. However, rising packaging and energy costs compressed net margins to 4.2% from 6.1% in 2023. In Iran, despite its large population, the dairy market remains hindered by sanctions that limit access to imported genetics and processing technology, resulting in stagnant productivity. Local brands such as Pegah and Kaleh dominate the market, but their product innovation continues to lag behind Gulf standards.
Competitive Landscape
The Middle East and Africa dairy market exhibits moderate consolidation. A limited number of vertically integrated companies, including Almarai, Saudi Dairy and Foodstuff Company (SADAFCO), and National Agricultural Development Company (NADEC) in Saudi Arabia; Baladna in Qatar; and Juhayna and Domty in Egypt, dominate 40% to 50% of their respective national markets. Simultaneously, multinational corporations such as Danone, Nestlé, and Lactalis actively compete through acquisitions, joint ventures, and the promotion of premium brands.
Market strategies show a clear divide. Gulf-based companies are focusing on vertical integration and securing government contracts. For instance, Almarai has announced a USD 4.8 billion investment plan for 2024 to 2028, which includes farm expansion, automation of processing facilities, and electrification of its distribution fleet. On the other hand, multinational companies are adopting asset-light models, such as licensing local brands or acquiring minority stakes, to address regulatory challenges and manage currency risks effectively.
Opportunities for growth in the market are concentrated in three main areas. These include lactose-free and A2 milk, which cater to the estimated 20% of Middle Eastern adults with lactose intolerance; functional dairy products aimed at improving immunity and gut health; and premium organic dairy products, where consumers in markets like the United Arab Emirates (UAE) and Qatar are willing to pay over 30% more than for conventional products. Halal certification continues to be a significant regulatory factor. The Gulf Cooperation Council Standardization Organization's 2024 update to microbiological standards for dairy will require pathogen testing at the batch level, increasing compliance costs by an estimated 5%. This change creates a quality barrier that benefits established brands over informal producers. Smaller players, such as AlRawabi and National Food Products in the UAE, are leveraging local sourcing and sustainability initiatives to gain a competitive edge. For example, AlRawabi's solar-powered farm in Ras Al Khaimah generates 40% of its energy needs, helping the company secure premium shelf space in hypermarkets and organic stores.
Middle East And Africa Dairy Industry Leaders
-
Almarai Company
-
Arla Foods Amba
-
Danone SA
-
Saudia Dairy and Foodstuff Company (SADAFCO)
-
The National Agricultural Development Company (NADEC)
- *Disclaimer: Major Players sorted in no particular order

Recent Industry Developments
- August 2025: Sawani, supported by the Public Investment Fund and owner of the NOUG brand, partnered with GEA, a German company specializing in modern milking systems, to develop its model farm. This facility, equipped with advanced technology and designed to optimize efficiency, produces 500,000 liters of camel milk each month, catering to the growing demand for camel milk products.
- January 2025: Almarai, the largest dairy producer in Saudi Arabia, has announced a USD 4.8 billion investment as part of its new five-year strategic plan. This initiative highlights Almarai's commitment to supporting Saudi Arabia's Vision 2030 goals, which focus on achieving food self-sufficiency and reducing reliance on imports. The investment will be directed towards expanding production capacity, enhancing supply chain efficiency, and adopting advanced technologies to meet growing domestic demand while ensuring sustainable practices.
- January 2024: SADAFCO has opened a new distribution depot in Makkah with an annual capacity of 50,000 tonnes. This initiative addresses the growing demand driven by religious tourism while improving supply efficiency for retailers in the western region. The facility is equipped with advanced cold-chain technology and automated inventory management systems.


Middle East And Africa Dairy Market Report Scope
Butter, Cheese, Cream, Dairy Desserts, Milk, Sour Milk Drinks, Yogurt are covered as segments by Category. Off-Trade, On-Trade are covered as segments by Distribution Channel. Bahrain, Iran, Kuwait, Oman, Qatar, Saudi Arabia, United Arab Emirates are covered as segments by Country.
By Product Type
| Butter | ||
| Cheese | Natural Cheese | Cheddar |
| Cottage | ||
| Ricotta | ||
| Parmesan | ||
| Others | ||
| Processed Cheese | ||
| Cream | Fresh Cream | |
| Cooking Cream | ||
| Whippng Cream | ||
| Others | ||
| Dairy Desserts | Ice Cream | |
| Cheesecakes | ||
| Frozen Desserts | ||
| Others | ||
| Milk | Condensed milk | |
| Flavored Milk | ||
| Fresh Milk | ||
| UHT Milk (Ultra-high temperature milk) | ||
| Powdered Milk | ||
| Yogurt | Drinkable | |
| Spoonable | ||
| Sour Milk Drinks | ||
By Distribution Channel
| On-trade | |
| Off-trade | Convenience Stores |
| Specialist Retailers | |
| Supermarkets and Hypermarkets | |
| On-line Retail | |
| Others |
By Country
| United Arab Emirates |
| Qatar |
| Saudi Arabia |
| Bahrain |
| Oman |
| Kuwait |
| Nigeria |
| Egypt |
| South Africa |
| Iran |
| Rest of the Middle East |
| By Product Type | Butter | ||
| Cheese | Natural Cheese | Cheddar | |
| Cottage | |||
| Ricotta | |||
| Parmesan | |||
| Others | |||
| Processed Cheese | |||
| Cream | Fresh Cream | ||
| Cooking Cream | |||
| Whippng Cream | |||
| Others | |||
| Dairy Desserts | Ice Cream | ||
| Cheesecakes | |||
| Frozen Desserts | |||
| Others | |||
| Milk | Condensed milk | ||
| Flavored Milk | |||
| Fresh Milk | |||
| UHT Milk (Ultra-high temperature milk) | |||
| Powdered Milk | |||
| Yogurt | Drinkable | ||
| Spoonable | |||
| Sour Milk Drinks | |||
| By Distribution Channel | On-trade | ||
| Off-trade | Convenience Stores | ||
| Specialist Retailers | |||
| Supermarkets and Hypermarkets | |||
| On-line Retail | |||
| Others | |||
| By Country | United Arab Emirates | ||
| Qatar | |||
| Saudi Arabia | |||
| Bahrain | |||
| Oman | |||
| Kuwait | |||
| Nigeria | |||
| Egypt | |||
| South Africa | |||
| Iran | |||
| Rest of the Middle East | |||


Market Definition
- Butter - Butter is a yellow-to-white solid emulsion of fat globules, water, and inorganic salts produced by churning the cream from cows’ milk
- Dairy - Dairy product include milk and any of the foods made from milk, including butter, cheese, ice cream, yogurt, and condensed and dried milk.
- Frozen Desserts - Frozen dairy dessert means and includes products containing milk or cream and other ingredients which are frozen or semi-frozen prior to consumption, such as ice milk or sherbet, including frozen dairy desserts for special dietary purposes, and sorbet
- Sour Milk Drinks - Sour milk is thick, curdled milk, with a sour taste, obtained from the fermentation of milk. Sour milk drinks such as kefir, laban, buttermilk have been considered in the study
| Keyword | Definition |
|---|---|
| Cultured Butter | Cultured butter is prepared by having the raw butter go through chemical processing and has been added with certain emulsifiers and foreign ingredients. |
| Uncultured Butter | This type of butter is one which has not been processed in any way |
| Natural Cheese | The type of cheese in its most natural form. It is made from natural and simple products and ingredients, including fresh and natural salts, natural colors, enzymes, and high-quality milk. |
| Processed Cheese | Processed cheese undergoes the same processes as natural cheese; however, it requires more steps and many different forms of ingredients. Making processed cheese involves melting natural cheese, emulsifying it, and adding preservatives and other artificial ingredients or colorings. |
| Single Cream | Single cream contains around 18% fat. It’s a single layer of cream that appears over boiled milk. |
| Double Cream | Double cream contains 48% fat, more than double the amount of fat of single cream. It’s heavier and thicker than single cream |
| Whipping Cream | This has a much higher fat percentage than single cream (36%). Used to top cakes, pies, and puddings and as a thickener for sauces, soups, and fillings. |
| Frozen Desserts | Desserts that are meant to be eaten in frozen condition. E.g., sherbets, sorbets, frozen yogurts |
| UHT Milk (Ultra-high temperature milk) | Milk heated at a very high temperature. Ultra-high-temperature processing (UHT) of milk involves heating for 1–8 sec at 135–154°C. which kills the spore-forming pathogenic microorganism, resulting in a product with a shelf-life of several months. |
| Non-dairy butter/Plant-based butter | Butter made from plant-derived oil such as coconut, palm, etc. |
| Non-dairy Yogurt | Yogurt made from typically made from nuts, like almonds, cashews, coconuts, and even other foods like soybeans, plantains, oats, and peas |
| On-trade | It refers to restaurants, QSRs, and bars. |
| Off-trade | It refers to supermarkets, hypermarkets, on-line channels, etc. |
| Neufchatel cheese | One of the oldest kinds of cheese in France. It is a soft, slightly crumbly, mold-ripened, bloomy-rind cheese made in the Neufchâtel-en-Bray region of Normandy. |
| Flexitarian | It refers to a consumer preferring a semi-vegetarian diet, that is centered on plant foods with limited or occasional inclusion of meat. |
| Lactose Intolerance | Lactose intolerance is a reaction in digestive system to lactose, the sugar in milk. It causes uncomfortable symptoms in response to the consumption of dairy products. |
| Cream Cheese | Cream cheese is a soft and creamy fresh cheese with a tangy taste made from milk and cream. |
| Sorbets | Sorbet is a frozen dessert made using ice combined with fruit juice, fruit purée, or other ingredients, such as wine, liqueur, or honey. |
| Sherbet | Sherbet is a sweetened frozen dessert made with fruit and some sort of dairy product such as milk or cream. |
| Shelf stable | Foods that can be safely stored at room temperature, or "on the shelf," for at least one year and do not have to be cooked or refrigerated to eat safely. |
| DSD | Direct Store Delivery is the process in supply chain management wherein the product is delivered from manufacturing plant directly to the retailer. |
| OU Kosher | Orthodox Union Kosher is a kosher certification agency based in New York City. |
| Gelato | Gelato is a frozen creamy dessert made with milk, heavy cream and sugar. |
| Grass-fed Cows | Grass-fed cows are allowed to graze in pastures, where they eat a variety of grasses and clover. |


Research Methodology
Mordor Intelligence follows a four-step methodology in all our reports.
- Step-1: Identify Key Variables: In order to build a robust forecasting methodology, the variables and factors identified in Step 1 are tested against available historical market numbers. Through an iterative process, the variables required for market forecast are set, and the model is built on the basis of these variables.
- Step-2: Build a Market Model: Market-size estimations for the forecast years are in nominal terms. Inflation is not a part of the pricing, and the average selling price (ASP) is kept constant throughout the forecast period for each country.
- Step-3: Validate and Finalize: In this important step, all market numbers, variables, and analyst calls are validated through an extensive network of primary research experts from the market studied. The respondents are selected across levels and functions to generate a holistic picture of the market studied.
- Step-4: Research Outputs: Syndicated Reports, Custom Consulting Assignments, Databases & Subscription Platforms


