
Metal Working Fluids Market Size and Share
Market Overview
| Study Period | 2020 - 2031 |
|---|---|
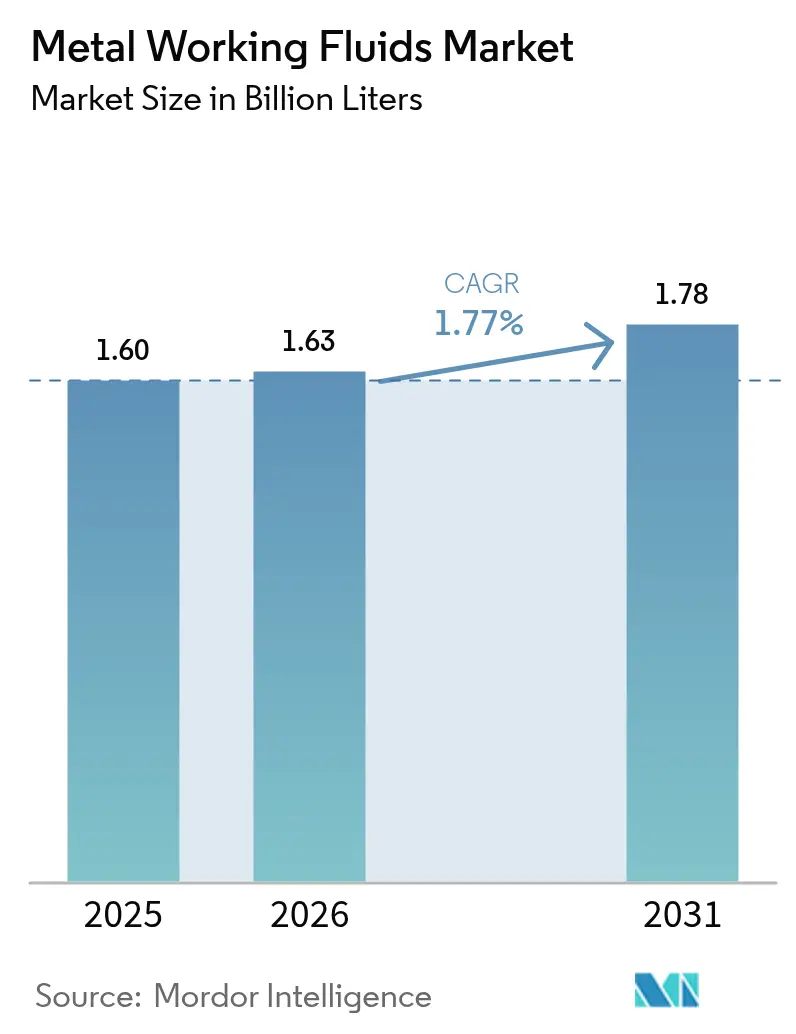
| Market Volume (2026) | 1.63 Billion liters |
| Market Volume (2031) | 1.78 Billion liters |
| Growth Rate (2026 - 2031) | 1.77 % |
| Fastest Growing Market | Asia Pacific |
| Largest Market | Asia Pacific |
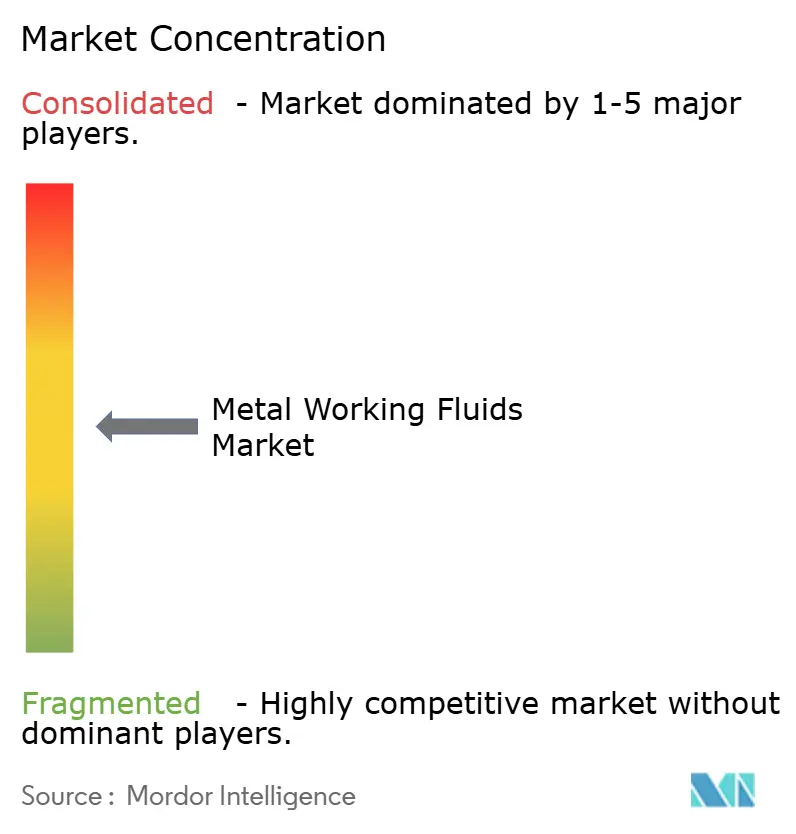
| Market Concentration | Medium |
Major Players *Disclaimer: Major Players sorted in no particular order Image © Mordor Intelligence. Reuse requires attribution under CC BY 4.0. | |
Metal Working Fluids Market Analysis by Mordor Intelligence
The Metal Working Fluids market size is expected to grow from 1.60 billion liters in 2025 to 1.63 billion liters in 2026 and is forecast to reach 1.78 billion liters by 2031 at 1.77% CAGR over 2026-2031. Momentum comes from precision‐machining growth in electric-vehicle battery housings, deeper aerospace backlogs, and digital factory investments that reward fluids with longer service life. Yet, tightening global PFAS restrictions and gradually adopting dry machining temper volume expansion. Ongoing base-oil supply volatility pushes formulators toward synthetic and bio-based alternatives that insulate margins while meeting tight tolerance requirements. Competitive intensity has shifted toward sustainability credentials and IIoT-enabled service models, redefining how suppliers capture share in the metalworking fluids market.
Key Report Takeaways
- By product type, removal fluids led with 51.48% of the metal working fluids market share in 2025; forming fluids are projected to post a 2.04% CAGR through 2031.
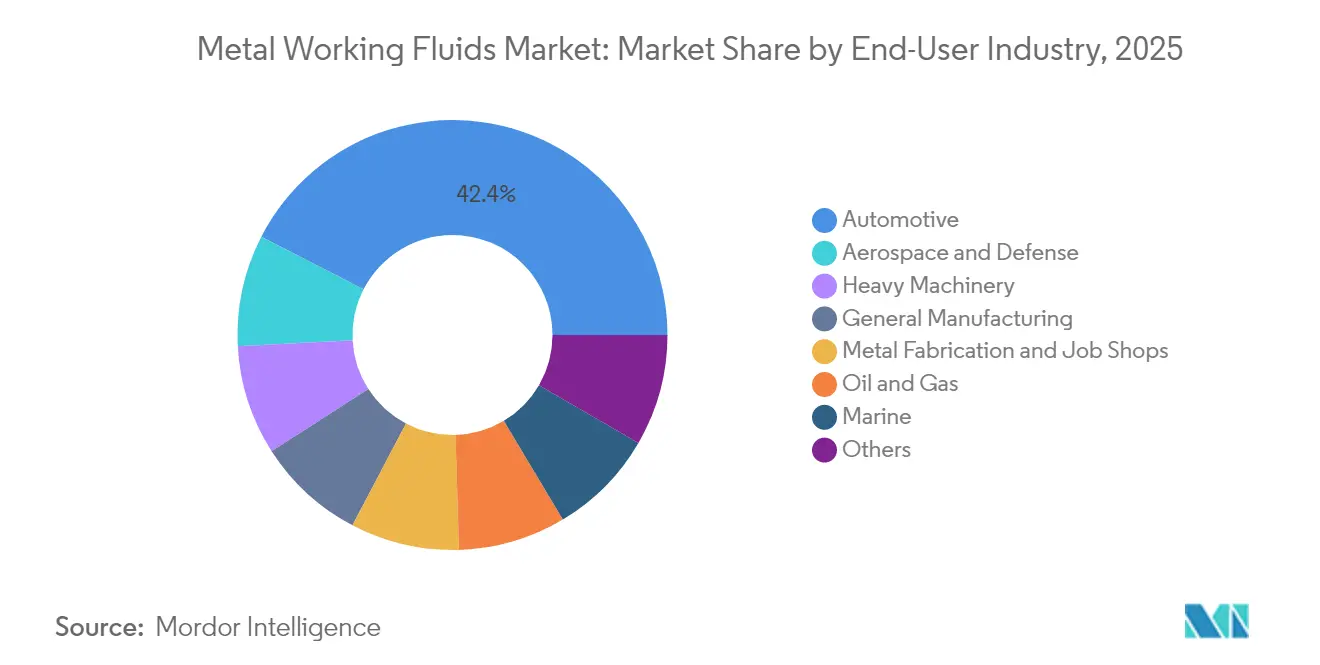
- By end user, automotive applications accounted for 42.44% of the metal working fluids market size in 2025, while aerospace and defense record the highest 2.22% CAGR to 2031.
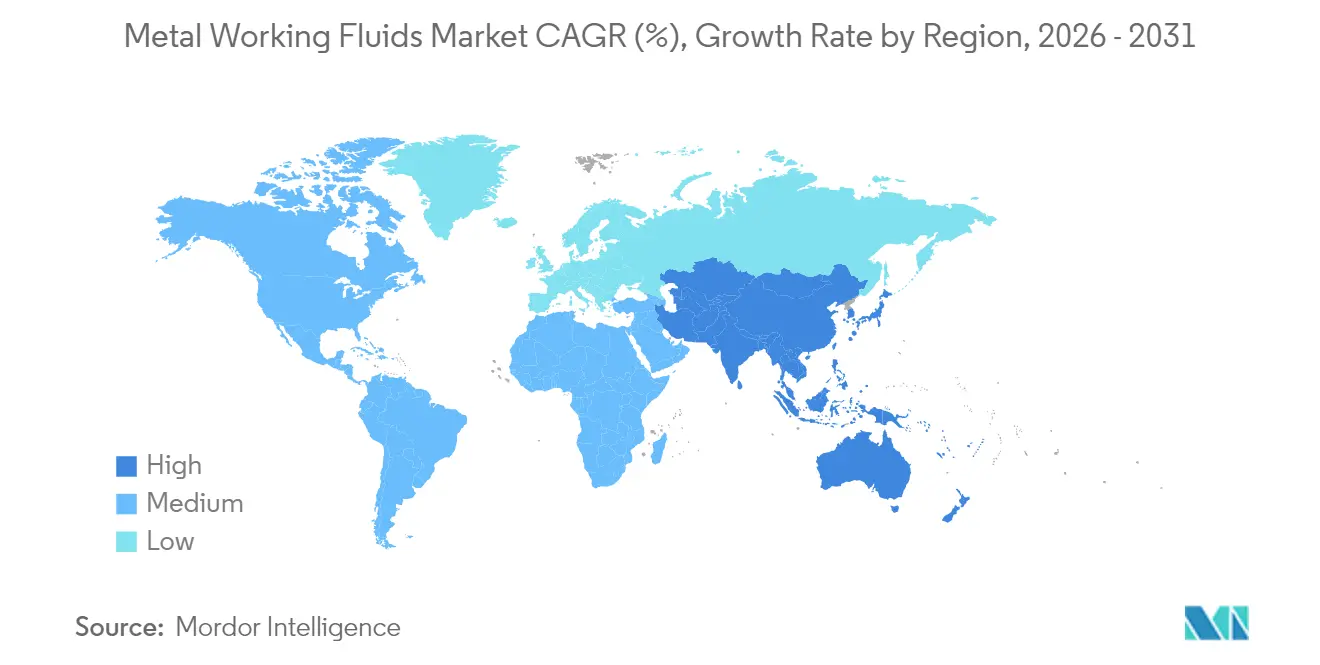
- By geography, Asia-Pacific held 47.70% revenue share in 2025 and is advancing at a 2.12% CAGR through 2031.
Note: Market size and forecast figures in this report are generated using Mordor Intelligence’s proprietary estimation framework, updated with the latest available data and insights as of 2026.
Market Trends and Insights
Drivers Impact Analysis of Metal Working Fluids Market*
| Driver | (~) % Impact on CAGR Forecast | Geographic Relevance | Impact Timeline |
|---|---|---|---|
| Automotive precision machining | +0.30% | APAC & Europe | Medium term (2-4 years) |
| Global aerospace component output | +0.40% | North America & Europe | Long term (≥ 4 years) |
| EV battery-housing re-tooling | +0.20% | China, Europe, U.S. | Short term (≤ 2 years) |
| IIoT-enabled fluid monitoring | +0.30% | APAC core, spill-over US | Medium term (2-4 years) |
| Oil-and-gas drilling tool resurgence | +0.20% | Middle East & U.S. | Medium term (2-4 years) |
| Source: Mordor Intelligence | |||
Growing Demand from Automotive Precision Machining
Electric-vehicle platforms require tight dimensional tolerances in battery housings, motor shafts, and structural aluminum castings. Leading plants in Shanghai, Berlin, and Austin have installed high-pressure die-casting cells that depend on synthetic or semi-synthetic fluids to prevent die soldering and maintain surface integrity. Formulators able to deliver PFAS-free additives with robust lubricity are winning long-term supply contracts as OEMs ramp integrated gigacasting lines. Parallel demand emerges from drivetrain downsizing in hybrids, where higher spindle speeds intensify thermal management requirements. Automotive fluid consumption, therefore, stays elevated even as internal-combustion engine block machining plateaus, supporting steady volume for the metal working fluids market.
Rapid Expansion of Global Aerospace Component Output
Airbus and Boeing project combined deliveries close to 1,550 aircraft in 2025, versus 1,263 in 2024, driving sustained titanium and nickel-alloy machining. These alloys demand high-flash-point synthetics with advanced extreme-pressure (EP) packages that manage chip adhesion and tool wear. Aerospace primes require supplier traceability and REACH compliance that few regional blenders can meet, reinforcing share for global incumbents. Defense programs like Europe’s Future Combat Air System and Japan’s fighter replacement add an additional layer of demand. Consequently, premium-priced neo-synthetic fluids climb faster than base-grade emulsions, lifting overall value in the metal working fluids market[1]Master Fluid Solutions, “The Comprehensive Guide to Metalworking Fluid (MWF),” masterfluids.com .
Re-tooling Boom for EV Battery-Housing Fabrication
Aluminum-intensive battery enclosures combine extrusion, stamping, and multi-axis milling, creating hybrid toolpaths where one fluid must cover removal and forming. Chinese battery giants CATL and BYD have accelerated capex schedules, producing immediate spikes in synthetic base-stock orders. Supply chain stresses surfaced in 2024 when additive lead times tripled after unplanned outages at two Group II plants. Suppliers respond by localizing blending capacity near Ningde, Chungbuk, and Michigan battery corridors. The demand surge supports the 2.14% CAGR expected for forming fluids within the metal working fluids market.
Rising Adoption of IIoT-Enabled Fluid Monitoring
Connected sump sensors now track pH, concentration, and tramp-oil levels in real time, integrating with MES dashboards to trigger automated top-off. Plants deploying these kits report 18% lower fluid consumption and 27% longer tool life, savings that offset higher per-liter fluid prices. Supplier value propositions shift toward subscription-based analytics platforms bundled with premium chemistries. Larger blenders are partnering with sensor integrators to lock in multi-year service agreements, reinforcing stickiness in the metal working fluids market[2]EVS Metal, “Factors Shaping the Metal Fabrication Industry in 2025 and Beyond,” evsmetal.com .
Restraints Impact Analysis of Metal Working Fluids Market*
| Restraint | (~) % Impact on CAGR Forecast | Geographic Relevance | Impact Timeline |
|---|---|---|---|
| Shift to dry & near-dry machining | -0.40% | Europe & U.S. | Long term (≥ 4 years) |
| Tightening VOC & biocide rules | -0.30% | Europe & U.S. | Medium term (2-4 years) |
| Group I/II base-oil price volatility | -0.20% | APAC | Short term (≤ 2 years) |
| Disposal costs tied to microbial contamination | -0.20% | Developed markets | Medium term (2-4 years) |
| Source: Mordor Intelligence | |||
Shift Toward Dry and Near-Dry Machining Processes
Minimum-quantity lubrication (MQL) delivers atomized oil at 50 ml/h, compared with 50 L/min in flood systems. Laboratory trials on 7075-T6 aluminum achieved 20% longer tool life and superior Ra values, debunking myths that MQL underperforms in light metals. Automotive plants in Germany now run MQL on crankshaft lines, cutting coolant disposal volumes by 88%. As carbide-coated tools and adaptive controls mature, dry machining can cover a wider work-piece palette, removing liters from the metal working fluids market.
Tightening Global VOC and Biocide Regulations
The European Chemicals Agency targets a full PFAS phase-out between 2026 and 2032. Germany already classifies select fluorinated surfactants as “substances of very high concern,” exposing violators to criminal penalties. U.S. Environmental Protection Agency draft rules would limit VOC emissions from metalworking fluid mist collectors, forcing plant upgrades. Reformulation costs amplify for small blenders lacking R&D budgets, likely accelerating industry consolidation as compliance deadlines near.
*Our forecasts treat driver/restraint impacts as directional, not additive. The impact forecasts reflect baseline growth, mix effects, and variable interactions.
Metal Working Fluids Market Segment Analysis
By Product Type:
Forming Fluids Gain Momentum in Precision FabricationRemoval fluids retained 51.48% metal working fluids market share in 2025. Their wide applicability in turning, drilling, and grinding across steel and aluminum explains sustained dominance. Yet forming fluids, with a smaller 2025 base, register a 2.04% CAGR to 2031—the fastest among product types—reflecting growth in EV battery casings and aerospace stretch-forming. Within removal fluids, high-performance semi-synthetics capture incremental value as plants prioritize extended sump life and lower mist. Protection and treating fluids remain niche but indispensable for naval and heat-treat furnaces where corrosion inhibition and quench integrity matter. Bio-derived esters enter both removal and forming categories, offering 15% lower coefficient of friction while meeting biodegradability targets. Synthetic chemistries command premium pricing where downtime avoidance outweighs per-liter cost, reinforcing overall revenue resilience for the metal working fluids market.
Advances in additive technology now blend boron-free corrosion inhibitors with polymeric EP agents, making non-chlorinated fluids competitive in heavy cutting. Formulators also integrate nanodiamond particles to improve heat transfer in deep-hole drilling. Hybrid emulsions suited to both stamping and subsequent machining improve inventory efficiency at tier-one suppliers. Regional shifts are evident: Asia-Pacific consumes majority of global forming volume as Chinese and Korean battery factories scale output.




By End-User Industry:
Aerospace Surpasses Historical AveragesAutomotive maintained 42.44% of the metal working fluids market size in 2025 but faces a plateau as internal-combustion engine blocks decline. Electro-mobility, however, sustains fluid demand via aluminum machining, offsetting part of the volume loss. Heavy machinery and general manufacturing collectively deliver baseline stability. Aerospace and defense rise at a 2.22% CAGR, supported by long-cycle jet and missile programs that prefer premium synthetics with traceable formulations. Job shops and metal fabricators benefit from reshoring in the U.S. and subsidy-driven expansions in India, requiring versatile coolants that handle mixed-metal batches without residue.
Marine applications, though smaller share, are growing because alternative-fuel vessel construction often mandates stainless-steel and nickel-alloy machining. Oil-and-gas component recovery remains cyclical; yet, higher rig counts in Texas and Saudi Arabia help stabilize demand for high-chlorine EP fluids that withstand down-hole temperatures. Across all sectors, IIoT-enabled fluid management propagates, boosting attachment rates for service contracts that raise dollar realization per liter. Consequently, unit margins expand even if absolute volume in the metal working fluids market grows only modestly.
Geography Analysis
APAC Metal Working Fluids Market
Asia-Pacific hosts nearly half of all machining centers installed since 2023, underpinning its 47.70% share of the metal working fluids market. The region’s CAGR of 2.12% through 2031 outpaces the global average, driven by Chinese battery manufacturing and Indian aerospace offsets. Supply chains cluster near coastal industrial zones, lowering transport costs for bulk fluids. Government incentives for smart manufacturing in South Korea and Singapore add upside for IIoT-integrated formulations. Japan’s precision-grinding culture sustains demand for ultra-low-sulfur synthetics, reinforcing the premium end of the spectrum.
North America and Europe Metal Working Fluids Market
North America holds a significant share and benefits from defense spending and ongoing shale gas investment. Regional EV assembly shifts to the Midwest require localized blending plants to reduce logistics emissions. Tight OSHA limits on mist exposure create steady pull for low-VOC products, nudging the metal working fluids market toward semi-synthetics. Europe faces the stiffest regulatory headwinds, especially around PFAS bans. Formulators there accelerate development of bio-based EP packages to preempt compliance risks. German and Italian machine-tool builders collaborate with lubricant suppliers to optimize toolpath and coolant packages, sustaining innovation.
South America and MEA Metal Working Fluids Market
South America and Middle East & Africa together comprise smaller share of global liters, with Brazil’s agricultural machinery and Saudi fabrication yards as key demand nodes. Political risk and currency volatility challenge pricing strategies, yet infrastructure build-outs anchor baseline consumption. Regional blenders leverage flexible toll-manufacturing to hedge against import freight spikes, protecting local supply resilience in the metal working fluids market.

Regulatory Landscape
Metal working fluids are shaped by chemical restrictions, worker-exposure limits, and regional air-quality rules that influence additive selection and mist-control practices. In the European Union, the European Chemicals Agency (ECHA) and the European Commission are tightening requirements under REACH, including a May 2026 update to REACH Annex XVII that restricts certain metalworking-fluid additives (including DMF, TEA, and select alkylphenol ethoxylates) with an effective date of 1 January 2027. The European Commission also issued Regulation (EU) 2026/1192 in June 2026 to cap nickel release from metalworking cutting fluids (effective 1 October 2026), which increases the need for validated test methods and supplier documentation for EU market access.
In the United States, compliance is split across federal and local requirements. OSHA maintains exposure limits for mineral oil mist (29 CFR 1910.1000), while NIOSH recommends lower aerosol exposure targets for metalworking fluids, which encourages end users to invest in improved ventilation, mist collection, and lower-mist formulations. EPA rules include 40 CFR Part 747, which restricts the use of certain nitrosating agents in metalworking-fluid chemistry, and state-level or regional air regulators set VOC constraints; for example, California South Coast AQMD Rule 1144 sets VOC limits for metalworking fluids and direct-contact lubricants used in industrial metal removal and forming operations.
Value Chain Analysis
The metal working fluids value chain begins with upstream suppliers of base oils (mineral and synthetic), functional additives (EP/anti-wear agents, corrosion inhibitors, surfactants, defoamers), and biocides/preservatives used to control microbial growth in water-miscible systems. Formulators and blenders convert these inputs into removal, forming, protection, and treating fluids, which are then delivered through direct OEM/Tier supply and specialty distribution to end users across automotive, aerospace and defense, heavy machinery, and job shops. Distribution and technical service are linked in this market, because on-site fluid management (concentration control, contamination mitigation, and disposal management) affects total cost of ownership and supplier retention.
Recent partnership activity shows how suppliers are strengthening regional access and service coverage across the chain. In April 2025, Quaker Houghton established strategic partnerships with PETRONAS Lubricants International (for Malaysia and India) and with Idemitsu Kosan (for Japan) to expand industrial processing fluids reach and local portfolios, reinforcing the role of in-country channels and application support. On the additives and preservation side, LANXESS expanded its distribution partnership with Palmer Holland in February 2024 to cover metalworking-fluid preservatives across North America, supporting formulators and end users focused on sump-life stability. Regulatory divergence across regions (for example, EU REACH versus US EPA/OSHA and regional VOC rules) also increases the need for localized compliant SKUs, documentation, and periodic reformulation, putting specialty additive availability and qualified distribution networks at the center of competition.
Competitive Landscape
The marketplace remains moderately fragmented. Quaker Houghton, FUCHS, Shell, and BP captured a significant share of global volume in 2024, leaving a sizable opportunity for regional specialists. Quaker Houghton’s USD 153 million Dipsol acquisition expands presence in Japanese automotive machining and electro-plating, adding synergy for multi-process fluid packages. FUCHS posted record EBIT in 2024 and earmarked USD 100 million annually for sustainable chemistries, including PFAS-free surfactants and bio-derived esters. Shell pursues circular-economy credentials, reclaiming used coolant for base-oil regeneration at its Rotterdam plant.
Digital-service platforms differentiate leading suppliers. Condition-monitoring dashboards paired with automatic replenishment reduce unplanned downtime, deepening customer lock-in. Smaller blenders counter by emphasizing formulation agility and fast turnaround on customized batches for niche alloys. Patent filings show rising interest in nanomaterial dispersions and multifunctional anti-wear chemistry, pointing to intensifying R&D races. Rising compliance costs may prompt further consolidation as sub-scale players weigh exit options versus investment in testing labs. Innovation, regulatory agility, and data-driven service models govern future positioning in the metalworking fluids market.
Metal Working Fluids Industry Leaders
BP p.l.c.
Exxon Mobil Corporation
FUCHS
Quaker Chemical Corporation d/b/a Quaker Houghton
TotalEnergies
- *Disclaimer: Major Players sorted in no particular order
Metal Working Fluids Market Companies Covered in this Report
- Blaser Swisslube
- BP p.l.c.
- Carl Bechem Lubricants India Private Limited
- Chevron Corporation
- ENEOS Corporation
- Exxon Mobil Corporation
- FUCHS
- Hindustan Petroleum Corporation Limited
- Idemitsu Kosan Co.,Ltd.
- Indian Oil Corporation Ltd
- Kemipex
- LANXESS
- Master Fluid Solutions
- Motul
- Oelheld GmbH
- PETRONAS Lubricants International
- Quaker Chemical Corporation d/b/a Quaker Houghton
- Saudi Arabian Oil Co.
- Shell plc
- SKF
- TotalEnergies
- YUSHIRO Inc.

Market Opportunities and Future Outlook
A major opportunity is the accelerated reformulation and qualification cycle driven by European REACH and related chemical restrictions, which shifts demand toward PFAS-free and lower-hazard additive systems, validated nickel-release performance, and more transparent product stewardship. The May 2026 ECHA update to REACH Annex XVII (effective 1 January 2027) and the European Commission Regulation (EU) 2026/1192 (effective 1 October 2026) create immediate whitespace for suppliers that can provide compliant water-miscible coolants and corrosion-inhibitor packages with robust documentation and third-party test support. This favors global and well-capitalized formulators with established aerospace and automotive qualification capabilities, where traceability and specification compliance already function as purchase criteria.
Another opportunity focuses on digitized fluid management as factories seek lower fluid consumption, longer sump life, and reduced disposal costs without changing machining outcomes. Quaker Houghton expanded its QH Fluid Intelligence offering in January 2026 with new Fluidcontrol and Fluidmonitor hardware, reflecting customer uptake of connected monitoring and automated replenishment. Pairing premium chemistry with IIoT-enabled monitoring and on-site service supports differentiated, contract-based offerings, particularly in high-throughput machining for EV aluminum components and in aerospace alloy machining where downtime and scrap avoidance are closely tied to operating margins.
Recent Industry Developments in Metal Working Fluids Market
- April 2026: FUCHS hosted a Capital Markets Day in Mannheim, announcing a multi-year program to accelerate sustainable product development and regulatory-compliant metalworking fluids through 2031. The program reinforces FUCHS focus on scalable, low-VOC chemistries and expanded global manufacturing capabilities to meet tightening additive restrictions.
- October 2025: Quaker Houghton reported global approvals for its HOCUT 4260 metalworking fluid from Airbus (AIPS00-00-010) and BAE Systems (BAE AMS AM00-00-01). These approvals strengthen its standing in aerospace and defense machining, where qualification lists can narrow supplier choices and raise switching costs.
- June 2024: Master Fluid Solutions launched TRIM SC417, a semi-synthetic coolant designed for ferrous cutting and grinding with low-foam performance and rust protection. The product expansion targets job shops and OEM lines seeking broader operating windows across water qualities while maintaining corrosion control.


Metal Working Fluids Market Report Scope and Research Methodology
Market Definition and Coverage
This market is measured as the demand for fluids used during metal cutting, grinding, forming, treating, and short-term corrosion protection in industrial manufacturing, counted in liters across key end-use industries and regions.
Scope exclusions: Long-life in-service lubricants such as engine oils, hydraulic oils, and gear oils are excluded unless they are sold and used specifically as metal working fluids.
Segments Covered in This Report
- By Product Type
- Removal Fluids
- Forming Fluids
- Protection Fluids
- Treating Fluids
- By End-User Industry
- Automotive
- Heavy Machinery
- General Manufacturing
- Metal Fabrication and Job Shops
- Aerospace and Defense
- Marine
- Oil and Gas
- Others
- By Geography
- Asia-Pacific
- China
- India
- Japan
- South Korea
- Malaysia
- Thailand
- Indonesia
- Vietnam
- Rest of Asia-Pacific
- North America
- United States
- Canada
- Mexico
- Europe
- Germany
- United Kingdom
- France
- Italy
- Spain
- Nordic Countries
- Russia
- Rest of Europe
- South America
- Brazil
- Argentina
- Colombia
- Rest of South America
- Middle-East and Africa
- Saudi Arabia
- United Arab Emirates
- Qatar
- Turkey
- Nigeria
- Egypt
- South Africa
- Rest of Middle-East and Africa
- Asia-Pacific
Data Sources, Market Sizing, and Validation
Desk Research
Desk research was used to build a realistic demand map for where machining and forming activity is happening, and to understand what fluid families are commonly used in each process. For this, we leaned on public manufacturing indicators and trade signals, such as UN Comtrade import and export statistics, industrial production series from sources like the World Bank and OECD, and manufacturing outlook notes from central banks and national statistical offices.
We also reviewed technical and regulatory context that can change product mix and replacement rates. Sources included OSHA and EPA updates for industrial exposure and handling requirements, ECHA publications for chemical controls, and peer-reviewed journals on coolant performance, mist exposure, and bio-stability. Company annual reports, product technical data sheets, investor presentations, and reputable press were used to cross-check reported capacity moves, plant expansions, and formulation shifts. Where needed, paid subscriptions for company financials, patents, and shipment-level trade checks were used to validate directional trends. These are illustrative examples, and many other public and paid sources were also used for data collection, validation, and research clarification.
Primary Interviews and Surveys
Primary work focused on confirming how often fluids are replaced, what concentration ranges are typical for water-mix products, and how procurement teams react to price changes and compliance requirements. We spoke with a mix of formulators, distributors, and large end users, and we kept respondent coverage across major manufacturing hubs so assumptions from desk research could be corrected where local practice differs.
Distribution of primary research fieldwork respondents
Distribution of primary research fieldwork respondents
| Company type | Respondent position | Region |
|---|---|---|
| Top tier: 39% | CXOs: 18% | APAC: 49% |
| Mid tier: 40% | Functional/Unit leaders: 30% | EMEA: 33% |
| Smaller Players: 21% | Managers: 52% | Americas: 18% |
Market-Sizing & Forecasting
Sizing was built using a top-down demand pool that reconstructs metal working fluid consumption from manufacturing output and metalworking intensity, and then converts that activity into liters through process-level usage factors. To keep the model grounded, we corroborated totals with selective bottom-up checks, including sampled supplier volume disclosures, distributor channel checks, and typical liters-per-unit relationships in high-volume machining categories.
Key inputs in the model included industrial production trends in machining-heavy sectors, vehicle and machinery build cycles, shifts in the share of CNC and precision machining, average sump sizes and changeout frequency, and dilution and concentration practices for water-miscible fluids. We also tracked mix changes between removal, forming, protection, and treating fluids because they behave differently in usage and replacement. For forecasting, scenario analysis was applied around manufacturing growth, regulation-driven reformulation, and adoption of longer-life synthetics, and the final path was aligned to what primary respondents described as the most likely operating case. Where bottom-up signals were incomplete for smaller geographies, gap handling relied on proxy intensity ratios tied to manufacturing output and known end-use splits, followed by a reasonableness check against trade and production indicators.
Data Validation & Update Cycle
Outputs were checked against independent signals, including trade direction, industrial production momentum, and consistency of per-process consumption rates across similar manufacturing clusters. Any sharp year-on-year changes triggered a step-back review of underlying variables (such as replacement rates or dilution assumptions), and clarifications were re-confirmed through follow-up outreach when needed.
Before sign-off, the model goes through a multi-step internal review so arithmetic, unit conversions, and segment rollups stay consistent. The report is refreshed annually, and interim updates are made when material events occur, such as regulatory shifts affecting formulation, major capacity changes, or broad manufacturing slowdowns. Right before delivery, analysts perform a final refresh pass so the published view reflects the latest available signals.
Mordor Intelligence's Metal Working Fluids Market Estimate Compared With Other Published Estimates
Published market sizes for metal working fluids often differ because some studies report value while others report volume, and they also choose different assumptions for dilution, replacement cycles, and what counts as a metalworking application. Differences in exchange-rate timing and the month of price snapshots can add another layer of spread when a USD figure is being discussed.
In the refresh cycle, the key inputs that move the total, such as average selling price progression by fluid family, currency conversion timing, and a set of sanity checks using manufacturing output signals, are re-tested before each annual update. This is one reason the volume-based totals on the Mordor Intelligence page can look far apart from value-based publications.
Benchmark comparison
| Source | Market Size | Gaps in Research Methodology |
|---|---|---|
| Mordor Intelligence | USD 1.60 B (2025) | |
| Industry Publisher A | USD 12.50 B (2024) | Reports market value in USD, which folds in ASP assumptions and currency conversion, while the baseline figure is published as liters, so the totals are not like-for-like. |
| Global Publisher B | USD 7.10 B (2024) | Uses a value model with its own price deck and base-year framing, and may apply different dilution and replacement-rate assumptions that change implied liters even when end-use activity is similar. |
The table mainly shows a unit and pricing boundary issue rather than a true disagreement on underlying manufacturing demand. By keeping the sizing anchored to reproducible usage drivers and then validating assumptions during each refresh, the estimate stays traceable to clear consumption logic, even when external USD numbers move with price and currency choices.


Key Questions Answered in the Report
What is the forecast volume for global metal working fluids in 2031?
The metal working fluids market is projected to reach 1.78 billion liters by 2031, reflecting a 1.77% CAGR from 2026.
Which region grows fastest in fluid consumption through 2031?
Asia-Pacific posts the fastest 2.12% CAGR thanks to large-scale battery housing and precision electronics manufacturing.
Which product category expands quickest?
Forming fluids record a 2.04% CAGR as EV and aerospace components require complex geometries.
How will PFAS regulations affect suppliers?
European PFAS bans starting 2026 force costly reformulations that favor suppliers with strong R&D and compliance resources.
What role does IIoT play in fluid management?
Connected monitoring lowers unplanned downtime and extends sump life, supporting premium pricing for smart-compatible fluids.
Page last updated on:


 Your data is secure and never sold or shared.


