
Metal Finishing Chemical Market Size and Share
Market Overview
| Study Period | 2020 - 2031 |
|---|---|
| Market Size (2026) | USD 13.53 Billion |
| Market Size (2031) | USD 17.08 Billion |
| Growth Rate (2026 - 2031) | 4.76 % |
| Fastest Growing Market | Asia Pacific |
| Largest Market | Asia Pacific |
| Market Concentration | High |
Major Players *Disclaimer: Major Players sorted in no particular order Image © Mordor Intelligence. Reuse requires attribution under CC BY 4.0. | |
Metal Finishing Chemical Market Analysis by Mordor Intelligence
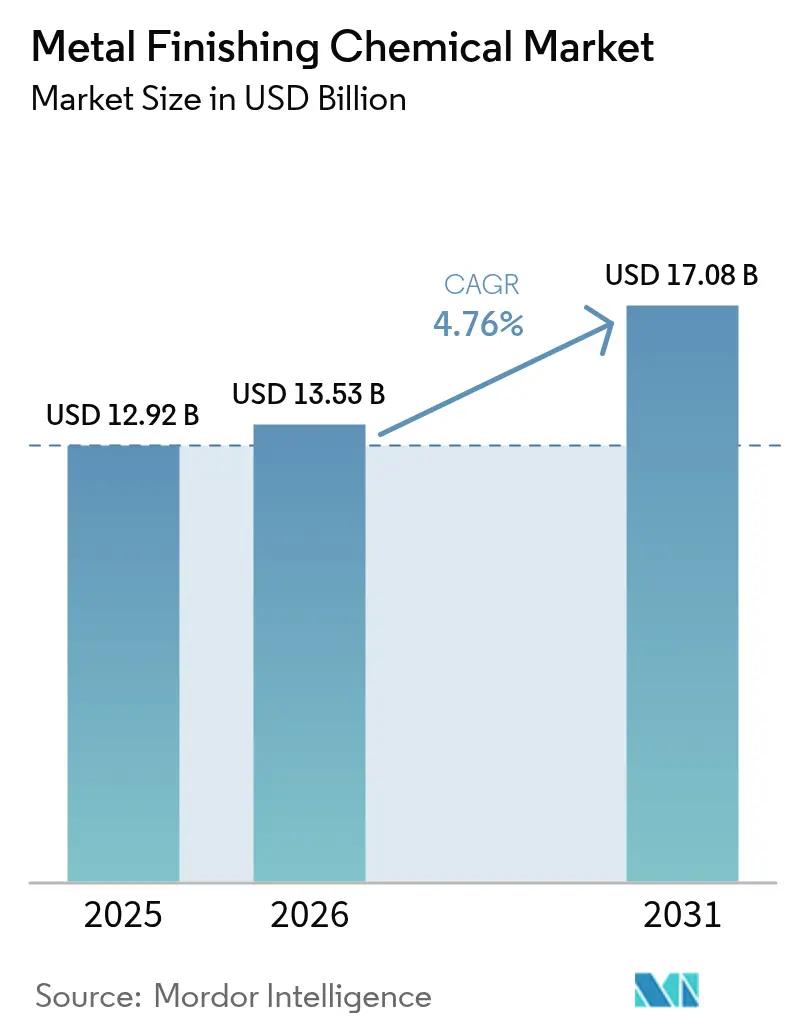
metal finishing chemical market size in 2026 is estimated at USD 13.53 billion, growing from 2025 value of USD 12.92 billion with 2031 projections showing USD 17.08 billion, growing at 4.76% CAGR over 2026-2031. The metal finishing chemical market is expanding because advanced plating, anodizing, and conversion-coat chemistries enable precision that mechanical finishing cannot match. Growth pivots on four themes: electric-vehicle lightweighting that favors aluminum-intensive architectures, electronics miniaturization requiring sub-micrometer deposit control, aerospace mandates that shift chemistries away from PFAS and hexavalent chromium, and reshoring programs that shorten supply chains for surface-treatment consumables.
Key Report Takeaways
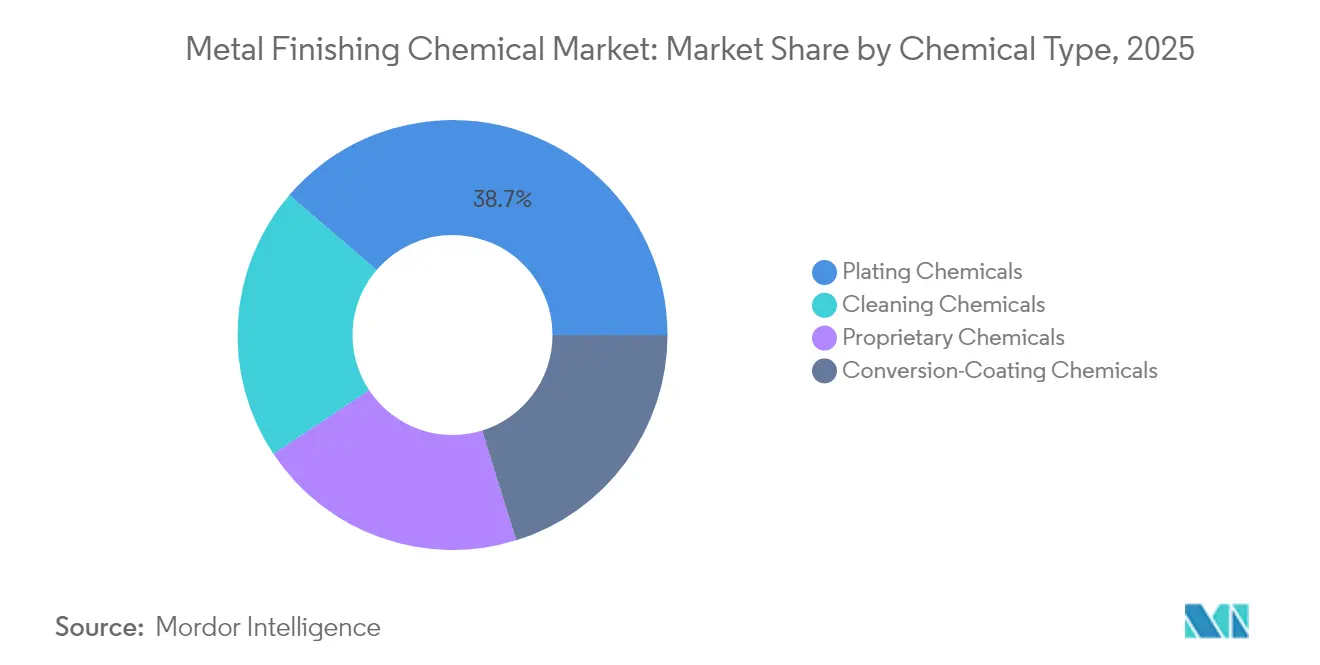
- By chemical type, plating chemicals led with 38.72% of the metal finishing chemical market share in 2025; cleaning chemicals are projected to grow at a 5.93% CAGR to 2031.
- By material, aluminum processing accounted for a 30.86% share of the metal finishing chemical market size in 2025, while nickel is set to expand at 6.09% between 2026-2031.
- By process, electroplating held 41.59% of the metal finishing chemical market in 2025 and is forecast to rise at a 6.74% CAGR through 2031.
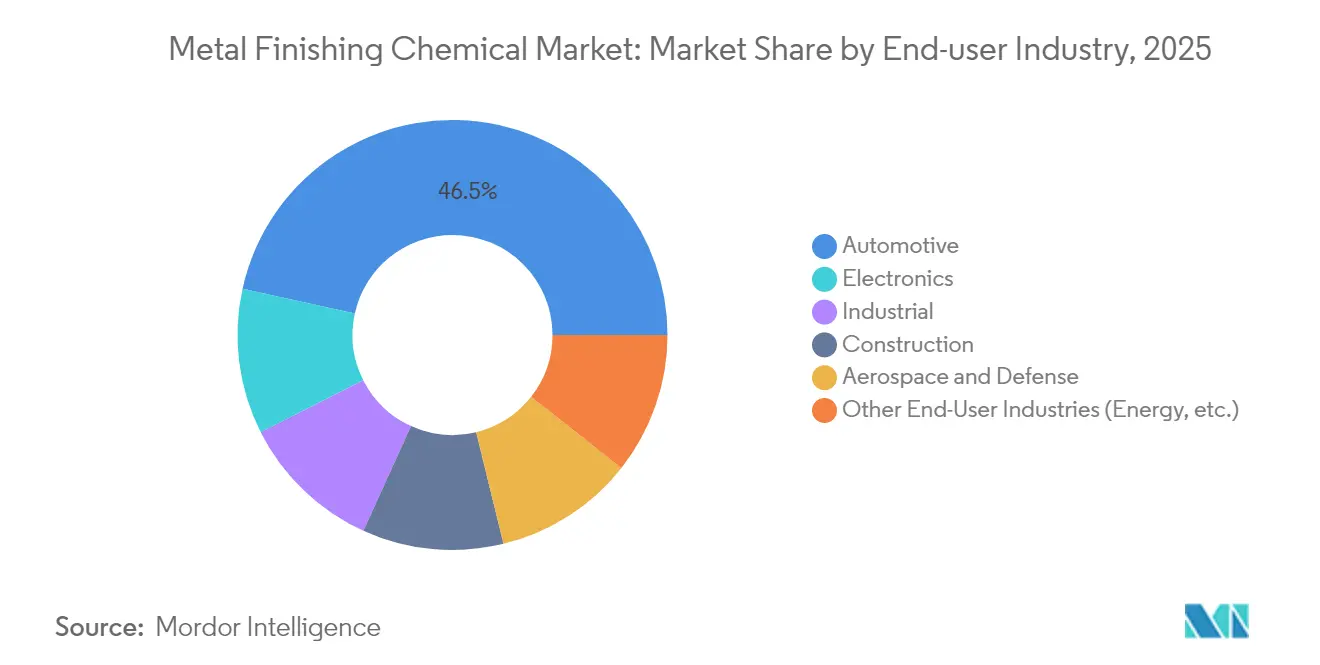
- By end-user, automotive dominated with 46.54% revenue share in 2025; electronics is the fastest-growing segment at 6.45% CAGR.
- By geography, Asia-Pacific captured 53.08% of the metal finishing chemical market in 2025 and is advancing at a 6.78% CAGR to 2031.
Note: Market size and forecast figures in this report are generated using Mordor Intelligence’s proprietary estimation framework, updated with the latest available data and insights as of 2026.
Market Trends and Insights
Drivers Impact Analysis of Metal Finishing Chemical Market*
| Drivers | (~) % Impact on CAGR Forecast | Geographic Relevance | Impact Timeline |
|---|---|---|---|
| EV lightweighting shifts need higher-performance plating chemistries | +1.2% | Global, with a concentration in China, Europe, and North America | Medium term (2-4 years) |
| Electronics miniaturization requires ultra-thin deposit accuracy | +0.9% | APAC core, spill-over to North America | Short term (≤ 2 years) |
| Aerospace OEM PFAS-free mandates accelerate conversion-coat demand | +0.7% | North America and the EU, expanding to global aerospace hubs | Long term (≥ 4 years) |
| Reshoring of metal parts boosts localized chemical demand | +0.5% | North America, with selective European markets | Medium term (2-4 years) |
| Green hydrogen electrolyzer build-out needs specialty nickel baths | +0.4% | EU leading, followed by North America and APAC | Long term (≥ 4 years) |
| Source: Mordor Intelligence | |||
EV Lightweighting Shifts Needing Higher-Performance Plating Chemistries
Electric-vehicle platforms rely on aluminum and mixed-metal architectures that demand corrosion-resistant conversion coats capable of bonding to recycled alloys. Honda’s USD 15 billion Canadian EV complex and BMW’s battery expansion in Mexico illustrate production realignment that lifts regional chemical demand. Specialized anodizing systems maintain coating integrity on secondary aluminum while complying with weight-reduction goals. At the same time, composite housings such as ARRK Group’s carbon-fiber gearbox shells displace some metal parts, yet hybrid metal-composite interfaces still require niche plating chemistries to mitigate galvanic risk. Continuous model refresh cycles through 2030 support sustained uptake of premium plating formulations, positioning the metal finishing chemical market for steady volume and margin expansion.
Electronics Miniaturization Requiring Ultra-Thin Deposit Accuracy
Shrinking semiconductor nodes have moved interconnect pitches below 10 µm, pushing electroplating baths to deliver sub-100 nm uniformity across wafers. Horizontal wafer-level systems improve through-silicon-via filling, while pulse plating cuts void formation. Cobalt replaces copper in some layers for better electromigration resistance, demanding new additives that stabilize bath chemistry. AI-enabled sensors feed machine-learning models to predict thickness deviations in real time, cutting scrap and reagent use. Fab capital outlays track node migrations, so each lithography transition injects new demand into the metal finishing chemical market for high-purity additives and real-time control packages.
Aerospace OEM PFAS-Free Mandates Accelerate Conversion-Coat Demand
Aerospace primes have moved to eliminate hexavalent chromium and PFAS across airframes. The F-35 program’s switch to chrome-free primers set a precedent for other fleets. Oerlikon’s Balinit C PVD coating gained Airbus approval as a hard-chrome alternative, demonstrating that multi-layer vapor coatings can meet adhesion and fatigue requirements. Fluorozirconate-based anodizing passes 3,000-hour salt-spray tests, validating performance while lowering hazardous-waste costs. Certification cycles are lengthy, but once approved, the chemistries displace legacy baths fleet-wide, adding durable revenue to the metal finishing chemical market.
Reshoring of Metal Parts Boosts Localized Chemical Demand
North American reshoring accelerates as OEMs trade cost for resilience; Metal Solutions Holdings is aggregating 2,000 fabricators to supply local aerospace and defense programs. The U.S. Department of Defense funds finishing-sector upskilling, signaling policy support for domestic capacity. Shorter logistics chains give regional chemical suppliers an edge through rapid onsite service, a factor that strengthens pricing power in the metal finishing chemical market. Consolidated job shops also pool capital to install automated lines that require consistent, high-purity chemistries, raising average spend per line.
Restraints Impact Analysis of Metal Finishing Chemical Market*
| Restraints | (~) % Impact on CAGR Forecast | Geographic Relevance | Impact Timeline |
|---|---|---|---|
| Rapid adoption of high-performance plastics in e-mobility | -0.8% | Global, with early adoption in European and North American EV markets | Short term (≤ 2 years) |
| 3D-printed net-shape metals lower post-finish chemical volumes | -0.6% | APAC manufacturing hubs, expanding to North America and Europe | Medium term (2-4 years) |
| Tight PFAS and Cr VI bans raise reformulation compliance costs | -0.4% | EU leading, North America following, gradual APAC adoption | Long term (≥ 4 years) |
| Source: Mordor Intelligence | |||
Rapid Adoption of High-Performance Plastics in E-Mobility
Engineers substitute carbon-fiber and glass-fiber composites for aluminum brackets and housings, trimming 30% weight without post-plating steps. Plastics can integrate decorative texture during molding, erasing the need for chemical etches or electroless plating. Covestro’s low-carbon polycarbonate cuts VOCs and meets thermal-shock standards, reinforcing non-metal adoption. As plastic penetration widens, the addressable portion of the metal finishing chemical market tied to exterior trim and under-hood brackets contracts, pressuring legacy chemistries.
3D-Printed Net-Shape Metals Lower Post-Finish Chemical Volumes
Laser powder bed fusion delivers titanium and Inconel parts with surface roughness under 6 µm; cavitation-abrasive finishing removes alpha-case layers mechanically, bypassing acid dips. Wire-arc additive manufacturing yields near-net-shape components that need only light polishing. Machine-learning algorithms refine scan paths, reducing porosity and eliminating the need for heavy post-plate corrosion barriers. As aerospace and medical buyers qualify printed parts, chemical consumption per unit declines, limiting upside for some metal finishing chemical market segments.
*Our forecasts treat driver/restraint impacts as directional, not additive. The impact forecasts reflect baseline growth, mix effects, and variable interactions.
Metal Finishing Chemical Market Segment Analysis
By Chemical Type:
Demand Diversifies Beyond Traditional PlatingPlating chemicals held a 38.72% share of the metal finishing chemical market in 2025, driven by their indispensable role in electrodeposition for automotive trim, semiconductor bumps, and aerospace fasteners. Cleaning chemicals, although smaller, are the fastest-growing at 5.93% CAGR because chip fabs mandate particle-free substrates before copper damascene steps. Degreasers employing bio-based surfactants meet stringent resistivity thresholds, and hydrogen peroxide blends replace solvent cleaners to cut greenhouse-gas footprints. Proprietary blends now comprise multilayer additive packages that fine-tune deposit brightness and tensile stress for niche alloy systems. Chrome-free conversion-coat solutions capture aerospace share as qualification programs conclude, redirecting revenue from legacy hexavalent products into safer alternatives.



By Materials:
Nickel Gains Momentum Amid Aluminum DominanceAluminum finishing products commanded 30.86% of the metal finishing chemical market in 2025, buoyed by EV battery-tray production and architectural cladding demand. Multi-stage anodizing baths yield pore structures suited for dye uptake, expanding decorative options. Yet nickel baths are advancing fastest at 6.09% CAGR as electrolyzer plates and battery current collectors proliferate. High-pH sulfamate systems allow thick nickel deposits with low internal stress, critical for hydrogen-evolution efficiency. Copper plating remains steady in printed-circuit fabrication, while zinc-nickel alloys displace cadmium in aerospace hardware.
By Process:
Electroplating Retains Dual SupremacyElectroplating claimed 41.59% of the metal finishing chemical market share in 2025 and posts a 6.74% growth outlook, reflecting its adaptability to everything from micro-bump copper pillars to heavy hard-chrome builds. Automated racks with vision-guided loading squeeze takt times and heighten bath throughput. AI-based predictive dosing halves additive over-use, strengthening environmental compliance. Anodizing grows modestly as architectural projects favor colored finishes, whereas thermal-spray systems fill wear-resistant niches with ceramic-metal blends.
Pulse-reverse power supplies in electroplating reduce porosity in high-aspect-ratio trenches, enabling semiconductor metallization down to 5 nm nodes. Digital twin models simulate ion transport, optimizing throwing power before plant trials. These technology upgrades underpin the process segment’s leadership and deepen customer reliance on advanced formulations, cementing revenues throughout the metal finishing chemical market.
By End-User Industry:
Electronics Challenges Automotive SupremacyAutomotive applications delivered 46.54% of 2025 revenue as decorative chrome and zinc-nickel corrosion barriers remained standard. Yet electric drivetrains shift demand toward copper busbar plating and aluminum battery cases, altering chemistry mixes. Electronics is accelerating at 6.45% CAGR as AI chips and advanced packaging ramp volumes that need ultra-pure copper and cobalt electrolytes. Aerospace keeps premium pricing because flight-critical hardware requires high-reliability coatings audited by OEMs.
Industrial machinery and construction contribute a steady baseline demand for galvanized and phosphate finishes, while renewable-energy infrastructure, wind-turbine gearboxes, and hydrogen electrolyzers open high-value niches. As each sector’s requirements diverge, suppliers segment portfolios, supporting multi-application growth across the metal finishing chemical market.
Geography Analysis
APAC Metal Finishing Chemical Market
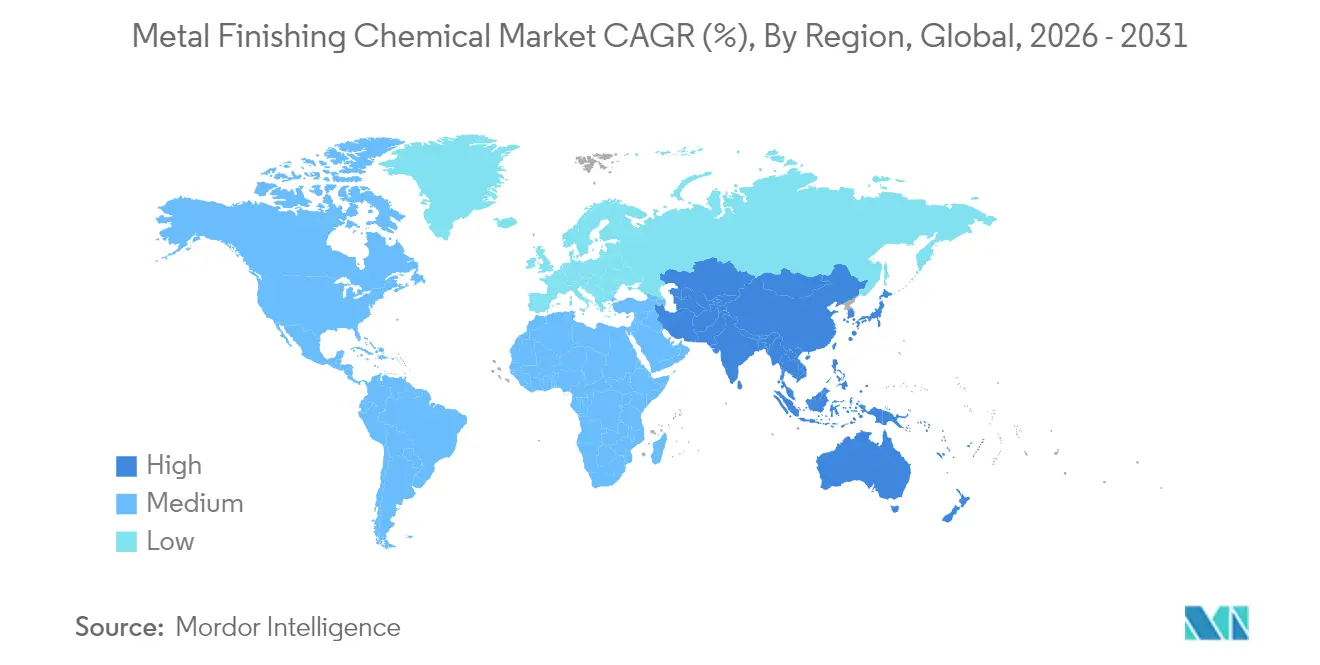
Asia-Pacific dominated with 53.08% revenue share in 2025, and the metal finishing chemical market size here is rising 6.78% annually. China’s EV build-out, India’s specialty chemical expansion, and South Korea’s chip-foundry investments fuel volume gains. Government incentives for localized semiconductor supply chains spur high-purity plating demand, giving regional suppliers scale advantages.
North America Metal Finishing Chemical Market
North America benefits from the Infrastructure Investment and Jobs Act funding and reshoring. U.S. cast-metal demand is projected at USD 37.5 billion by 2032, supporting downstream finishing needs. Canada’s EV projects and Mexico’s contract manufacturing hubs multiply cross-border chemical flows. Shorter transport routes and on-site technical support strengthen supplier relationships, raising margins within the metal finishing chemical market.
Europe Metal Finishing Chemical Market
Europe faces strict REACH revisions that ban PFAS and tighten chromium VI allowances. Compliance pressures add cost but also stimulate innovation. DuPont’s chrome-free etchants and ammonia-free plastic metallization lines gain traction, while German tier-ones pilot zirconate sealer systems. Eastern Europe captures capacity migrating from higher-cost Western plants, enlarging its finish-chemical consumption base. As regulators reward sustainable chemistries, premium offerings secure share across the metal finishing chemical market.

Regulatory Landscape
Regulation is tightening around substances and emissions relevant to metal finishing, with PFAS and chromium chemistry central to compliance planning. In the European Union, REACH (EC) No 1907/2006 continues to steer substance control, and in March 2026 ECHA committees advanced a broad PFAS restriction process, with SEAC running a public consultation window ending May 25, 2026. This momentum is accelerating supplier reformulation and customer qualification work for PFAS-free cleaners and chrome-free or trivalent conversion and plating alternatives.
In the United States, metal finishing operations remain governed by effluent limitation requirements such as 40 CFR Part 433, and the U.S. EPA has signaled a specific regulatory step on PFAS in wastewater from finishing operations. EPA indicated plans to issue a Notice of Proposed Rulemaking in July 2026 to revise the Metal Finishing Effluent Limitation Guidelines to address PFAS discharges, which increases the focus on wastewater treatability, analytical documentation, and trace-level impurity control across electroplating supply chains.
Value Chain Analysis
The value chain starts with upstream inputs (inorganic salts, acids and alkalis, surfactants, chelators and complexing agents, and specialty organic additives), then moves into formulation and blending of plating, cleaning, and conversion-coat chemistries provided by multinational chemical companies and specialized surface-treatment providers. From there, products reach customers through a mix of direct OEM supply and regional distribution, supported by onsite technical service, bath analytics, and compliance documentation, which are increasingly central to supplier selection as customers press for tighter thickness control, lower scrap, and auditable chemical inventories.
Downstream, consumption is concentrated at job shops and captive finishing lines serving automotive, electronics, aerospace, industrial machinery, and construction, where process stability and waste handling often determine total cost. Compliance pressure is now a major value-chain shaper, particularly around PFAS and chromium, pushing reformulation toward trivalent chromium, zirconium and titanium conversion coatings, and other chrome-free systems. Product innovation also pulls the chain toward higher-purity and application-specific additives, including Chemetall's October 2025 launch of Gardolene D, positioned as chromium-free and fluoride-free passivation for copper foils used by EV battery manufacturers.
Competitive Landscape
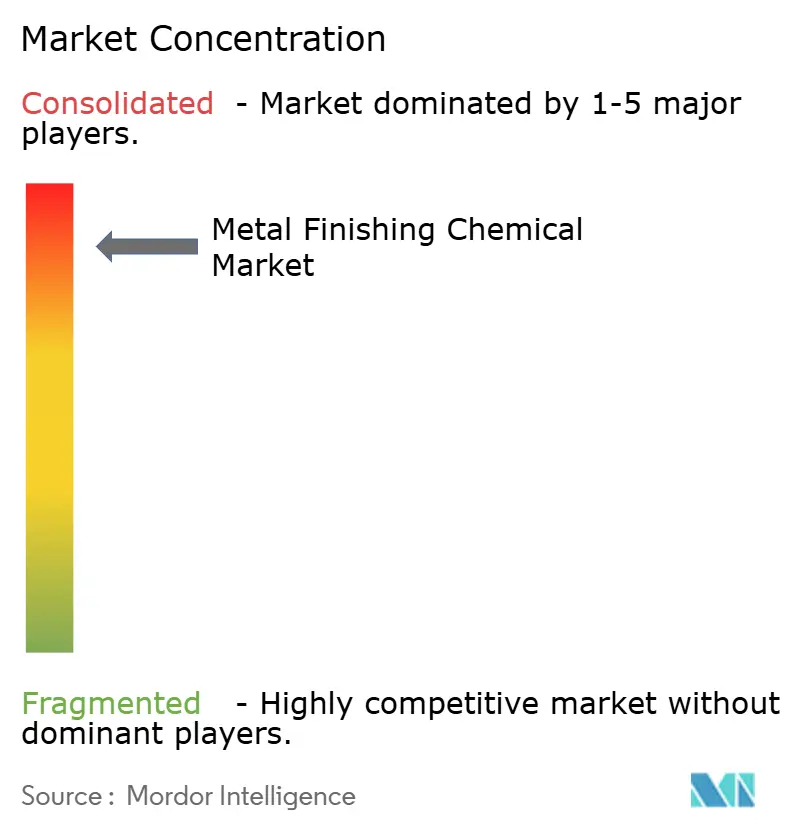
The market remains highly consolidated. Technology leadership hinges on developing PFAS-free cleaners and chrome-free conversion coats that match legacy performance. AI-enabled bath monitoring differentiates suppliers able to furnish data dashboards to OEM quality teams. Start-ups focus on hydrogen electrolyzer nickel baths, targeting a premium niche underserved by multinationals.
Metal Finishing Chemical Industry Leaders
BASF
Dow
Henkel AG & Co. KGaA
MacDermid Alpha Electronics Solutions
MKS Inc.
- *Disclaimer: Major Players sorted in no particular order
Metal Finishing Chemical Market Companies Covered in this Report
- Asterion LLC
- BASF
- Dow
- Elementis PLC
- Henkel AG & Co. KGaA
- Honeywell International Inc.
- JCU INTERNATIONAL, INC
- Kemia Pte Ltd
- MacDermid Alpha Electronics Solutions
- McGean-Rohco Inc.
- MKS Inc.
- Nihon Parkerizing Co.
- NOF Corporation
- Quaker Chemical Corporation
- Transene Company, Inc.

Market Opportunities and Future Outlook
A key whitespace is the accelerated replacement cycle from legacy PFAS-containing and hexavalent chromium-associated chemistries into compliant alternatives that still meet corrosion, adhesion, and throughput targets. Regulatory milestones are creating near-term decision points: ECHA committee opinions in March 2026 advanced an EU-wide PFAS restriction track under REACH, and the U.S. EPA has communicated a July 2026 rulemaking step to revise Metal Finishing Effluent Limitation Guidelines (40 CFR Part 433) to address PFAS discharges. These actions elevate demand for PFAS-free cleaners, chrome-free conversion coats, and chemistries with improved wastewater treatability and documentation, while also increasing the value of suppliers that can provide bath monitoring, analytics, and compliance-ready technical files.
Opportunity is also concentrated where performance requirements keep chemical intensity high, including electronics miniaturization (high-purity plating additives and tighter bath control) and aluminum-intensive EV architectures (conversion and anodizing chemistries tuned for recycled alloys and lower-energy processing). Portfolio and route-to-market build-out is visible around these needs, including March 2026 activity involving CHEMEON Surface Technology with SurTec, and Azelis with Chemetall in Canada, aimed at scaling environmentally compliant surface-treatment solutions and technical coverage. At the same time, adjacent formulation moves toward lower-VOC and bio-based modifiers are showing up in product introductions, including Lubrizol's July 2026 introduction of a 100% bio-based, microplastic-free surface modifier for water-based coatings, which supports broader customer efforts to reduce hazardous constituents across finishing-related chemistries.
Recent Industry Developments in Metal Finishing Chemical Market
- April 2026: Henkel launched Bonderite M-ED 11204, an 85 C mid-temperature sealing solution for aluminum anodizing aimed at lowering energy use, CO2 emissions, and water consumption. The product targets a high-volume finishing step where operating-temperature reductions can materially change line economics and sustainability reporting for automotive and industrial anodizers.
- May 2025: MKS Inc. (Atotech) opened a facility in Derio, Spain, expanding General Metal Finishing capacity and local technical support across Iberia and Southern Europe. The move strengthens regional service responsiveness for job shops and OEM finishers and supports tighter process control requirements tied to modern plating and conversion-coat chemistries.
- January 2024: MacDermid Enthone Industrial Solutions acquired All-Star Chemical Company's surface finishing and cleaning chemical solutions business. The acquisition broadened MacDermid Enthone's portfolio and customer access in surface preparation and finishing chemistries, reinforcing consolidation trends in a market where formulation breadth and technical support capability drive share.


Metal Finishing Chemical Market Report Scope and Research Methodology
Market Definition and Coverage
This market covers chemical formulations used to prepare, treat, and protect metal surfaces during finishing steps, including cleaning, pickling, plating baths, and conversion coatings. We count the value of these chemistries consumed across industrial users where metal parts are processed for corrosion resistance, durability, conductivity, or appearance.
Scope exclusions: We exclude metal finishing equipment and systems (such as plating lines, spray booths, or vibratory finishers) and focus only on chemicals.
Segments Covered in This Report
- By Chemical Type
- Plating Chemicals
- Proprietary Chemicals
- Cleaning Chemicals
- Conversion-Coating Chemicals
- By Materials
- Aluminum
- Copper
- Zinc
- Nickel
- Chromium
- Other Materials
- By Process
- Anodizing
- Carbonizing
- Electroplating
- Polishing
- Plating
- Thermal or Plasma Spray Coating
- Other Process (Laser, Magnetic-Abrasive, etc.)
- By End-user Industry
- Automotive
- Industrial
- Electronics
- Aerospace and Defense
- Construction
- Other End-User Industries (Energy, etc.)
- By Geography
- Asia-Pacific
- China
- India
- Japan
- South Korea
- Rest of Asia-Pacific
- North America
- United States
- Canada
- Mexico
- Europe
- Germany
- United Kingdom
- France
- Italy
- Rest of Europe
- South America
- Brazil
- Argentina
- Rest of South America
- Middle-East and Africa
- Saudi Arabia
- South Africa
- Rest of Middle-East and Africa
- Asia-Pacific
Data Sources, Market Sizing, and Validation
Desk Research
Desk research started by mapping where metal finishing chemicals are used and how demand changes with manufacturing output. We relied on public statistics and technical references to understand the direction of plating and surface-treatment activity, then translated those signals into a practical demand picture.
Sources included non-paywalled materials such as USGS and other government industrial production releases, UN Comtrade trade statistics for relevant chemical categories, EPA and ECHA regulatory updates linked to chromium and PFAS, and technical bodies such as ASTM and ISO that clarify process requirements. We also reviewed company filings, investor presentations, industry association publications, and trade press to confirm end-use momentum in automotive, electronics, and machinery. In addition, we referenced paid subscriptions for company financials and intelligence, and an import-export shipment-level database to sanity-check trade flows and supplier footprints. These examples are not exhaustive, and other sources were used for data collection, validation, and research clarification.
Primary Interviews and Surveys
Primary interviews and surveys were used to stress-test chemical demand drivers that are not fully visible in public data, especially bath-change frequency, average consumption per line, and pricing behavior during raw material swings. We spoke with a mix of formulators, distributors, toll blenders, and industrial users, and we also checked input from engineering and EHS roles so assumptions on regulated chemistries were not overstated across major regions.
Distribution of primary research fieldwork respondents
| Company type | Respondent position | Region |
|---|---|---|
| Top tier: 29% | CXOs: 12% | APAC: 48% |
| Mid tier: 52% | Functional/Unit leaders: 41% | EMEA: 31% |
| Smaller Players: 19% | Managers: 47% | Americas: 21% |
Market-Sizing & Forecasting
Market sizing starts with a top-down build where manufacturing and surface-treatment activity signals are converted into a chemical consumption pool, then valued using representative price bands by chemistry class. To avoid over-counting, the model separates chemical usage tied to plating and conversion lines from adjacent spending such as equipment, maintenance, and services, and then totals are checked with selective bottom-up inputs (sampled supplier revenues, channel checks, and ASP times volume calculations) before finalizing.
Key inputs included indicators such as vehicle and industrial machinery production trends, electronics output and export momentum, the shift from hexavalent chromium to alternative systems, conversion coating and electroless process penetration in key industries, and raw material linked pricing movements that influence bath chemistry costs. Where bottom-up approximations had gaps, coverage was extended using proxy penetration rates and cross-checked against trade movement and interview feedback, so final totals remain realistic.
For forecasting, scenario analysis was applied around manufacturing cycles and regulation-driven chemistry substitution. Variables were adjusted based on what industry experts expect for compliance timelines and adoption speed. The output is a yearly value forecast that can be traced to the same demand indicators and price logic used in the base year.
Data Validation & Update Cycle
Validation uses multiple checks that compare model output with independent signals, such as industrial production direction, trade movement consistency, and expected pricing ranges for core chemistries. When results fall outside what these signals imply, we revisit assumptions, re-check source statements, and reconnect with selected interviewees to determine whether a change is structural or temporary.
Before sign-off, the work is reviewed in steps so the math, definitions, and year alignment stay consistent across sections and exhibits. Reports refresh annually, and interim updates are triggered when a material event occurs, for example a major regulatory action or a sharp shift in manufacturing output. A final pass is completed right before delivery so clients get the most current view available.
Mordor Intelligence's Metal Finishing Chemical Market Size Measured Against Other Published Estimates
Published market sizes for metal finishing chemicals can differ even when they appear to track the same industry, because boundaries and pricing choices are not always aligned. Most gaps come from whether adjacent items are included, what year is used for currency and price timing, and how much primary checking is applied to confirm consumption assumptions.
The benchmark table shows a spread largely explained by scope and valuation choices. In the Mordor Intelligence approach, the market is limited to chemical formulations used in finishing steps and excludes finishing equipment spend that some estimates include. Gaps also appear when one source assumes faster substitution to newer chemistries, while another retains legacy chemistry shares for longer, which changes both volume and average selling price progression by year.
Benchmark comparison
| Source | Market Size | Gaps in Research Methodology |
|---|---|---|
| Mordor Intelligence | USD 12.92 B (2025) | |
| Industry Report Publisher A | USD 12.88 B (2024) | Uses a different base year and often treats the market as a broader process bucket, which can mix in spending beyond chemicals and shift the value when prices change year to year. |
| Press Release Digest B | USD 11.50 B (2026) | Anchors the value to a later year and may apply a single growth path from earlier historical points, which can understate near-term price uplift and chemistry mix shifts across regions. |
Taken together, the table suggests the gap is less about demand direction and more about what is counted and when it is priced. Our approach stays traceable by tying value to a defined chemical consumption pool, then re-checking the totals against trade movement and interview-led reality checks so decision-makers can repeat the logic with clear inputs.


Key Questions Answered in the Report
What is the current value of the metal finishing chemical market?
The metal finishing chemical market size is USD 13.53 billion in 2026, with a CAGR of 4.76% toward 2031.
Which chemical type leads the market?
Plating chemicals hold the largest share at 38.72%, reflecting their critical role in electrodeposition across industries.
Why is Asia-Pacific dominant in metal finishing chemicals?
Asia-Pacific hosts the bulk of global electronics and EV production, capturing 53.08% of 2025 revenue and growing 6.78% annually.
How are regulations influencing product development?
Stricter PFAS and chromium VI bans in Europe and North America push suppliers to develop chrome-free conversion coats and fluorine-free cleaners without sacrificing performance.
Which material segment is growing fastest?
Nickel finishes are advancing at 6.09% CAGR due to hydrogen electrolyzer plates and battery collectors that need high-integrity nickel deposits.
Page last updated on:


 Your data is secure and never sold or shared.


