
Metallurgical Coke Market Size and Share
Market Overview
| Study Period | 2021 - 2031 |
|---|---|
| Market Volume (2026) | 563.85 Million tons |
| Market Volume (2031) | 675.19 Million tons |
| Growth Rate (2026 - 2031) | 3.67 % |
| Fastest Growing Market | Asia Pacific |
| Largest Market | Asia Pacific |
| Market Concentration | Low |
Major Players *Disclaimer: Major Players sorted in no particular order Image © Mordor Intelligence. Reuse requires attribution under CC BY 4.0. | |
Metallurgical Coke Market Analysis by Mordor Intelligence
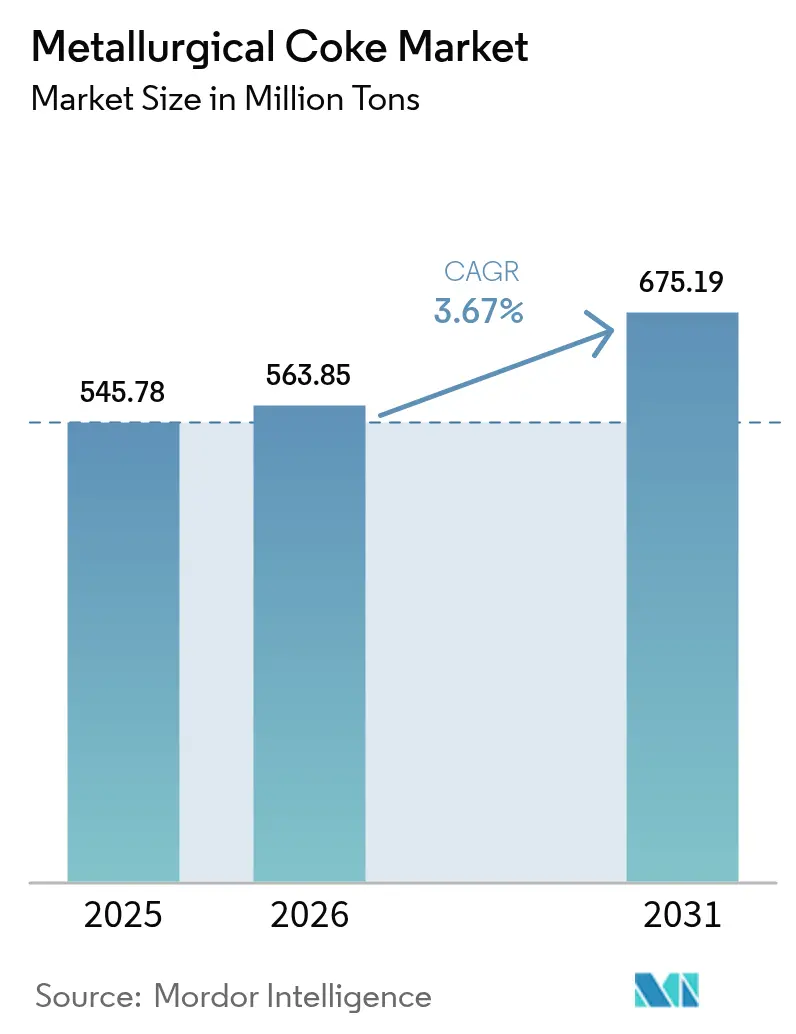
The Metallurgical Coke Market size is expected to grow from 545.78 Million tons in 2025 to 563.85 Million tons in 2026 and is forecast to reach 675.19 Million tons by 2031 at a 3.67% CAGR over 2026-2031. Integrated steel-mill expansions in Asia-Pacific remain the chief demand driver, as blast-furnace operators favor low-ash grades that boost thermal efficiency and cut slag volumes. Upgrades to dry-quenching systems allow producers to command premiums, cushioning margins when seaborne metallurgical-coal prices spike. Rising infrastructure outlays under India’s National Infrastructure Pipeline and Saudi Arabia’s Vision 2030 keep long-steel demand robust, even while scrap-rich economies grow their electric-arc-furnace (EAF) share. Environmental regulations in China and the EU are simultaneously pushing small, high-emission coke plants to consolidate or exit, raising average product quality but tightening merchant supply.
Key Report Takeaways
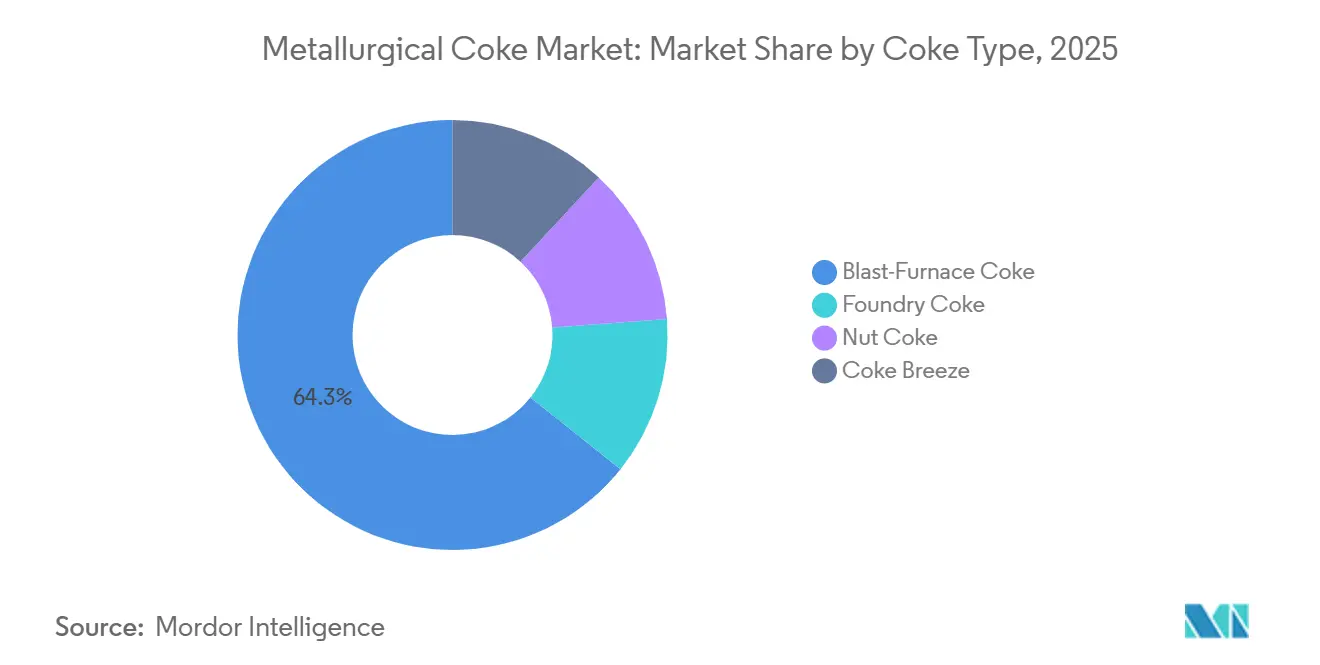
- By coke type, blast-furnace coke led with 64.27% metallurgical coke market share in 2025, while nut coke is projected to record the fastest 4.25% CAGR to 2031.
- By grade, low-ash coke (8-12% ash) commanded 70.80% of the metallurgical coke market size in 2025 and is forecast to expand at a 4.59% CAGR through 2031.
- By application, iron and steel making held a dominant 65.39% share of the metallurgical coke market size in 2025, while glass manufacturing is advancing at a 5.18% CAGR to 2031.
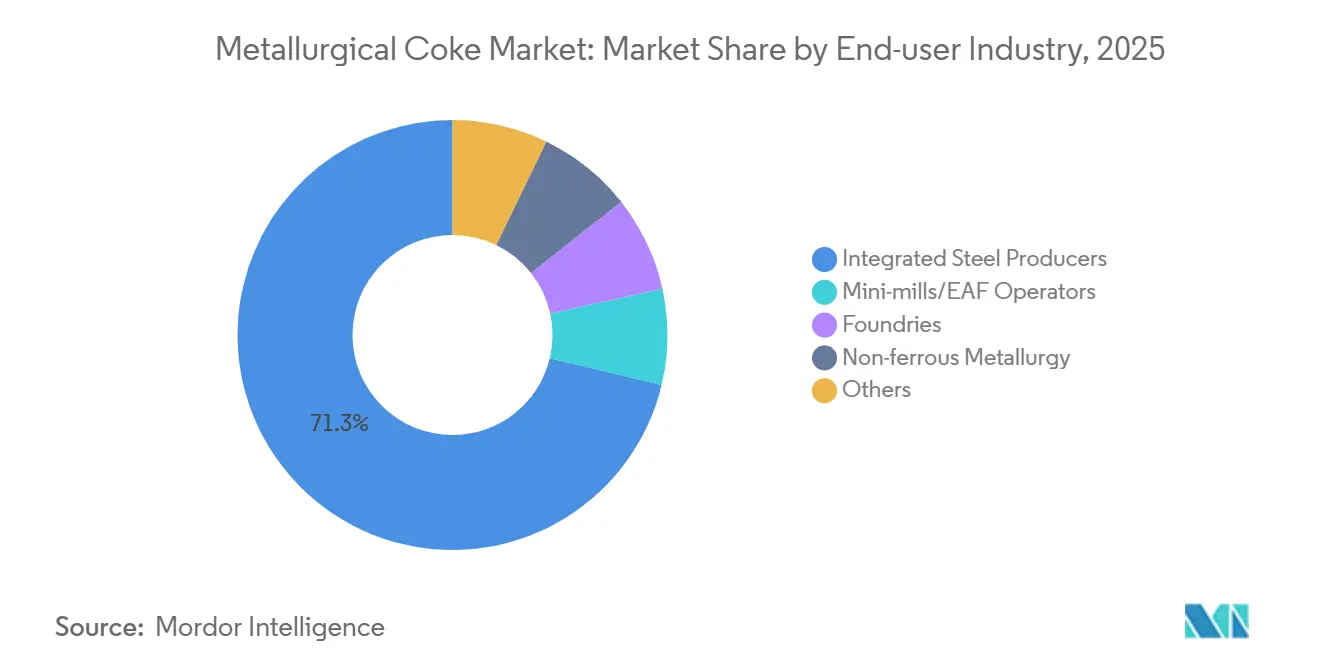
- By end-user industry, integrated steel producers accounted for 71.26% of the metallurgical coke market size in 2025, and foundries are projected to grow at a 4.40% CAGR through 2031.
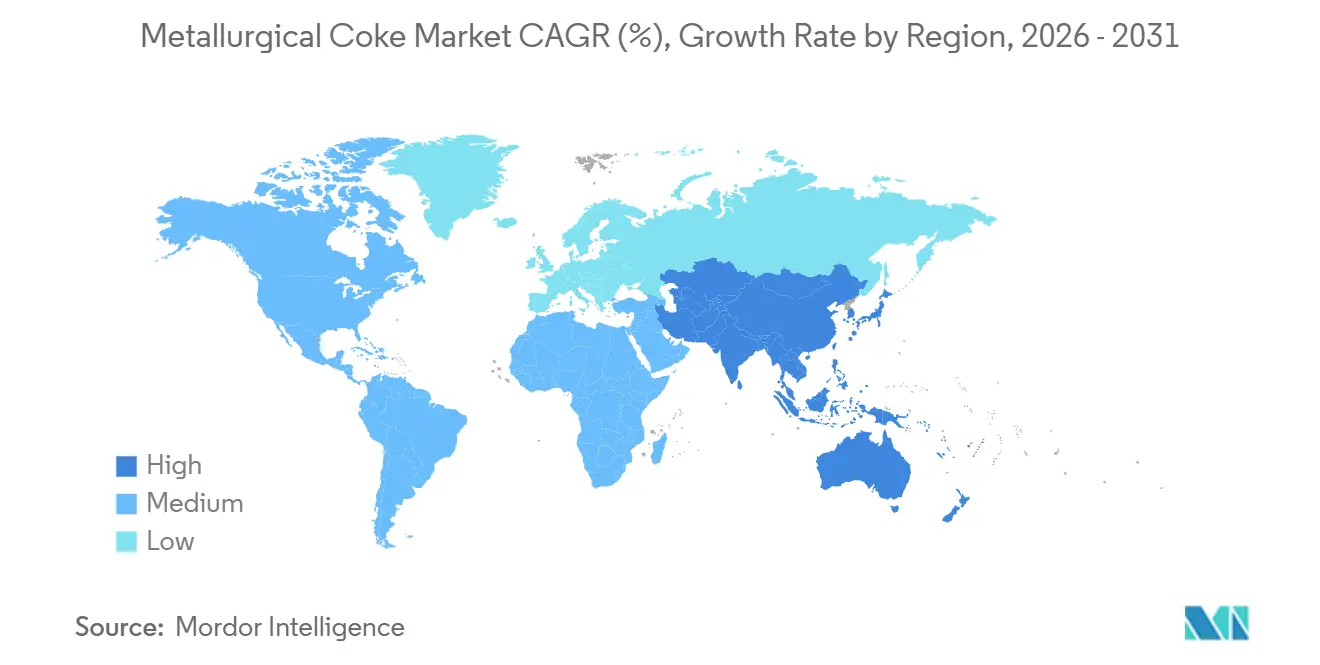
- By geography, the Asia Pacific region represented 69.70% of the metallurgical coke market size in 2025 and is expected to grow at a CAGR of 4.16%.
Note: Market size and forecast figures in this report are generated using Mordor Intelligence’s proprietary estimation framework, updated with the latest available data and insights as of 2026.
Market Trends and Insights
Drivers Impact Analysis of Metallurgical Coke Market*
| Driver | (~) % Impact on CAGR Forecast | Geographic Relevance | Impact Timeline |
|---|---|---|---|
| Rising demand for steel in public infrastructure | +1.2% | Asia-Pacific (India, ASEAN), Middle East | Medium term (2-4 years) |
| Expanding automotive production capacity | +0.8% | Asia-Pacific (China, India, Thailand), North America | Short term (≤ 2 years) |
| Capacity additions in integrated steel mills | +1.1% | Global, concentrated in Asia-Pacific and Middle East | Long term (≥ 4 years) |
| Urban construction boom in emerging economies | +0.9% | Asia-Pacific (India, Indonesia, Vietnam), Middle East, Africa | Medium term (2-4 years) |
| Adoption of dry-quenching technology enabling premium pricing | +0.5% | China, Europe, North America | Long term (≥ 4 years) |
| Source: Mordor Intelligence | |||
Rising Demand for Steel in Public Infrastructure
Governments in Asia-Pacific and the Middle East are allocating unprecedented budgets to highways, metro rail, and renewable-energy grids that require rebar and plate, both of which depend on blast-furnace routes using metallurgical coke. India’s USD 1.4 trillion National Infrastructure Pipeline earmarks nearly one-quarter for transport projects, translating into steady coke offtake of roughly 0.8 tons per ton of crude steel[1]Government of India, “National Infrastructure Pipeline Progress Report 2025,” indiabudget.gov.in. Saudi Arabia’s NEOM and related megaprojects are projected to lift the kingdom’s steel demand to 12 million tons by 2028, keeping regional mills on multi-year coke procurement contracts. Vietnam’s North-South Expressway adds further pull, prompting Hoa Phat Group to install new blast furnaces with an extra 1.5 million tons of coke demand by 2027. Taken together, these programs underpin the positive demand trajectory of the metallurgical coke market.
Expanding Automotive Production Capacity
Light-vehicle output rebounded in China, India, and Thailand in 2025, yet steel intensity per vehicle eased as automakers adopted thinner high-strength steels and aluminum. China assembled 30.2 million vehicles in 2025, 4% above 2024, while average steel content slipped to 820 kg per car. Each incremental million vehicles in India still implies 180,000 tons of coke when blast-furnace share is considered, anchoring demand for the metallurgical coke industry despite gradual EAF inroads. Thailand’s EV expansion sources more EAF steel from regional suppliers, hinting that vehicle electrification will eventually cap coke growth rates in Southeast Asia.
Capacity Additions in Integrated Steel Mills
Brownfield expansions at large blast-furnace complexes lock in decades of coke consumption. JSW Steel’s 5 million ton furnace added in 2024 elevates captive coke demand by 2 million tons a year and is paired with a 10% equity stake in an Australian coal mine for feedstock security. ArcelorMittal’s Liberia iron-ore project and China Baowu’s ultra-large furnaces above 5,000 m³ illustrate how scale and vertical integration sustain long-term demand within the metallurgical coke market.
Urban Construction Boom in Emerging Economies
Rapid urbanization in India, Indonesia, and Vietnam keeps demand for long steel elevated. Indonesia’s new capital, Nusantara, will need 8 million tons of steel over the coming decade, with Krakatau Steel planning a 3 million ton integrated expansion that leans on regional coke suppliers. Egypt’s New Administrative Capital uses 2 million tons of steel a year, mostly from blast-furnace mills, illuminating the wider African opportunity for metallurgical coke.
Restraints Impact Analysis of Metallurgical Coke Market*
| Restraint | (~) % Impact on CAGR Forecast | Geographic Relevance | Impact Timeline |
|---|---|---|---|
| Metallurgical coke price volatility | -0.7% | Global, acute in import-dependent regions (India, Europe, Japan) | Short term (≤ 2 years) |
| Stringent environmental regulations on coking plants | -0.9% | China, European Union, North America | Medium term (2-4 years) |
| Supply risk from Australian met-coal logistics disruptions | -0.4% | Asia-Pacific (Japan, South Korea, India), Europe | Short term (≤ 2 years) |
| Source: Mordor Intelligence | |||
Metallurgical Coke Price Volatility
Spot hard-coking-coal prices swung between USD 210 and USD 340 per ton during 2024-2025 after Cyclone Jasper disrupted Queensland rail, compressing merchant-coke producer margins that average 6–8% EBITDA. India, which imported 54 million tons of coking coal in 2025, remains especially exposed, as 85% arrives from Australia. Futures hedging on the Dalian Commodity Exchange offers partial relief, yet physical-grade differentials leave basis risk.
Stringent Environmental Regulations on Coking Plants
China’s ultra-low-emission standards triggered the closure of 8 million tons of sub-scale capacity in Shanxi in 2024 and forced new batteries to install selective catalytic reduction and desulfurization systems. The EU tightens benzene limits to 5 mg/m³ from 2026, pushing legacy Polish and Czech ovens toward shutdowns unless retrofitted[2]European Commission, “Industrial Emissions Directive Revision 2026,” ec.europa.eu. In the United States, the EPA’s 2024 NESHAP revision shortened leak-repair windows, prompting US Steel to idle portions of Clairton works.
*Our forecasts treat driver/restraint impacts as directional, not additive. The impact forecasts reflect baseline growth, mix effects, and variable interactions.
Metallurgical Coke Market Segment Analysis
By Coke Type:
Blast-Furnace Dominance Anchors VolumeBlast-furnace coke accounted for 64.27% of global volume in 2025, underscoring its indispensable function as both reductant and structural support inside modern 1,500 °C furnaces. Nut coke is rising fastest at 4.25% CAGR because foundries crave 10–25 mm particles that enhance cupola permeability. Foundry coke retains its niche by supplying gray- and ductile-iron plants that demand CSR above 60% and sulfur below 0.6%. Coke breeze use is stagnating as mills shift from sinter to fluxed pellets, trimming the low-value tail of the metallurgical coke market.
Big Chinese integrated mills continue to specify high-CSR (greater than 65%) blast-furnace coke to withstand shaft pressures exceeding 15 bar in 5,000 m³ furnaces. Adoption of CDQ improves strength by 3-5 percentage points, allowing producers to fetch premiums even amid coal-price volatility. Over the forecast period, nut-coke demand will outpace blast-furnace growth, yet absolute tonnages favor the latter, cementing its status as the mainstay of the metallurgical coke market.



By Grade:
Low-Ash Premium Reflects Efficiency GainsLow-ash (8–12%) coke captured 70.80% share in 2025 and is set to grow 4.59% annually, well ahead of high-ash alternatives. Each 1 percentage-point drop in ash trims slag by 15 kg per ton of hot metal, saving limestone and refractory costs. Consequently, mills commissioning furnaces above 4,500 m³ in India and China contract multi-year supplies of premium coal blends to secure low-ash output, locking in a quality-driven tier within the metallurgical coke market. High-ash coke, typically above 15%, retreats to legacy furnaces and non-ferrous smelters.
The price spread widened to USD 35–40 per ton in 2025 as China’s crackdown on high-emission beehive ovens squeezed marginal supply. ISO 18894:2024 now measures alkali content, adding another lever that favors low-ash producers able to guarantee sodium and potassium below 0.3%. These quality screens reinforce the structural premium in the metallurgical coke market.
By Application:
Glass Manufacturing Outpaces Traditional UsesIron and steel making continued to dominate with 65.39% of demand in 2025; however, float-glass production grows the fastest at 5.18% CAGR as India and Vietnam expand solar-panel and architectural-glass lines. Each ton of float glass needs around 15 kg of coke or petcoke as a reductant, translating into incremental pull that, while modest, diversifies the metallurgical coke market. Foundry applications growth is driven by offshore wind hubs and automotive castings that require low-sulfur coke for metallurgical purity.
Non-ferrous smelting remains a small but stable outlet, while sugar processing gradually relinquishes its footprint as millers adopt high-efficiency bagasse gasifiers. Within glass, line upgrades to oxy-fuel burners reduce coal dust but cannot eliminate the carbon requirement, ensuring continued niche demand for high-purity coke grades.
By End-User Industry:
Foundries Drive Incremental DemandIntegrated steelmakers held 71.26% of the 2025 volume, yet foundries are forecast to grow quickest at a 4.40% CAGR through 2031. Offshore wind turbines demand 25–30 tons of ductile-iron castings per 5 MW unit; with global installations surpassing 120 GW a year by 2030, foundries in China, India, and Spain will increasingly specify low-sulfur, high-CSR coke. Mini-mills and EAFs, at 29% of global crude output, use little coke beyond ladle carbon injection, signaling a long-run substitution threat but not an immediate displacement.
Non-ferrous metallurgy makes marginal gains in regions retaining legacy blast-furnace smelters, while sugar, chemicals, and other smaller users show flat to declining trends. Overall, integrated steel will keep absolute volumes dominant, but incremental tonnage growth tilts toward foundries, adding complexity to the metallurgical coke market.
Geography Analysis
APAC Metallurgical Coke Market
Asia-Pacific commanded 69.70% of volume in 2025 and will maintain a 4.16% CAGR to 2031, thanks to China’s 480 million tons of coke production and India’s rapid steel-capacity build-out. China’s Ministry of Ecology and Environment shuttered 15 million tons of non-compliant capacity in 2025, shifting supply toward large, CDQ-equipped state enterprises with lower emission footprints. India expanded captive coke-oven capacity to 45 million tons, yet still relies on 54 million tons of coking-coal imports, cementing cross-border trade in the metallurgical coke market.
North America Metallurgical Coke Market
North America’s production in 2025 was split between SunCoke merchant plants and integrated mills, but coke demand is gradually easing as US Steel idles older blast furnaces in favor of EAF routes. Canada’s lone Dofasco oven faces rising carbon taxes that may accelerate electrification, potentially trimming regional metallurgical coke market demand share by 2031.
EMEA and South America Metallurgical Coke Market
Europe’s output fell in 2025 amid stricter benzene limits. With ArcelorMittal converting Kraków to an EAF and thyssenkrupp trialing hydrogen injection, European demand could drop further by 2035. South America remains stable, whereas the Middle East and Africa together may rise as Saudi and Egyptian mills add capacity, albeit with heavy dependence on imports via the metallurgical coke market.

Regulatory Landscape
Environmental compliance and cross-border carbon policy are tightening the operating and trade context for metallurgical coke and blast-furnace steel routes. In the United States, the EPA issued an interim final rule in July 2025 that extended compliance deadlines for the 2024 NESHAP updates covering coke ovens and pushing, quenching, and battery stacks to July 5, 2027. The change affects retrofit and outage planning windows for legacy assets.
In Europe, the Carbon Border Adjustment Mechanism (CBAM) moved into its definitive compliance phase on January 1, 2026, linking import compliance costs for covered goods such as steel to EU ETS pricing through CBAM certificates. The European Commission published official quarterly certificate prices (EUR 75.36/tCO2e for Q1 2026 and EUR 75.28/tCO2e for Q2 2026). In June 2026, the European Parliament ENVI committee adopted a position that includes expanding CBAM to more downstream products from 2028, alongside an industry support concept (temporary decarbonisation fund), reinforcing policy pull toward lower-emission supply chains.
Value Chain Analysis
The metallurgical coke value chain starts with metallurgical coal exploration and mining, followed by coal preparation (crushing, sizing, and separation). It then relies on multi-modal logistics (rail, barge, truck, and ocean freight) to move feedstock to coking plants and integrated steel sites. Coke production uses destructive distillation in ovens without air at about 1100 to 1150 degrees Celsius. Closed-system gas treatment recovers by-products such as coal tar, ammonia, and sulfur-bearing compounds, and it recycles some cleaned gas for oven heating, which makes by-product handling and emissions controls central to plant economics.
Downstream, distribution splits between captive consumption at integrated steel mills and merchant supply to steel, foundry, and selected industrial users, with quality certification and consistency (ash, sulfur, CSR) shaping contractability. Policy-driven trade constraints are increasingly visible in import-dependent corridors: India introduced quantitative restrictions in January 2025 (capping metallurgical coke imports at 1.4 million tonnes per half-year) and later imposed provisional anti-dumping duties in November 2025. Together, these actions tightened availability and shifted procurement toward captive and long-term sourcing, with coastal hubs positioned to optimize inbound coal logistics and product dispatch.
Competitive Landscape
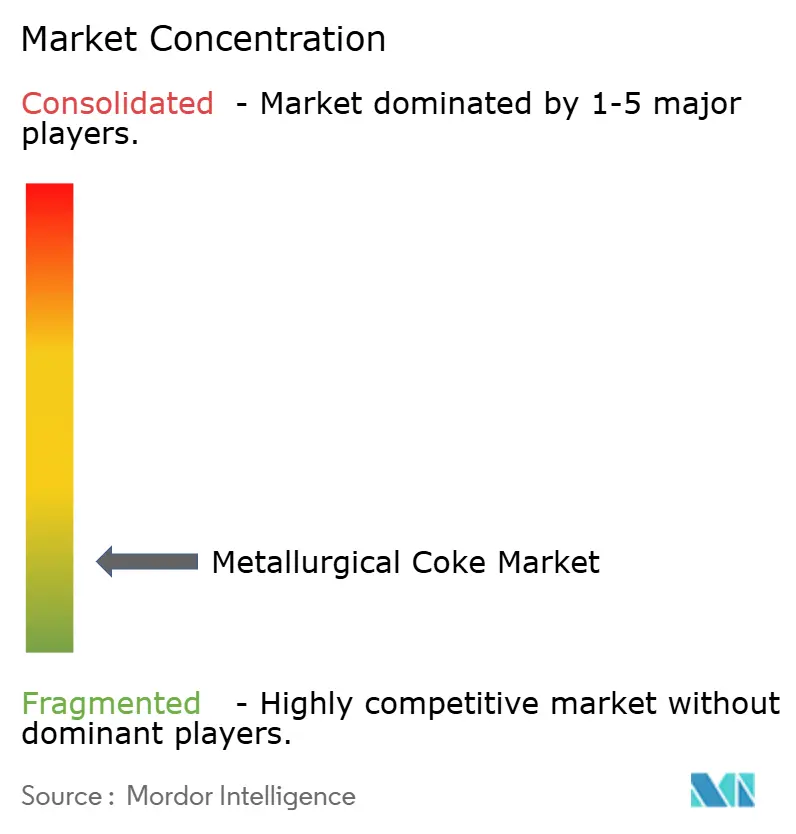
The Metallurgical Coke market is highly fragmented. Vertically integrated steelmakers such as China Baowu, ArcelorMittal, Nippon Steel, POSCO, Tata Steel, and JSW Steel operate captive batteries to secure supply and monetize by-products, while merchant specialists like SunCoke Energy use heat-recovery ovens to sell premium CSR coke at USD 15–20 per-ton mark-ups. The continuing wave of environmental retrofits and dry-quenching mandates tilts bargaining power toward well-capitalized integrated producers in the metallurgical coke market.
Metallurgical Coke Industry Leaders
ArcelorMittal
Tata Steel
China Baowu Steel Group
Nippon Steel Corporation
POSCO
- *Disclaimer: Major Players sorted in no particular order
Metallurgical Coke Market Companies Covered in this Report
- ArcelorMittal
- BlueScope Steel Ltd.
- China Baowu Steel Group
- China Shenhua Energy Co. Ltd.
- Drummond Company Inc.
- Gujarat NRE Coke Ltd. (GNCL)
- Hickman-Williams & Company
- Jiangsu Surung High-Carbon Co. Ltd.
- JSW Steel Ltd.
- Mahalaxmi Ennore Coke Pvt Ltd
- Mechel PAO
- Nippon Steel Corporation
- OKK Koksovny a.s.
- POSCO
- Shanxi Coking Coal Group
- SunCoke Energy Inc.
- Tata Steel Ltd.
- United States Steel Corporation

Market Opportunities and Future Outlook
New capacity and modernization programs point to whitespace around import substitution, higher-quality low-ash output, and more efficient coking configurations that fit tighter emissions requirements. In Kazakhstan, Qarmet secured a USD 337 million, 13-year loan from the Development Bank of Kazakhstan in February 2026 to finance a new coke oven battery complex with 1.5 million mt annual capacity. In May 2026, the Kazakhstan government signed an investment agreement to build a metallurgical coke plant in Karaganda with 1 million mt annual capacity by 2031, targeting reduced reliance on imported coke and more stable supply for domestic steelmaking.
In India, project development continues alongside policy volatility that is reshaping buying patterns. Green Coke and Energy Private Limited signed an MoU in April 2026 with Kakinada SEZ Limited to set up a metallurgical coke plant in Andhra Pradesh with an investment of INR 700 crore, highlighting interest in coastal manufacturing and logistics advantages. At the same time, import restrictions and anti-dumping actions have increased procurement uncertainty and cost pass-through pressure for blast-furnace operators. This environment supports opportunities for domestic producers and new entrants that can deliver consistent low-ash grades and adopt process upgrades, including dry quenching and advanced gas cleaning, to meet tighter environmental expectations while improving unit economics.
Recent Industry Developments in Metallurgical Coke Market
- July 2026: Tata Steel received a criminal summons from the Dutch Public Prosecution Office related to alleged pollution at its IJmuiden coke plants and stated it will contest the allegations. The case adds compliance and operational risk around one of Europe’s key integrated steel sites, influencing decisions on remediation spend, production continuity, and potential restructuring of coke-related assets.
- May 2026: India’s Ministry of Steel formally requested the finance ministry to withdraw anti-dumping duties on low-ash metallurgical coke imports, citing domestic supply shortages and higher steelmaking costs. The request signaled a potential policy pivot that can quickly change import flows and price discovery for merchant coke in an import-reliant market.
- January 2026: SunCoke Energy executed a one-year contract extension with United States Steel to supply metallurgical coke from its Granite City facility through December 31, 2026. The extension reinforces merchant coke’s role in ensuring blast-furnace feed continuity and supports utilization stability for U.S. coke capacity amid tightening environmental requirements.


Metallurgical Coke Market Report Scope and Research Methodology
Market Definition and Coverage
This market covers metallurgical coke supplied for industrial use, mainly as a reducing agent and fuel in ironmaking and steelmaking, and then tracked in terms of physical volume traded and consumed across regions.
Scope exclusions: Coke made and used purely for non-metallurgical heating uses, as well as unrelated coal and iron ore mining revenues, are not counted.
Segments Covered in This Report
- By Coke Type
- Blast-Furnace Coke
- Foundry Coke
- Nut Coke
- Coke Breeze
- By Grade
- Low Ash (8 to 12% Ash)
- High Ash (more than 15% Ash)
- By Application
- Iron and Steel Making
- Foundry Castings
- Sugar Processing
- Glass Manufacturing
- Other Applications
- By End-User Industry
- Integrated Steel Producers
- Mini-mills / EAF Operators
- Foundries
- Non-ferrous Metallurgy
- Other End-user Industries
- By Geography
- Asia-Pacific
- China
- India
- Japan
- South Korea
- ASEAN Countries
- Rest of Asia-Pacific
- North America
- United States
- Canada
- Mexico
- Europe
- Germany
- United Kingdom
- Italy
- France
- Russia
- Rest of Europe
- South America
- Brazil
- Argentina
- Rest of South America
- Middle East and Africa
- Saudi Arabia
- United Arab Emirates
- South Africa
- Egypt
- Rest of Middle East and Africa
- Asia-Pacific
Data Sources, Market Sizing, and Validation
Desk Research
We first build the fact base using public, non-paywalled references that help anchor steel output, coke consumption patterns, and trade flows. Sources used include, such as World Steel Association crude steel statistics, World Bank macro indicators, UN Comtrade customs trade data for coke-related HS codes, USGS and other national geological agencies for coal and coke context, and energy or industrial ministries where country production series are published.
After that, the supply side is mapped using company annual reports, investor presentations, and sustainability disclosures (where blast furnace route details are often discussed), plus reputed press for capacity additions or shutdowns. When needed, we also use paid company financials and intelligence subscriptions and an import-export shipment-level database to speed up cross-checks on capacity ownership and trade direction. The desk research sources listed here are illustrative, and many other references were reviewed to collect inputs, validate assumptions, and clarify unclear data points.
Primary Interviews and Surveys
To close data gaps, we conduct expert interviews and structured surveys with steel producers, coke plant operators, traders, and downstream buyers, and then test the key assumptions that influence volume conversion and utilization. Because this is a global market, inputs are balanced across APAC, EMEA, and the Americas, so regional operating rate changes and import reliance are not overstated or understated.
Distribution of primary research fieldwork respondents
| Company type | Respondent position | Region |
|---|---|---|
| Top tier: 35% | CXOs: 15% | APAC: 38% |
| Mid tier: 50% | Functional/Unit leaders: 38% | EMEA: 35% |
| Smaller Players: 15% | Managers: 47% | Americas: 27% |
Market-Sizing & Forecasting
Sizing starts with a top-down reconstruction of demand, where crude steel production by route is converted into metallurgical coke requirement using blast furnace operating patterns and typical coke rate ranges, and then adjusted for trade and stocking behavior. Once that demand pool is formed, it is checked using selective bottom-up approximations, such as rolling up known cokemaking capacities by country, applying utilization ranges, and validating implied supply with import-export direction and price signals.
A few practical inputs shape the model, including blast furnace based steel share versus EAF share, coke rate per ton of hot metal, coke plant utilization, seaborne trade volumes for met coke, and the timing of major shutdowns or capacity ramps. When a country has limited disclosures, proxy indicators like steel output, trade reliance, and reported operating rate ranges from interviews are used, and the gap is kept visible for later validation.
For forecasting, scenario analysis is used because the market is sensitive to steel cycle swings, policy driven changes in route mix, and disruption risks in coal sourcing. Expert feedback is used to set the base case and to stress test upside and downside paths, and then annual volumes are smoothed so short-term spikes are not carried forward without evidence.
Data Validation & Update Cycle
Validation is done by triangulating the final totals against independent signals, such as route-wise steel output trends, met coke trade balance checks, and plausible utilization ranges for major producing regions. If any region shows an unusual jump, we re-check the conversion factors, review trade timing, and reconnect with industry participants to confirm whether the shift was structural or only a temporary supply event.
Before sign-off, the model and assumptions go through multi-step internal reviews so the calculation logic, units, and year labels stay consistent. The report is refreshed annually, and interim updates are triggered when material events occur, such as major blast furnace closures, new cokemaking capacity, or sharp pricing moves that change operating rates. Right before delivery, a fresh analyst pass is completed so clients receive the latest updated view.
Mordor Intelligence's Metallurgical Coke Market Estimate Compared With Other Published Estimates
Published market sizes for metallurgical coke do not always match because some studies size in physical volume, while others report revenue, and the timing of price capture can change totals quickly. Differences also come from how closely the steel route mix is tracked, which applications are treated as in-scope, and how trade is handled when production and consumption happen in different countries.
In a refresh-led approach, the spread usually widens when older average selling price assumptions are carried forward, currency conversion is not aligned to the same period, or utilization shifts are not revalidated after major steel or coal events. The table reflects those practical drivers, including whether adjacent coke uses are bundled in and whether the scope is defined as factory gate value versus end market consumption.
Benchmark comparison
| Source | Market Size | Gaps in Research Methodology |
|---|---|---|
| Mordor Intelligence | USD 545.78 M (2025) | |
| Global Consultancy A | USD 205.43 B (2025) | Reported as factory gate value in USD, which depends heavily on price timing and currency conversion, and it also bundles a wider application set beyond steelmaking, so it is not directly comparable to a volume-based estimate. |
| Industry Publisher B | USD 38.99 B (2025) | Revenue sizing is used with a different grade and process taxonomy and a longer forecast window, and the implied ASP path can diverge if steel route mix and utilization updates are not refreshed in step with recent operating changes. |
The main takeaway is that unit choice and refresh timing drive most of the gap. By updating conversion factors and checking volume signals first, and only then translating assumptions into consistent year timing, Mordor Intelligence avoids mixing older ASPs and misaligned currency periods into the same year, which keeps the estimate traceable to steel output, trade, and operating rate checks.


Key Questions Answered in the Report
How fast will global metallurgical coke demand grow through 2031?
Volume is forecast to climb from 563.85 million tons in 2026 to 675.19 million tons by 2031, a 3.67% CAGR.
Why is Asia-Pacific the dominant buyer of metallurgical coke?
China and India operate the largest blast-furnace fleets and keep expanding integrated mills to meet infrastructure and construction demand.
Which coke grade is gaining the most market traction?
Low-ash (8–12%) coke is expanding at a 4.59% CAGR because it lifts blast-furnace productivity and lowers slag generation
How do dry-quenching systems benefit coke producers?
CDQ recovers heat to make power, cuts water use 90%, and raises coke strength, enabling USD 15–20 per-ton price premiums.
What risks threaten supply stability?
Cyclone-driven rail outages in Australia, tighter emission rules in China and the EU, and volatile hard-coking-coal prices all disrupt supply chains.
Page last updated on:


 Your data is secure and never sold or shared.


